
Welcome to another crypto market outlook for the 16th of March!
With clear positive news, the crypto market has been recovering slowly and steadily. Is this just a short-lived correction phase, or will it evolve into an impulse move that shifts the entire trend from bearish to bullish? Let’s find out together.
Today, we will cover the following topics:
– Market Heatmap and Fear and Greed Index
– US500 and DXY
– USDT.D, Bitcoin and Ethereum Analysis
– Quotes / Advices
– Closing Remarks
Market Heatmap and Fear and Greed Index
The overall sentiment still signals uncertainty, as the heatmap shows a mix of green and red. However, optimism is clearly building, especially with many altcoins returning to their 2023 levels—considered a discounted price for traders.
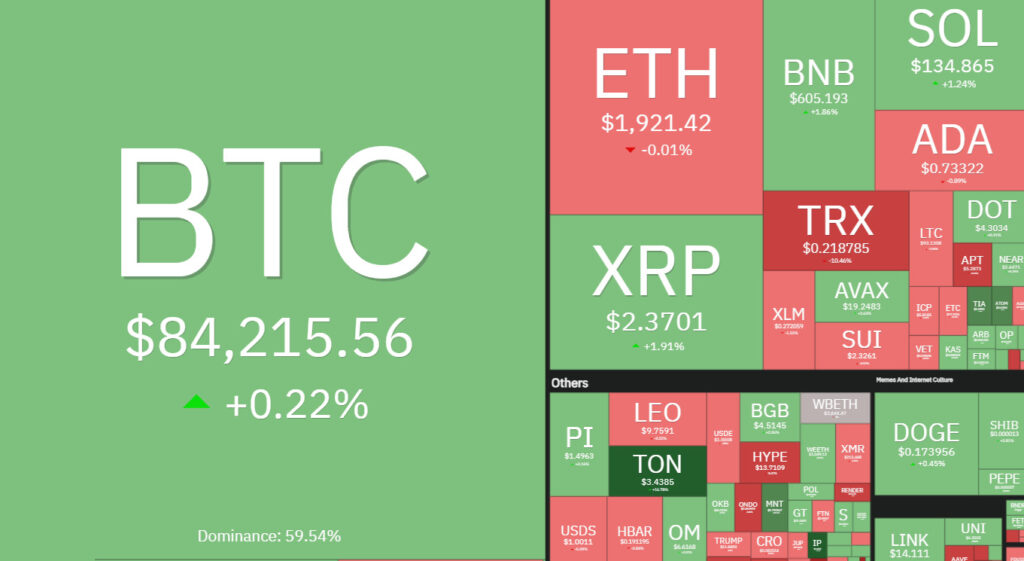
The Fear and Greed Index continues to signal “Fear” for another week, indicating that the accumulation phase is still underway. Are you buying at a discount, or are you still on the sidelines?

US500 and DXY analysis
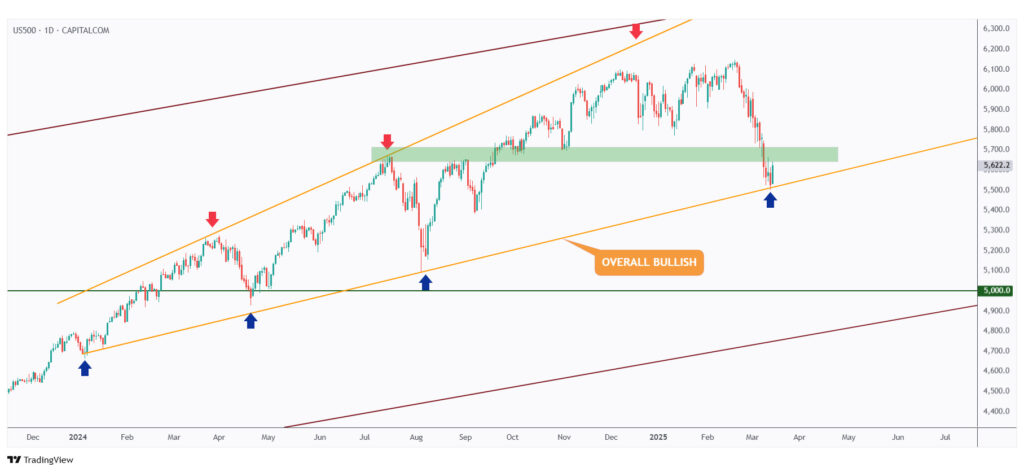
As per our last US500 update, it remains overall bullish, trading within the rising wedge pattern marked in orange.
Currently, US500 is hovering around the lower bound of the wedge. As long as this level holds, I expect the bulls to step in at any moment.
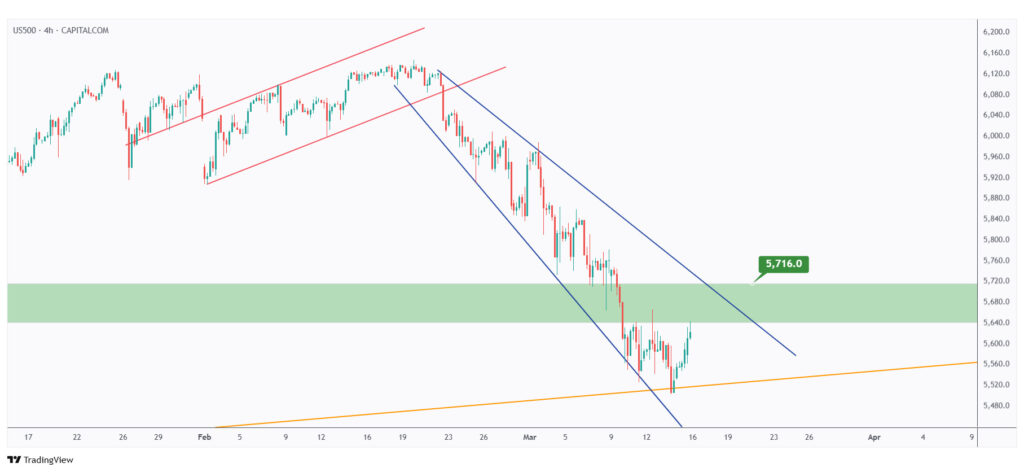
For the bulls to initiate the next impulse wave on US500, which would be positive for both the stock and crypto markets, a break above the daily structure at $5,716 is required.
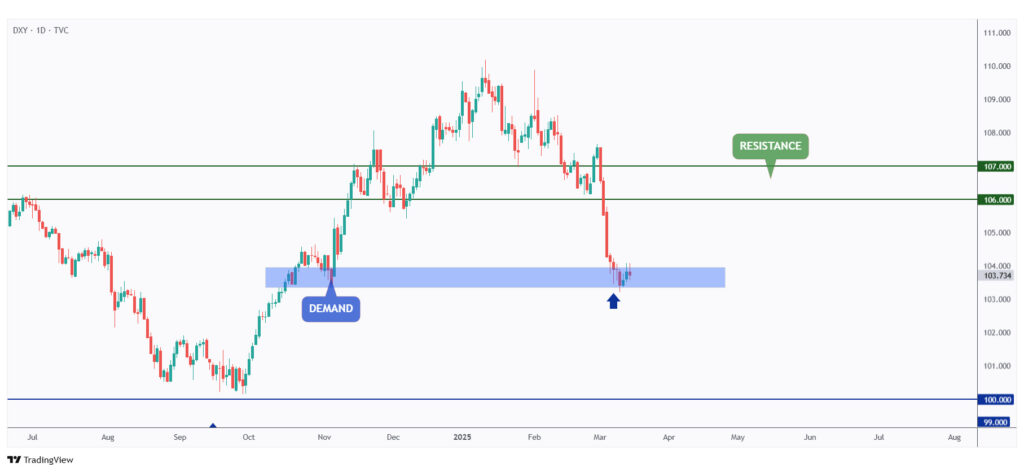
DXY has been sluggish this week, showing very low momentum as it continues to hover around the demand zone marked in blue.
As long as this demand zone holds, the bulls still have the potential to step in for a correction toward the $106 resistance level.
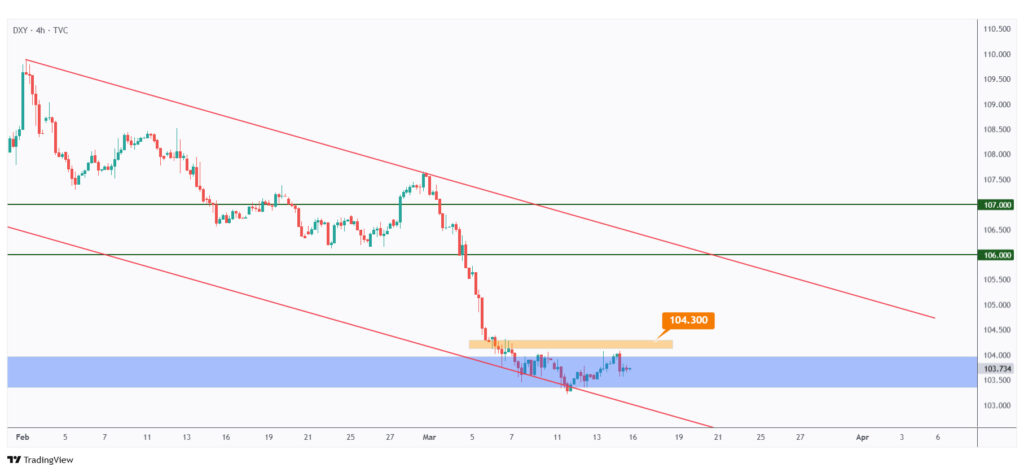
In the short term, DXY has been range-bound, forming an inverse head and shoulders pattern.
For the bulls to confirm control, a break above the neckline, marked in orange at $104.3, is required.
USDT.D, Bitcoin, and Ethereum analysis
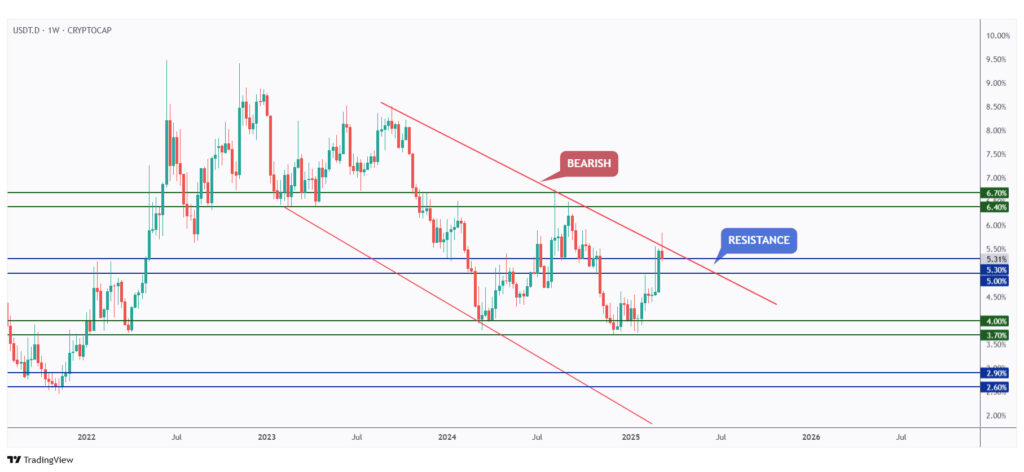
According to our last market outlook, USDT.D is still hovering around the upper bound of its falling channel, marked in red.
As long as the upper red trendline holds, I expect a bearish impulse from this level, which would be healthy for the crypto market.
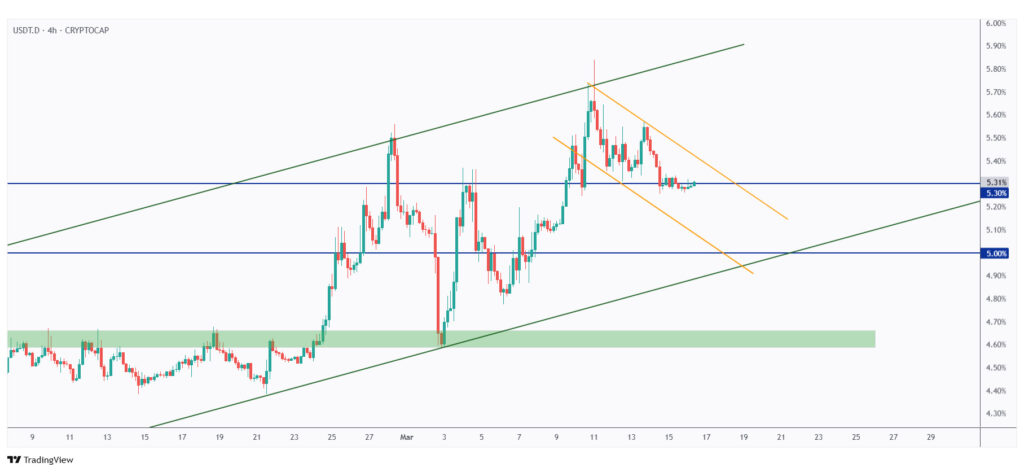
In the short term, as long as USDT.D remains within the falling orange trendline, the overall sentiment will remain bullish for crypto.
The next support for USDT.D is at the intersection of the orange and green trendlines with the 5% support level.
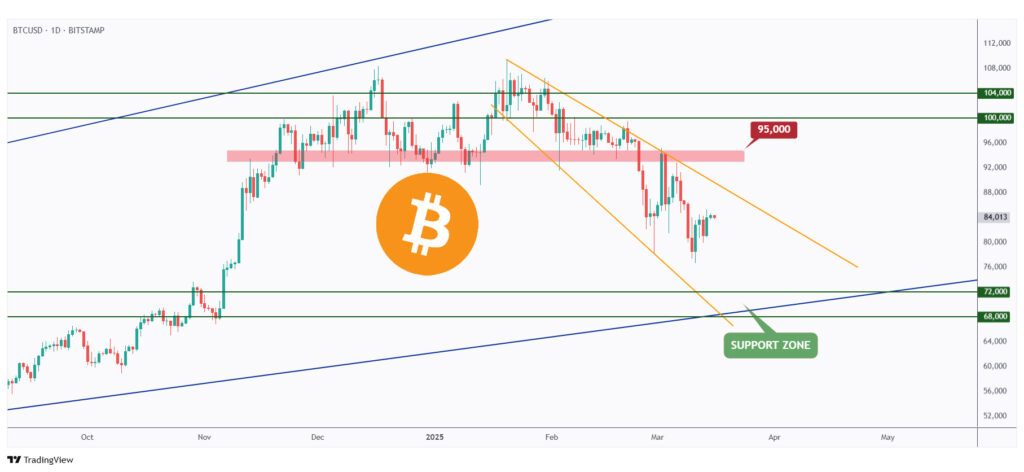
As mentioned in our last roundup article, BTC’s momentum shifted to bearish after breaking below the $95,000 structure.
Currently, BTC is in a correction phase, retesting the upper bound of its falling wedge pattern, marked in orange.

For the bulls to maintain short-term control and push toward the upper orange trendline, a break above the last minor high, marked in blue at $85,000, is required.
In parallel, if the rising channel, marked in red, is broken to the downside, a bearish continuation in line with the overall trend would be expected.
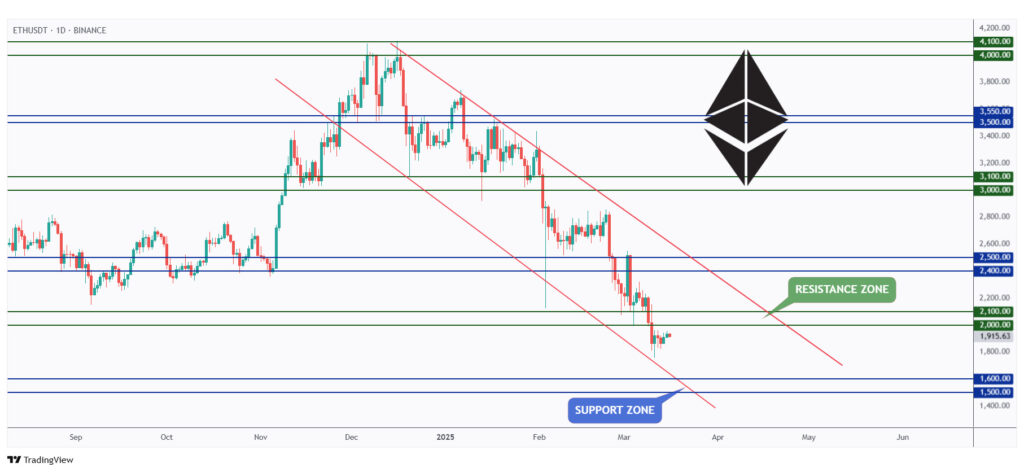
After breaking below the $2,000 support, ETH has entered a minor correction phase, retesting the $2,000 level, which has now turned into resistance.
As long as $2,000 holds as resistance, a bearish continuation toward the lower bound of the red channel and the $1,500 level remains possible.
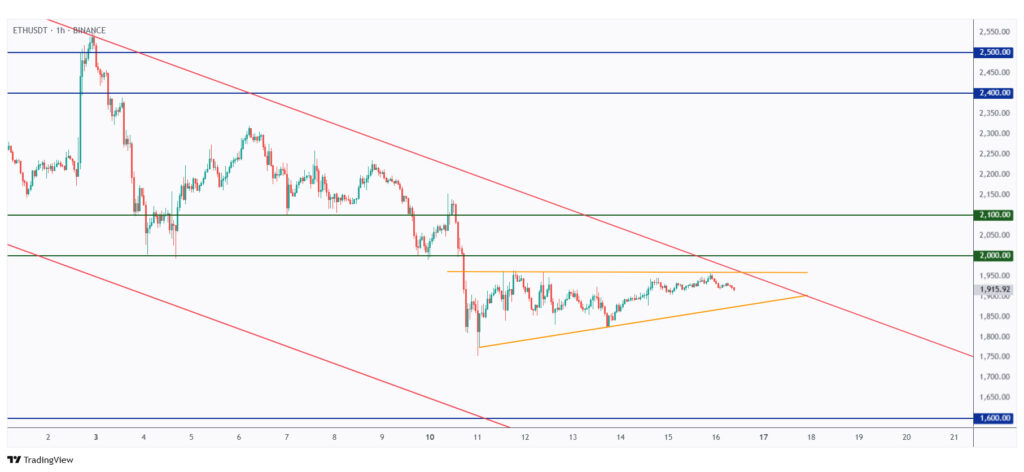
In the short term, ETH has been trading within an ascending triangle, marked in orange.
If the triangle breaks to the downside, a bearish impulse toward $1,500 would be highly likely.
Meanwhile, for the bulls to regain long-term control, a break above the upper bound of the resistance zone at $2,100 is required.
Quotes / Advices
Stock price movements actually begin to reflect new developments before it is generally recognized that they have taken place.
~ Arthur Zeikel
Closing Remarks
In summary, the market remains in a state of uncertainty, with the heatmap showing mixed signals and the Fear and Greed Index still indicating “Fear,” suggesting the accumulation phase is ongoing.
US500 continues to trade within a rising wedge, with a bullish outlook as long as support holds. A break above $5,716 could trigger the next upward impulse.
Meanwhile, DXY remains sluggish near a demand zone, with a potential correction toward $106 if bulls regain momentum.
USDT.D is hovering near the upper bound of its falling channel, with a bearish impulse expected if resistance holds.
BTC remains in a correction phase, needing a break above $85,000 to regain bullish momentum, while ETH struggles below $2,000, with a bearish outlook toward $1,500 unless resistance is broken.