

Welcome to another crypto market outlook for the 9th of March!
A Crypto Strategic Reserve has been signed by Trump, something we’ve all been waiting for. But the market isn’t reacting as expected. Is this a shakeout to flush out weak hands before the real pump begins? Let’s explore the possible scenarios together.
Today, we will cover the following topics:
– Market Heatmap and Fear and Greed Index
– US500 and DXY
– USDT.D, Bitcoin and Ethereum Analysis
– Quotes / Advices
– Closing Remarks
Market Heatmap and Fear and Greed Index
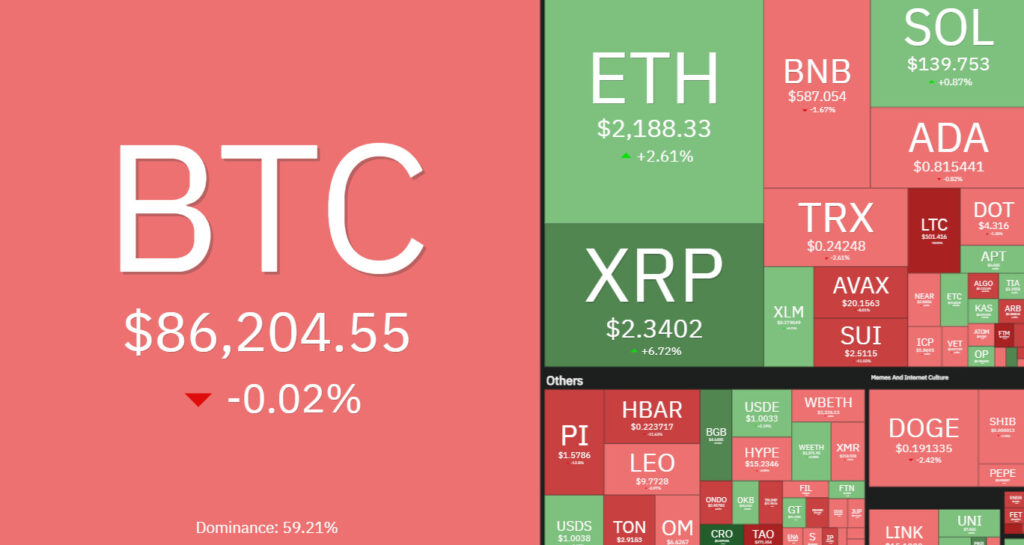
BTC has been stagnant this week, while ETH seized the opportunity to surge by over 2.5%. The crypto heatmap shows a mix of red and green, indicating market uncertainty.
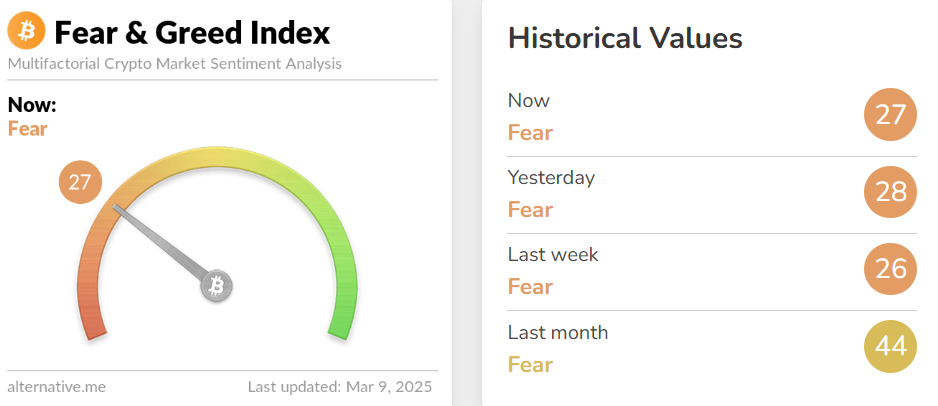
The Fear and Greed Index has been signaling fear for an entire month now. A prolonged period of fear usually indicates the beginning of the accumulation phase, so be prepared!
US500 and DXY analysis
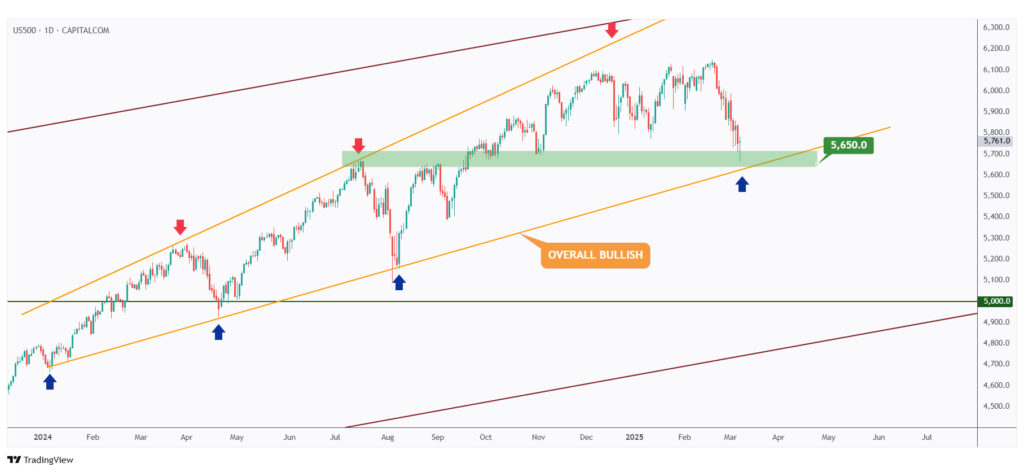
As per our last market outlook, the US500 has been overall bullish, trading within the rising wedge pattern marked in orange.
This week, the US500 has been in a correction phase and is currently approaching the lower boundary of the wedge, which aligns perfectly with the $5,650 structure marked in green.
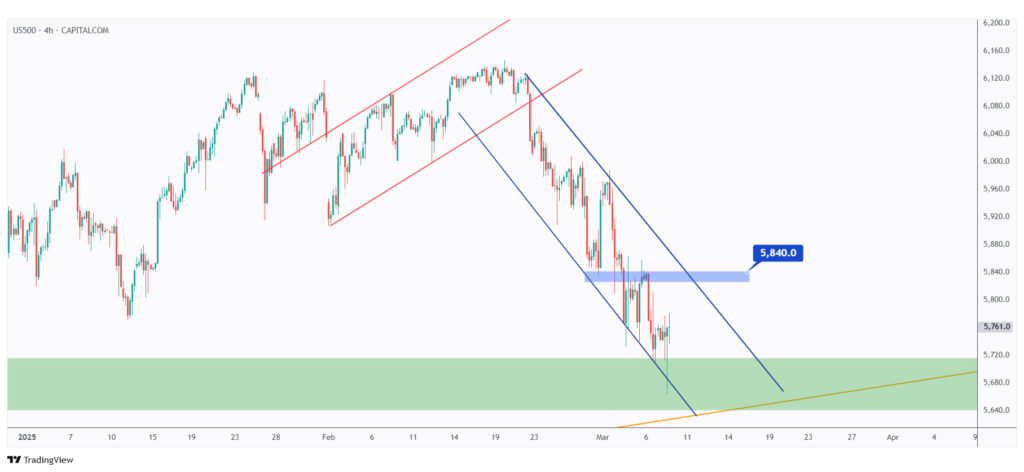
The bearish correction phase is contained within the falling channel marked in blue.
For the bulls to regain control and initiate a bullish impulse in line with the overall uptrend, a break above the last major high marked in blue at $5,840 is required.

After breaking below the $106–$107 zone, DXY dipped sharply last week.
However, it is currently retesting a strong demand zone marked in blue. As long as this zone holds, a bullish correction phase is expected.
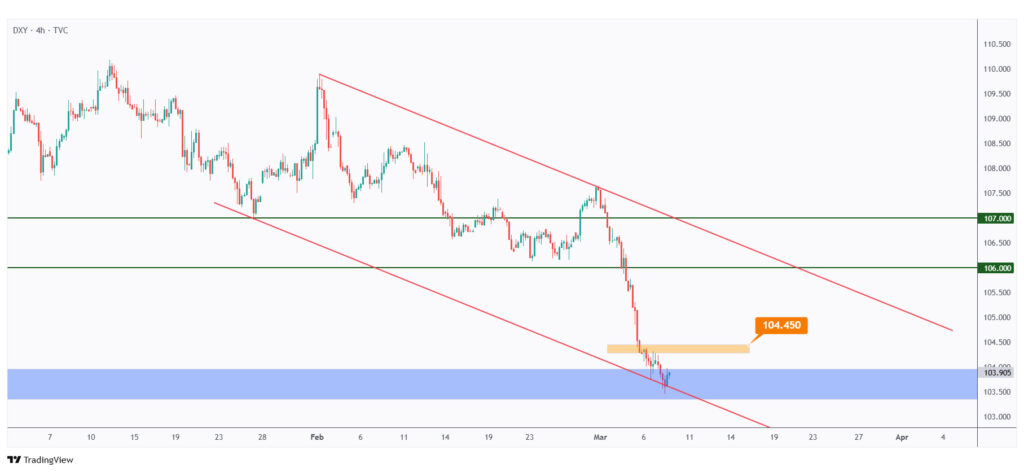
Medium-term, DXY is rejecting the lower boundary of its falling channel.
Short-term, for the bulls to take control and initiate a correction phase toward the $106 resistance level, a break above the last high marked in orange at $104.45 is required.
USDT.D, Bitcoin, and Ethereum analysis
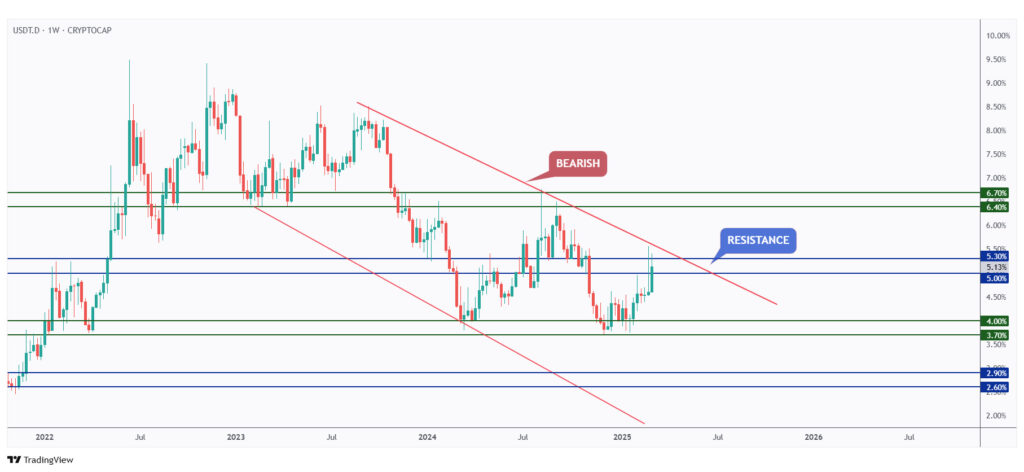
USDT.D is still hovering around the upper bound of its falling channel in red and the 5% resistance zone, as mentioned in our last market overview.
As long as the 5.3% resistance level holds, bears are expected to step in aggressively, which would be extremely bullish for the crypto market.
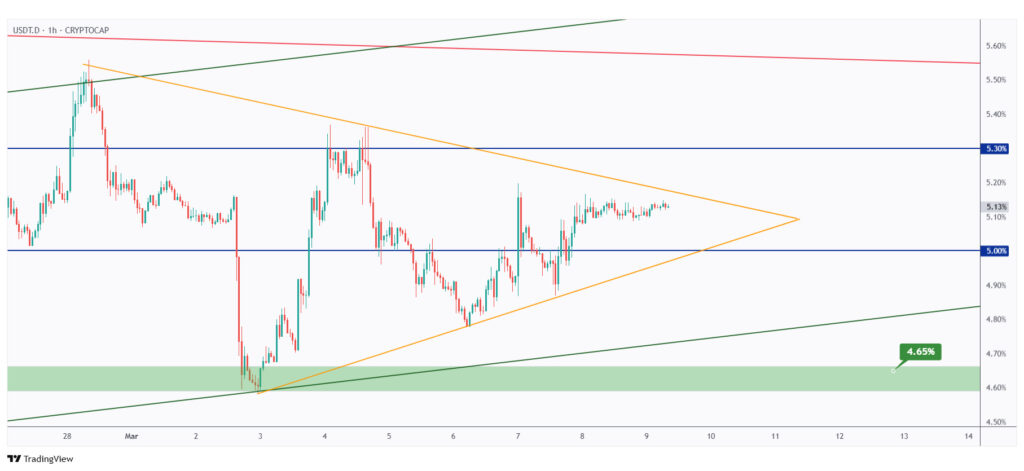
As volatility declines, USDT.D has been trading within a symmetrical triangle marked in orange.
If the 5% level breaks to the downside, it could signal the beginning of a bullish phase in the crypto market.
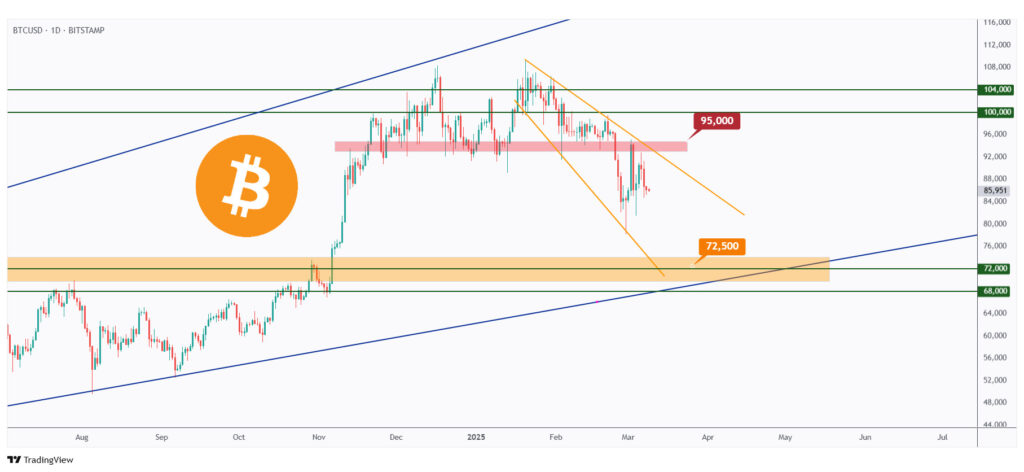
After breaking below the $95,000 structure marked in red, BTC’s momentum has shifted to bearish, as mentioned in our last market outlook.
As long as the falling wedge pattern in orange holds, a further decline toward the $72,500 mark is expected.

Just like USDT.D, BTC has been ranging within a symmetrical triangle.
If the triangle breaks to the downside, another bearish impulse move is likely, pushing toward the lower orange trendline.
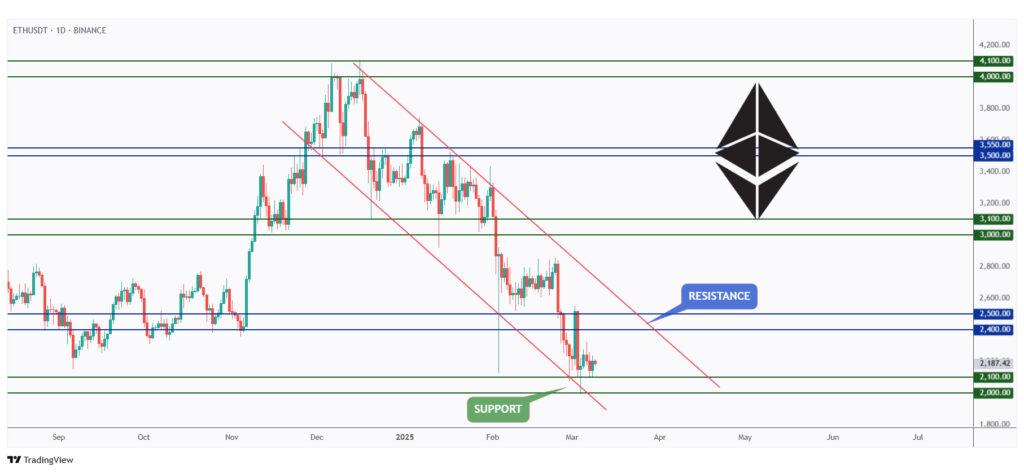
ETH is still holding strong above the $2,000 round number and support.
As long as this support remains intact, a bullish correction toward the upper red trendline and the $2,500 level is highly likely.
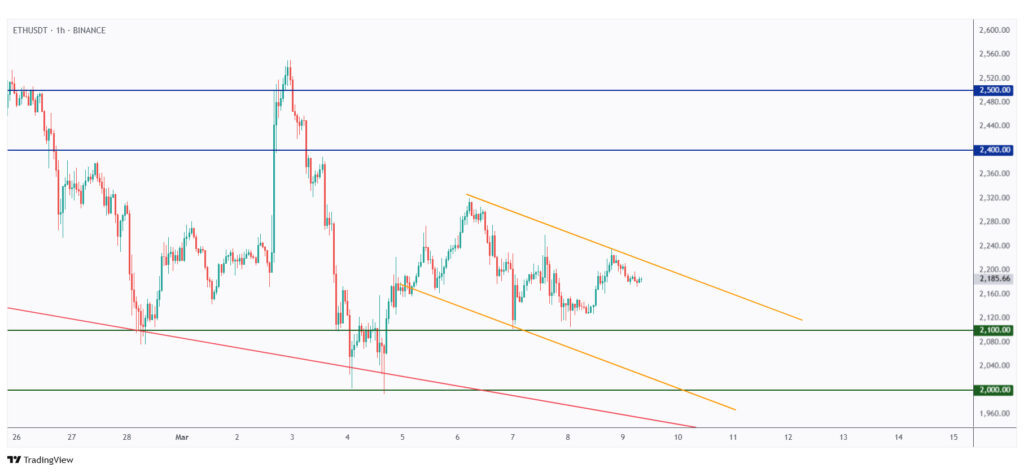
In the short term, ETH has been trading within the falling orange channel as part of a correction phase.
For the bulls to regain control, a break above the upper orange trendline is needed. Meanwhile, ETH may still dip within the $2,000–$2,100 range before pushing higher.
Quotes / Advices
Sometimes your best investments are the ones you don’t make.
~ Donald Trump
Closing Remarks
In summary, the Fear and Greed Index remains in fear mode, hinting at a potential accumulation phase.
The US500 is correcting within a rising wedge, with $5,650 as key support. A breakout above $5,840 could restore bullish momentum.
DXY is retesting a strong demand zone, needing a break above $104.45 for a bullish correction.
USDT.D remains near 5% resistance—if it breaks lower, a crypto rally could begin.
BTC is bearish after losing $95,000 support, with a possible drop to $72,500.
ETH holds above $2,000, with a bullish target of $2,500 if support remains intact.