
Welcome to our latest crypto market outlook for March 5th!
The crypto market is gradually recovering after hitting major support zones, making it the perfect time to grab your favorite tokens. Here are my top five picks for the week: NEAR, APT, KAITO, OP, and TAO.
Today, we will cover the following topics:
– USDT.D and BTC Analysis
– 5 Altcoins Analysis
– Quotes / Advices
– Closing Remarks
USDT.D and BTC analysis
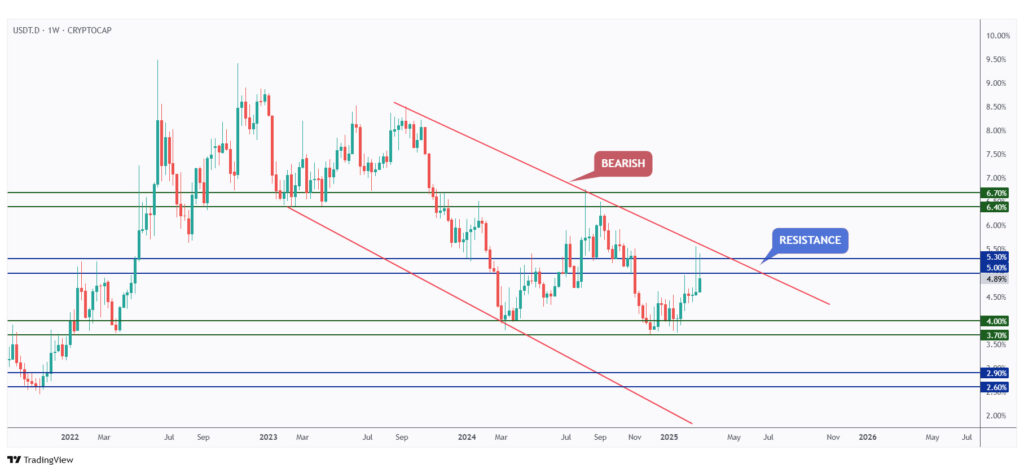
After being bullish for a couple of weeks, USDT.D is finally hitting resistance at 5%–5.3% as per our last market outlook.
As long as the resistance zone and upper red trendline hold, the overall bias would be bearish for USDT.D and bullish for crypto.
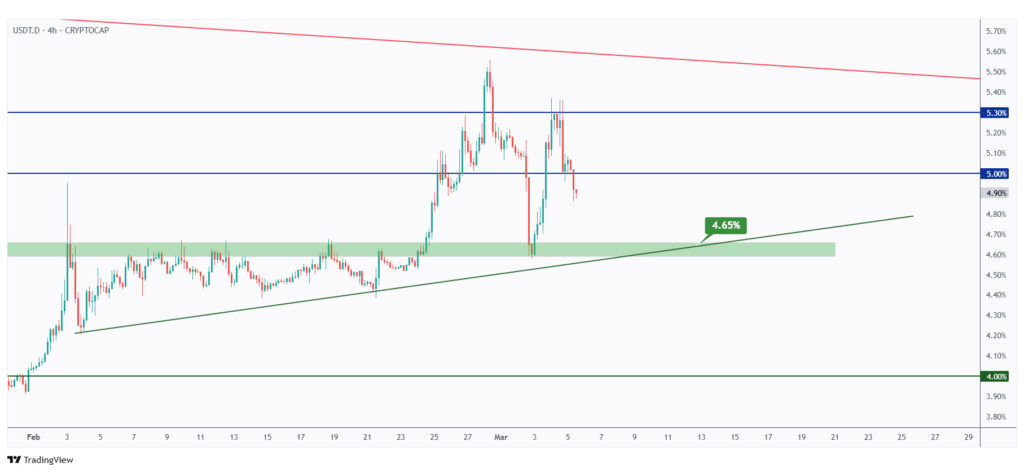
As long as the 5% resistance level holds, USDT.D will remain bearish, and a further decline towards the 4.65% structure is expected.
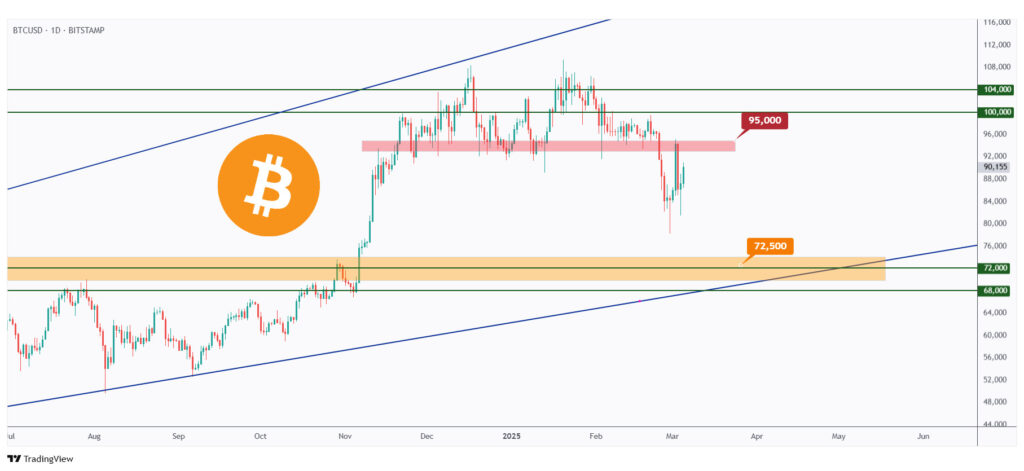
After breaking below the $95,000 structure marked in red, BTC has remained overall bearish, as mentioned in our last roundup article.
As long as the $95,000 resistance level holds, further bearish movement towards the $72,500 weekly support marked in orange is expected.
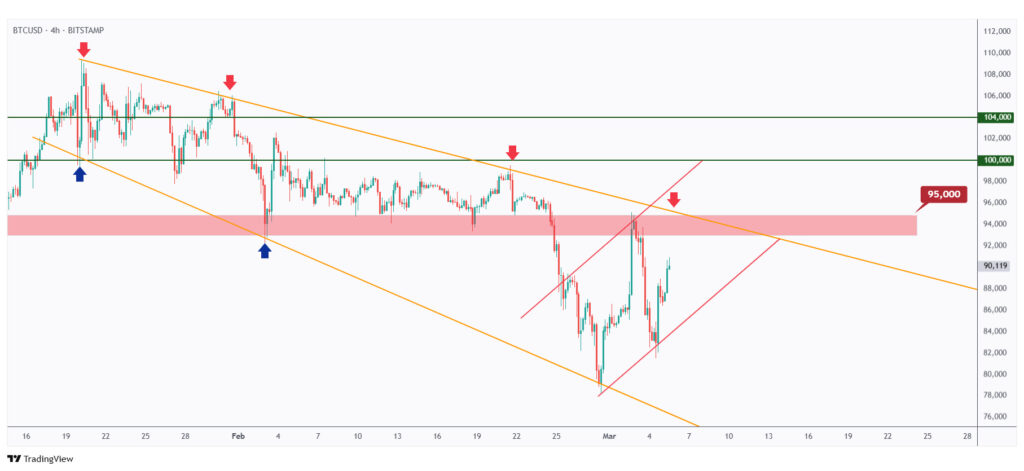
On the 4H timeframe, BTC has been bearish, trading within the falling wedge pattern marked in orange.
For the bulls to shift momentum in their favor in the medium term, a break above $95,000 is needed.
Meanwhile, if the red channel is broken downward, a bearish impulse toward $72,500 would be expected.
5 Altcoins Analysis
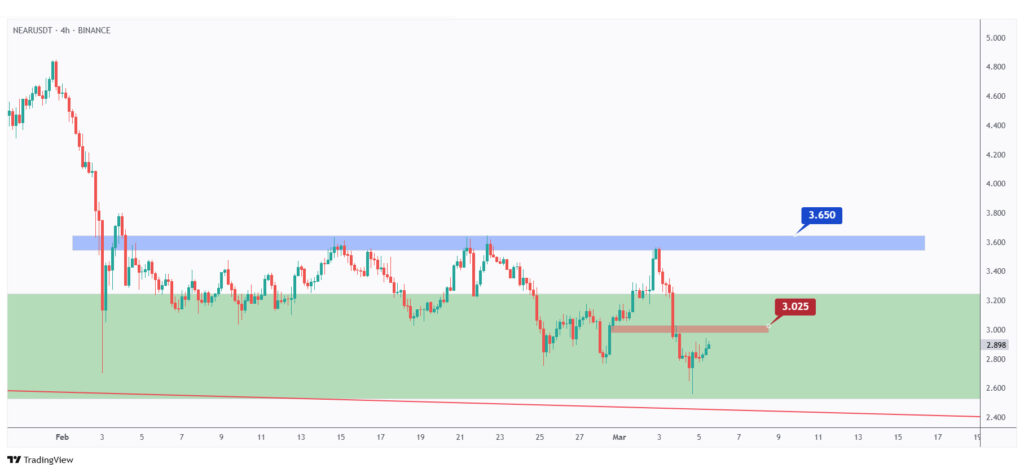
NEAR has been overall bearish from both long-term and short-term perspectives, trading within the falling channel marked in red.
However, it is currently hovering around a support level, the lower trendline, and the key $3 round number, so we will be looking for longs on lower timeframes.
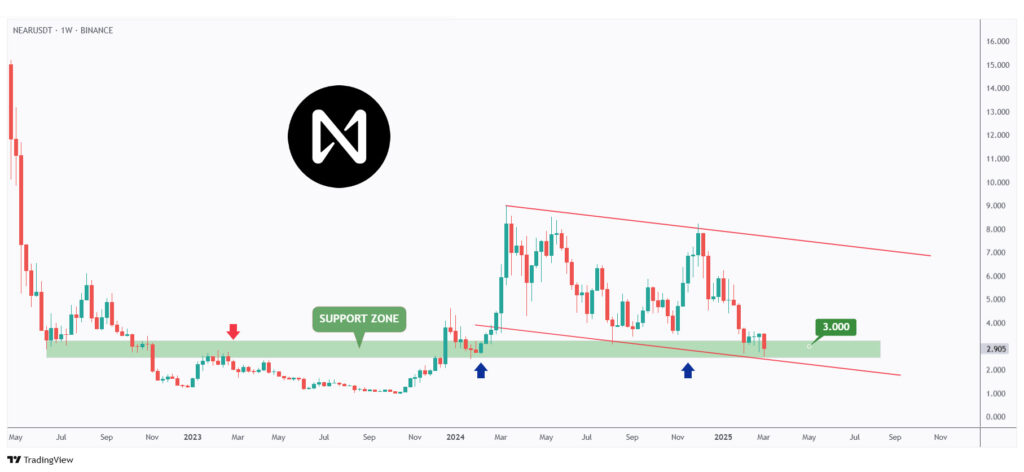
For the bulls to take over in the short term, a break above the last minor high at $3.025 is needed.
For the bulls to remain in control in the medium term, a break above the $3.65 major resistance is required.
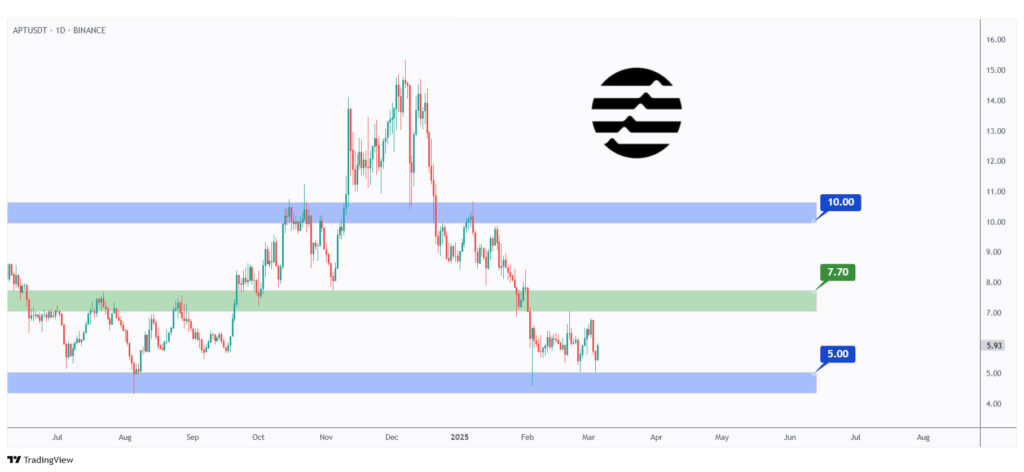
APT has been trading within a range between $5 support and $7.7 resistance.
Currently, APT is hovering around the lower bound of the range, so we will be looking for longs as long as it holds.
For the bulls to take over in the long term, a break above the $7.7 resistance is required.
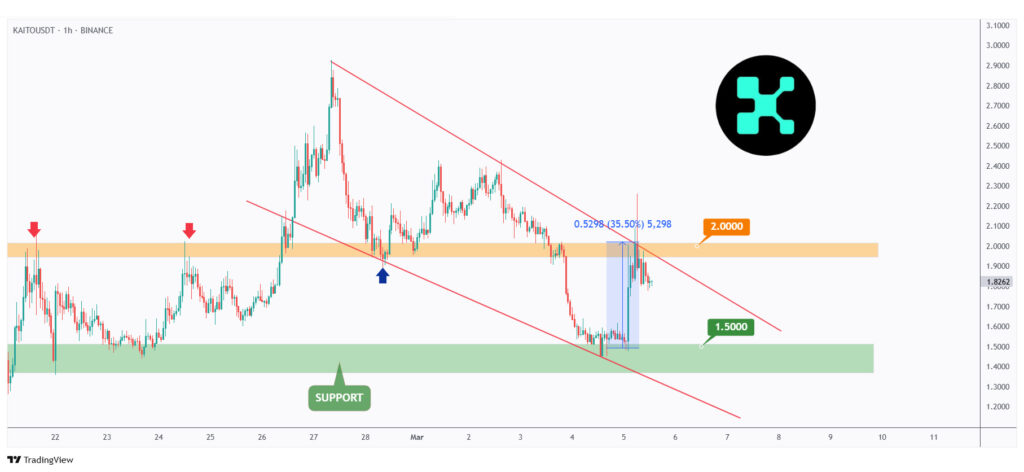
Next up is KAITO. As mentioned in our last Coin of the Week article, it rejected the $1.35–$1.5 support zone and surged by over 35%.
For the bulls to take over in the long term, a break above the $2 resistance level is needed.
Meanwhile, if it retests the $1.5 support, we will be looking for new longs.
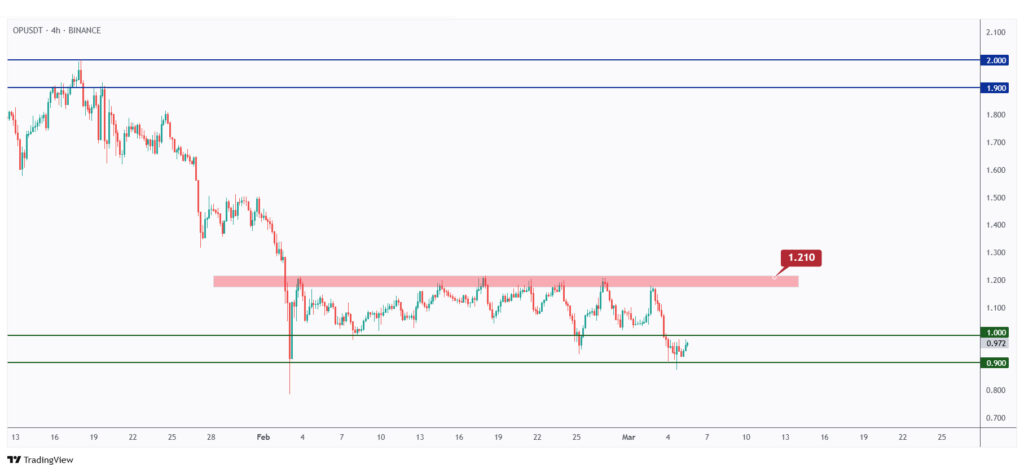
Analyzing OP, it is currently retesting the lower bound of its falling channel, marked in orange, and the $1 round number.
As long as the $0.9 support level holds, we will be looking for longs on lower timeframes.
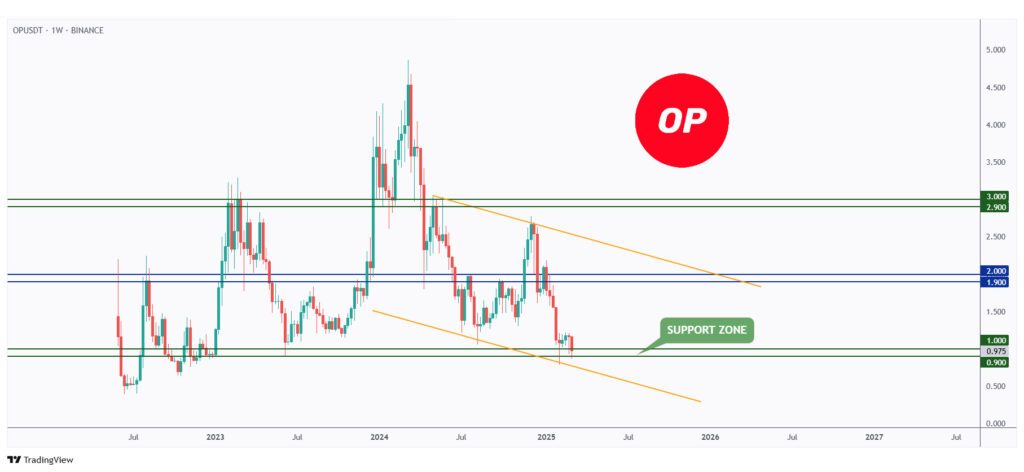
For the bulls to take over in the short term, a break above the $1 round number is required.
From a long-term perspective, a break above the major high at $1.21, marked in red, is needed for a full shift in momentum from the accumulation phase to the markup phase.
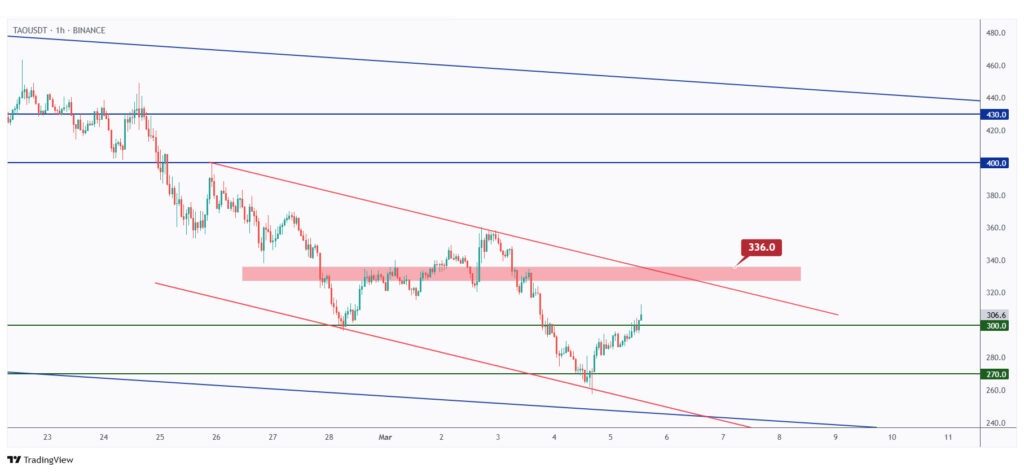
Last but not least, TAO has been rejecting the lower bound of its falling channel, marked in blue, which aligns perfectly with the round number $300.
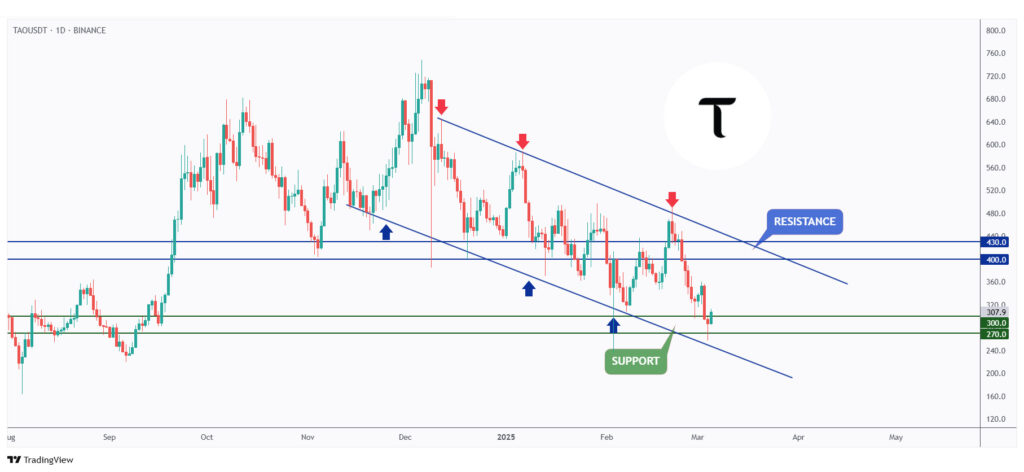
In the short term, for the bulls to take charge, a break above the falling red channel and the last high at $336 is needed.
Quotes / Advices
Hope is a bogus emotion that only costs you money.
~ Jim Cramer
Closing Remarks
In summary, BTC remains bearish, having broken below $95,000. As long as this resistance holds, further declines toward $72,500 are expected. Bulls need a break above $95,000 to shift momentum.
NEAR: Hovering around key support at $3, with bullish potential if it breaks above $3.025 short-term and $3.65 medium-term.
APT: Trading within a $5–$7.7 range, currently near support. A break above $7.7 is required for a bullish shift.
KAITO: Surged 35% after rejecting $1.35–$1.5 support. A break above $2 would confirm bullish control.
OP: Retesting $1 support. Bulls need to break $1 short-term and $1.21 long-term for momentum to shift.
TAO: Holding the $300 support. A break above $336 is required for a bullish reversal.