

Welcome to our latest crypto market outlook for March 12th!
Almost all altcoins are rejecting strong support or demand zones. This is the best time to start shopping for your favorite bags at a discount. Here’s what my cart looks like for this week: PENDLE, XLM, MOVE, ENA, and XRP.
Today, we will cover the following topics:
– BTC Analysis
– 5 Altcoins Analysis
– Quotes / Advices
– Closing Remarks
BTC analysis
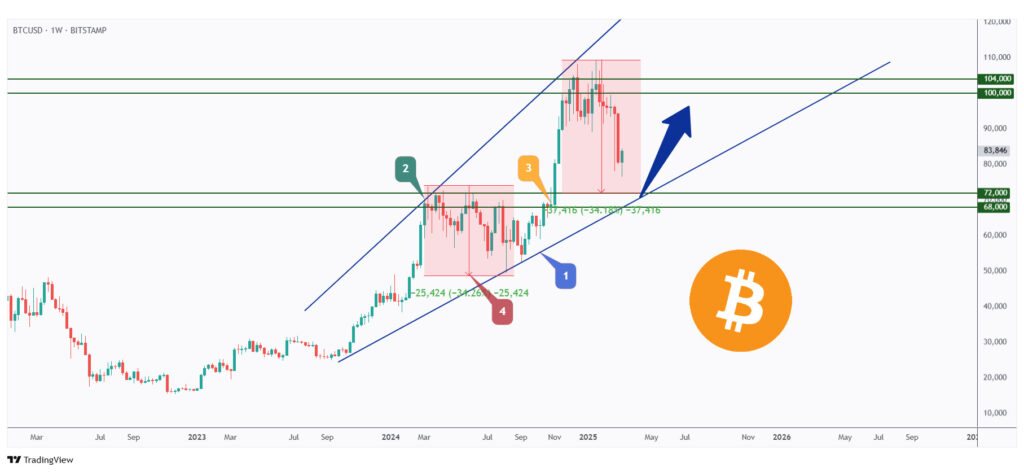
As per our last BTC update, it is currently retesting a significant zone between $68,000 and $72,000, which marks the intersection of four key rejection points.
This zone aligns with the lower blue trendline, the $70,000 support level, the demand zone, and the 34% correction phase.
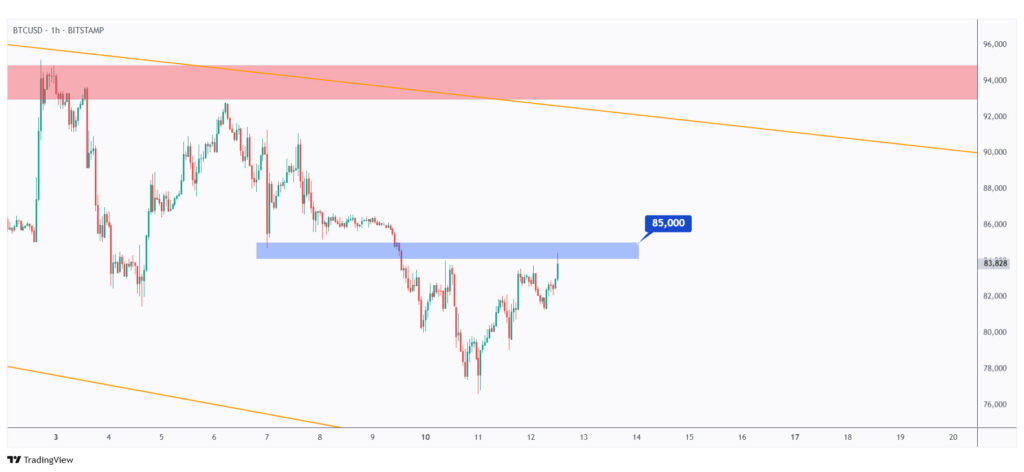
For the bulls to take control in the short term and push towards $90,000 and the upper orange trendline, a break above $85,000 is required.
Meanwhile, BTC could still move lower toward the $72,000 support level.
5 Altcoins Analysis
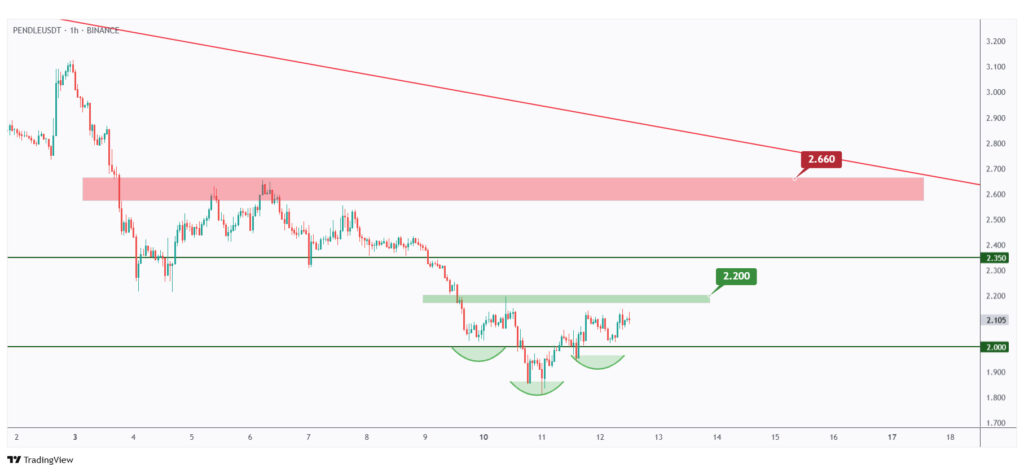
PENDLE has been trading within a broad range between $2 and $8 as mentioned in our last market overview.
Since it is currently hovering around the $2 support level, we will be looking for buy setups on lower timeframes.
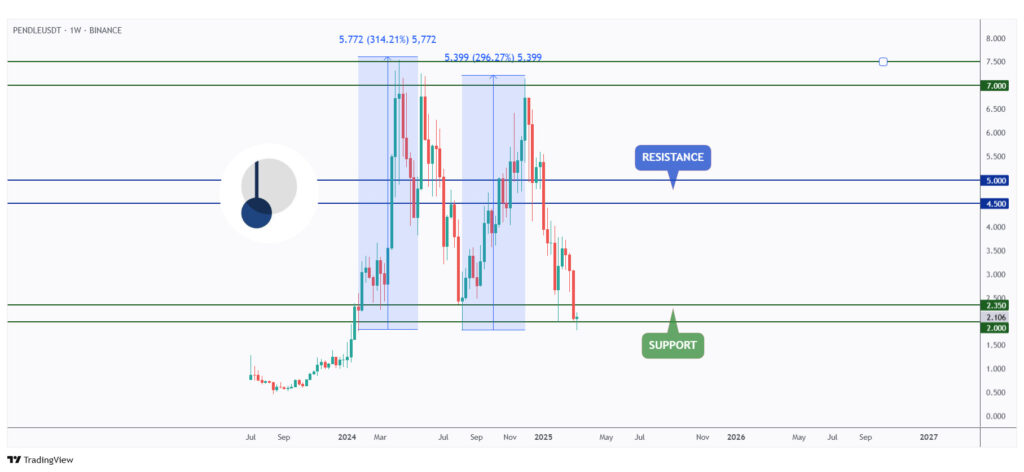
For the bulls to take control in the short term, a break above the inverse head and shoulders neckline at $2.20 is needed.
To shift the momentum in their favor long-term, a break above the last major high, marked in red at $2.66, is required.
XLM has been in an extended correction phase, forming a large falling wedge pattern marked in orange.
As it approaches the lower bound of the wedge, this level also aligns with the $0.20 round number and the demand zone.
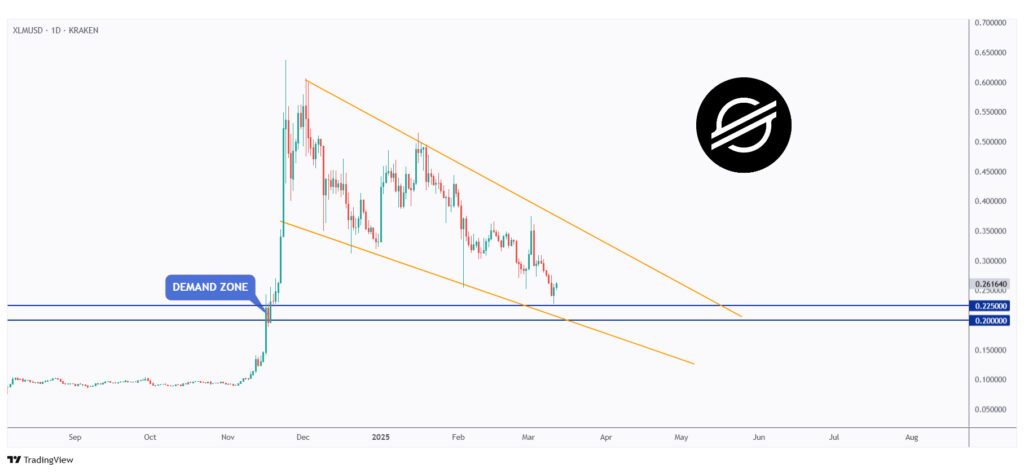
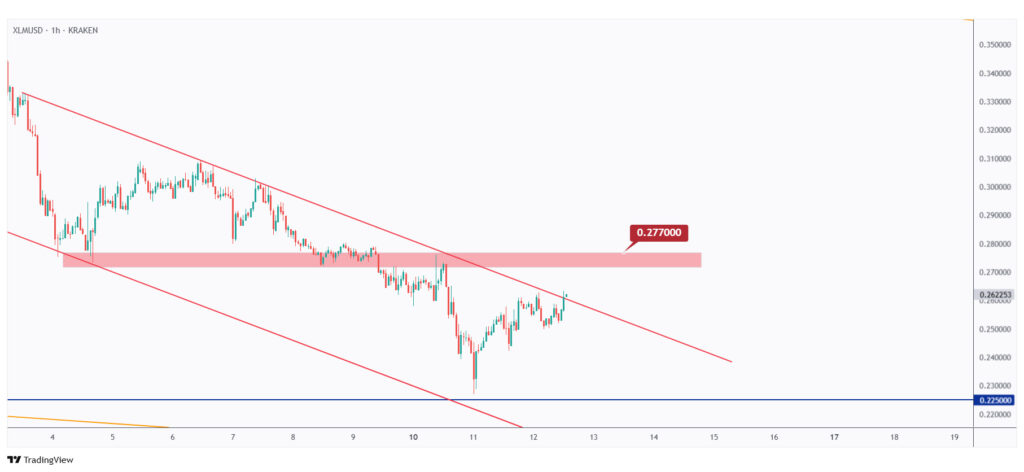
Short-term, XLM has remained bearish, trading within the falling channel marked in red.
For the bulls to gain the upper hand, a break above the upper red trendline and the $0.27 level is needed.
In such a scenario, a move toward the upper orange trendline from the daily timeframe would be expected.
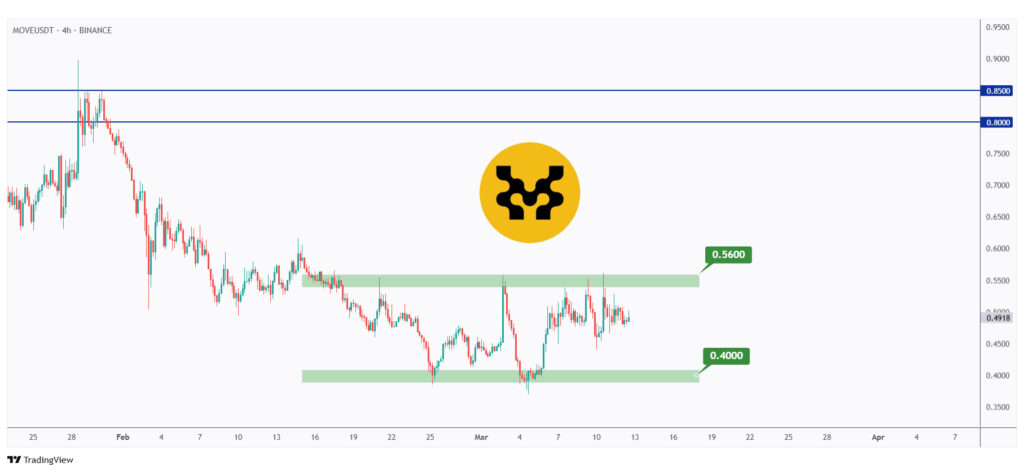
Analyzing MOVE, it has been hovering within a tight range marked in green between $0.40 and $0.56.
For the bulls to take control and push toward the $0.80 resistance level, a break above $0.56 is needed.
Meanwhile, as MOVE retests the lower bound of the range at $0.40, we will be looking for new short-term long setups.
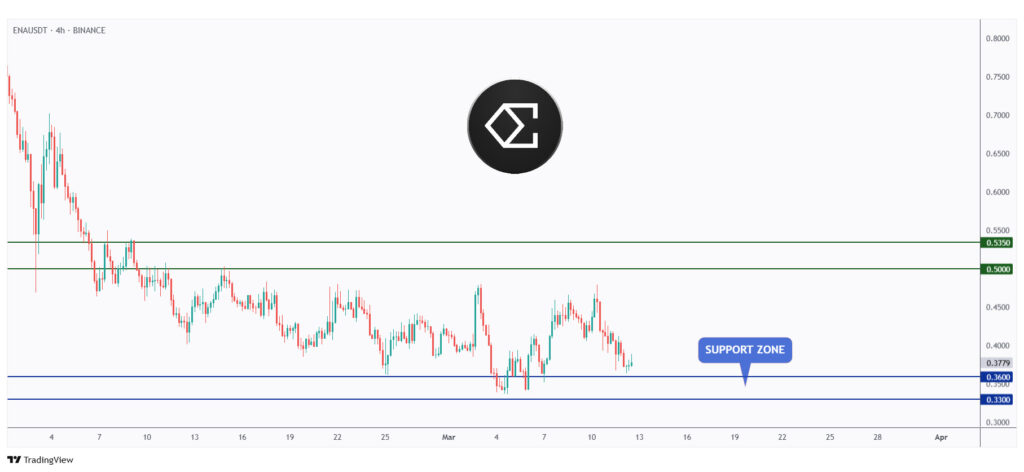
Next up is ENA. Similar to MOVE, it has been trading within a broad range between the $0.33 support and the $0.535 resistance.
As ENA retests the lower bound of the range, we will be looking for bullish reversal setups on lower timeframes as long as this level holds.
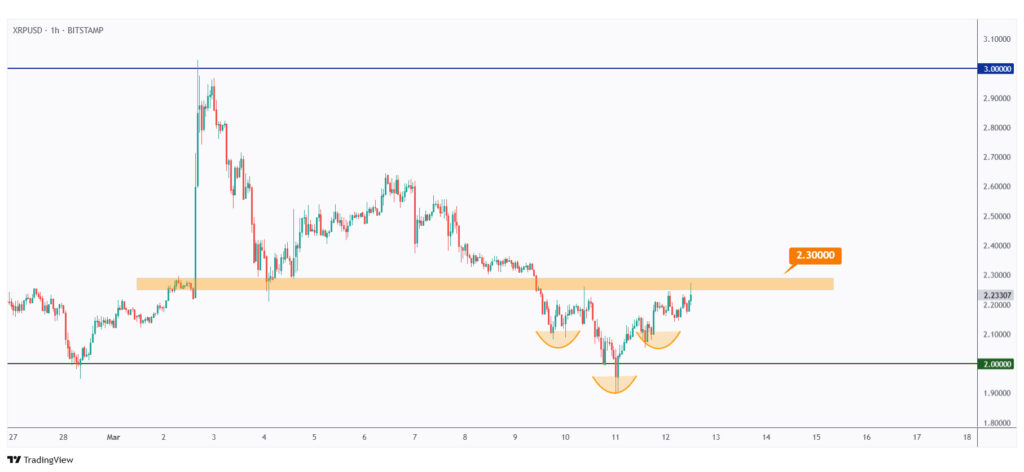
Last but not least, as per our last market outlook, XRP has remained strong above $2, while many altcoins have recorded new lower lows this month.
XRP’s resilience during a bearish phase suggests that it will likely outperform the overall market during bullish phases.
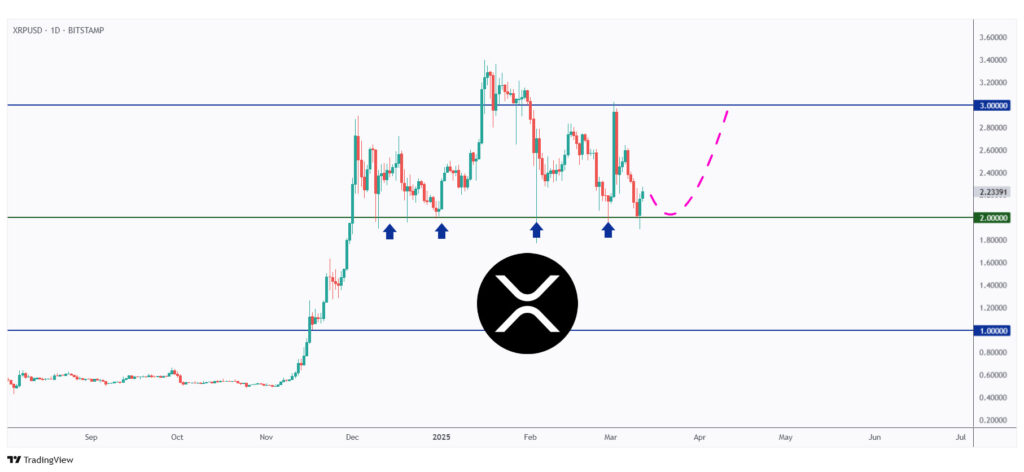
Just like BTC, XRP has been forming an inverse head and shoulders pattern, highlighted in orange.
For the bulls to take control and push toward the $3 target, a break above the neckline at $2.30 is required.
Quotes / Advices
Investing is like poker. You should only play the good hands, and drop out of the poor hands, forfeiting the ante.
~ Gary Biefeldt
Closing Remarks
In summary, BTC is currently retesting a key zone between $68,000 and $72,000, which aligns with multiple rejection points.
PENDLE is trading within a broad range between $2 and $8, with potential buy setups emerging at $2 support. A breakout above $2.20 could trigger short-term bullish momentum, while $2.66 remains a key long-term resistance.
XLM is in a falling wedge pattern, with support at $0.20. A break above $0.27 would signal bullish momentum, potentially leading to a move toward the upper trendline.
MOVE is consolidating between $0.40 and $0.56. A breakout above $0.56 could open the door for a push toward $0.80, while the $0.40 support level remains a key area for potential long setups.
ENA is trading within a range of $0.33 to $0.535. As long as the lower bound holds, bullish reversal setups are anticipated on lower timeframes.
XRP has shown strong resilience above $2, forming an inverse head and shoulders pattern. A break above $2.30 could pave the way for a move toward $3, suggesting potential outperformance in bullish phases.