

Welcome to another crypto market outlook for the 17th of May!
May is usually a bullish month, and this cycle is no different — the crypto market has been pumping like never before. It’s the perfect time to capitalize on the next bullish wave. Let’s explore the potential opportunities together.
Today, we will cover the following topics:
– Market Heatmap and Fear and Greed Index
– US500 and DXY
– USDT.D, Bitcoin and Ethereum Analysis
– Quotes / Advices
– Closing Remarks
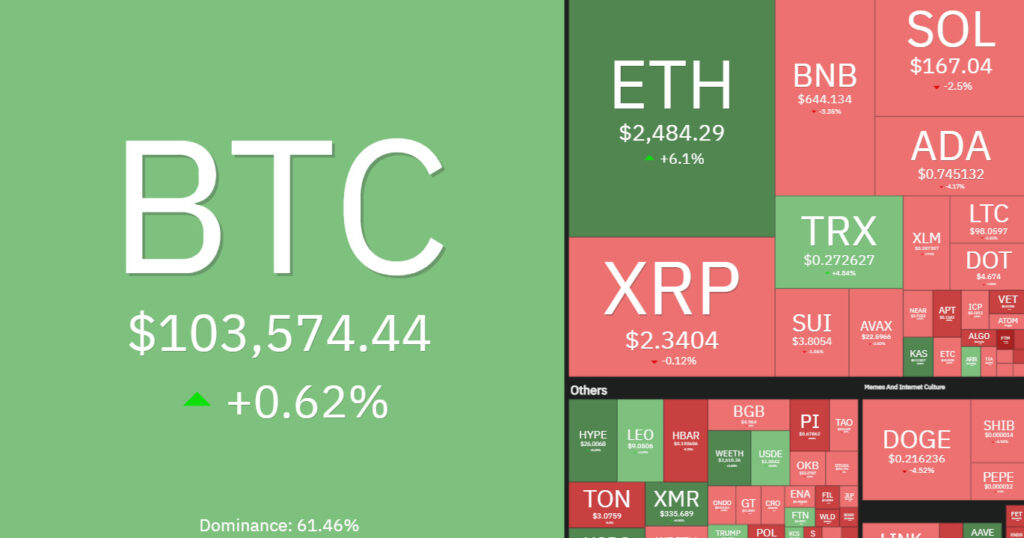
Market Heatmap and Fear and Greed Index
The crypto heatmap has been consistently bullish over the past two weeks, signaling the start of altcoin season, with ETH up over 50% last week and another 6% this week.
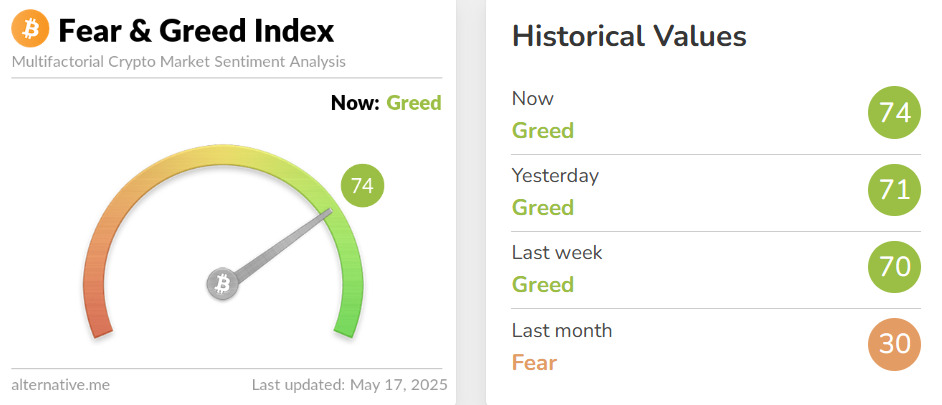
The Fear and Greed Index has been signaling greed for the past 10 days, with the meter rising from 30 to a current high of 74.
US500 and DXY analysis
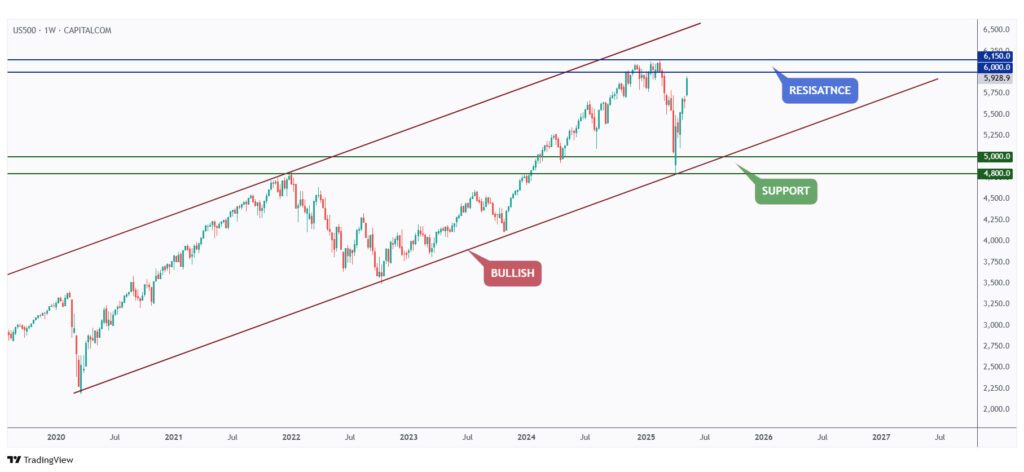
As per our latest US500 analysis, it is currently retesting its all-time high at $6,000.
For the bulls to stay in control from a macro perspective, a break above the $6,150 level is needed.
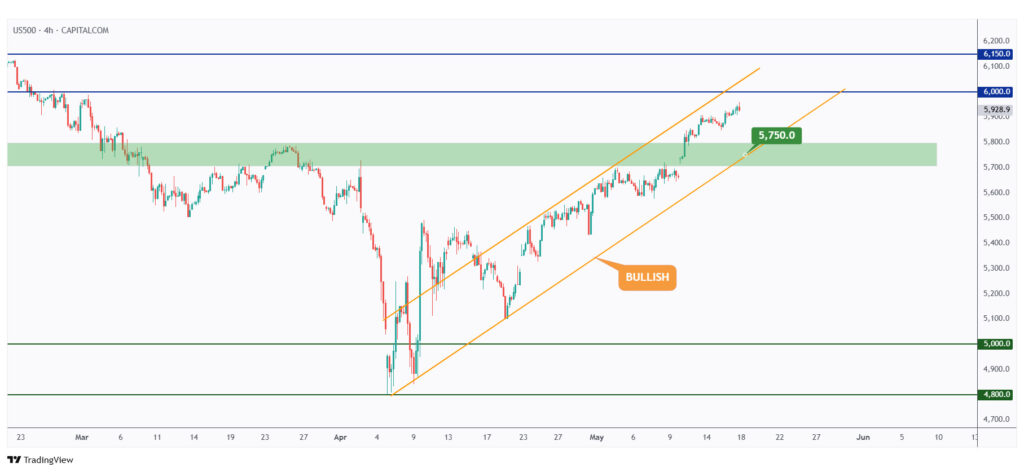
As long as the US500 is trading within the rising orange channel and above the $5,750 structure, we will be looking for short-term longs targeting the $6,150 all-time high.
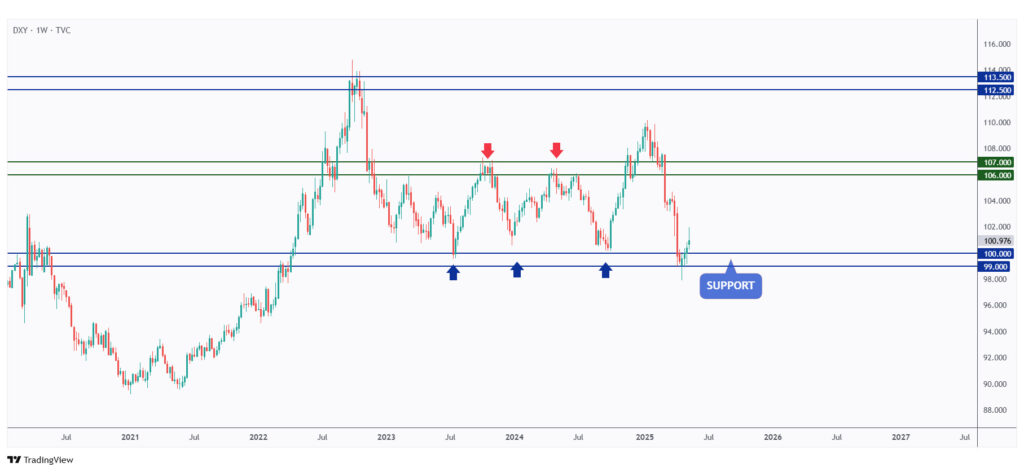
DXY is still holding strong above the $100 mark, and further upside is expected toward the $104 supply zone this week.
Although a strong USD Index typically signals bearish pressure for crypto, that hasn’t been the case over the past two weeks — highlighting just how optimistic the market currently is.
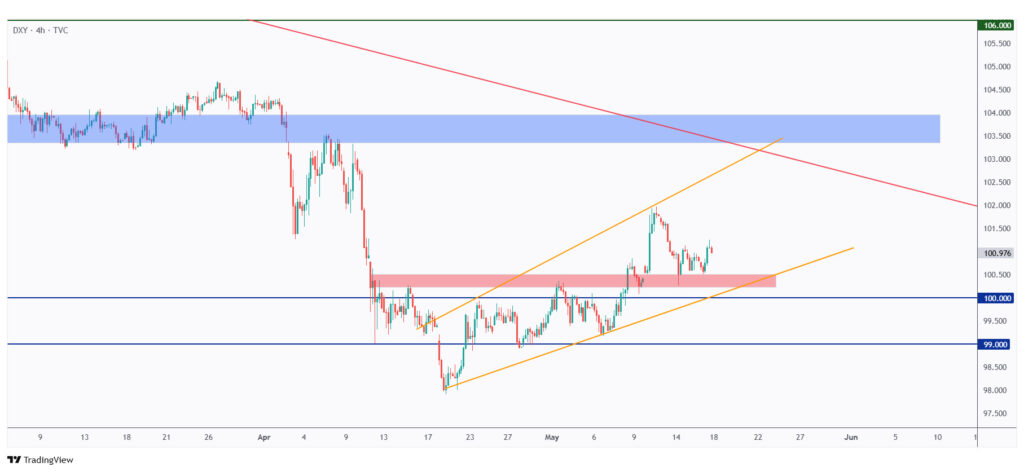
As long as the DXY is trading within the rising orange channel, further upside is expected this week toward the upper orange trendline and the red trendline, which aligns perfectly with the daily supply zone.
USDT.D, Bitcoin, and Ethereum analysis
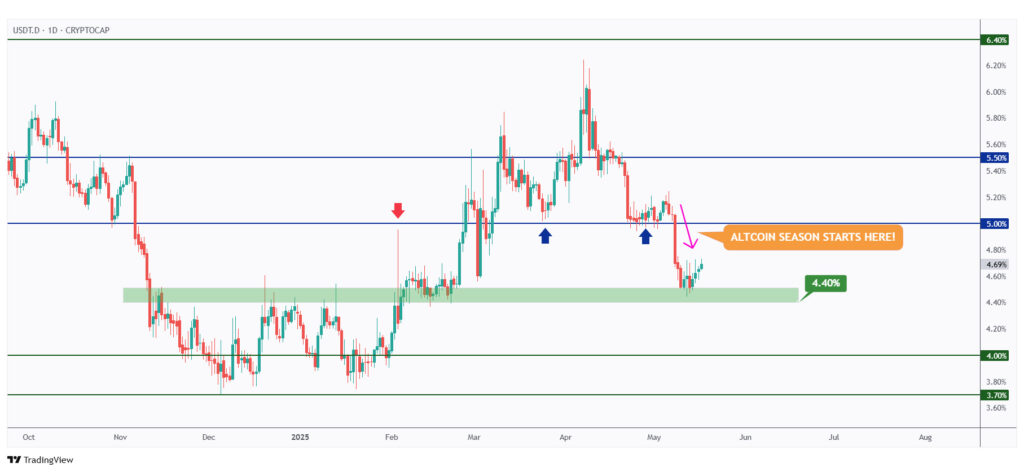
As per our latest USDT.D update, it has rejected the 4.40% level, signaling the start of a bearish correction phase for crypto.
For another major bullish wave to kick off in the crypto market, a break below the 4.40% level on USDT.D is needed.
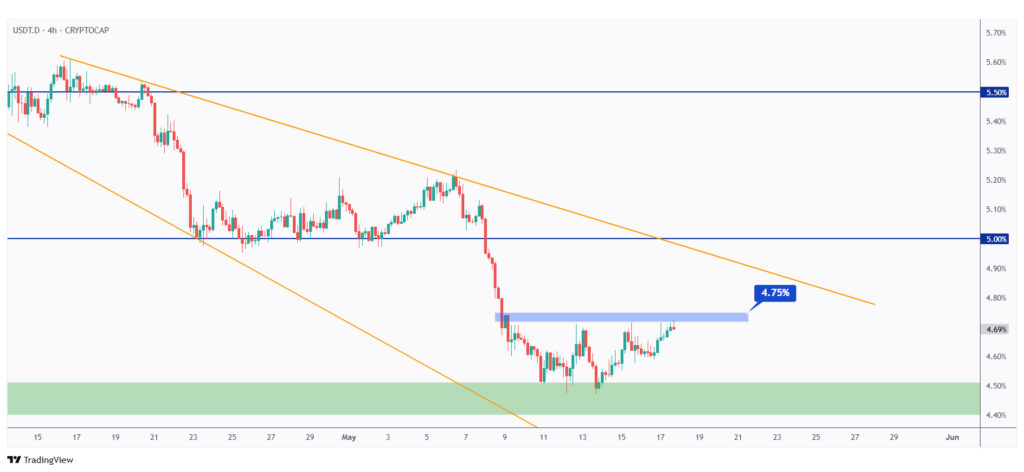
If the last high marked in blue at 4.75% is broken to the upside, a deeper bullish correction for USDT.D would be expected toward the 5% mark — which would be bearish for crypto.
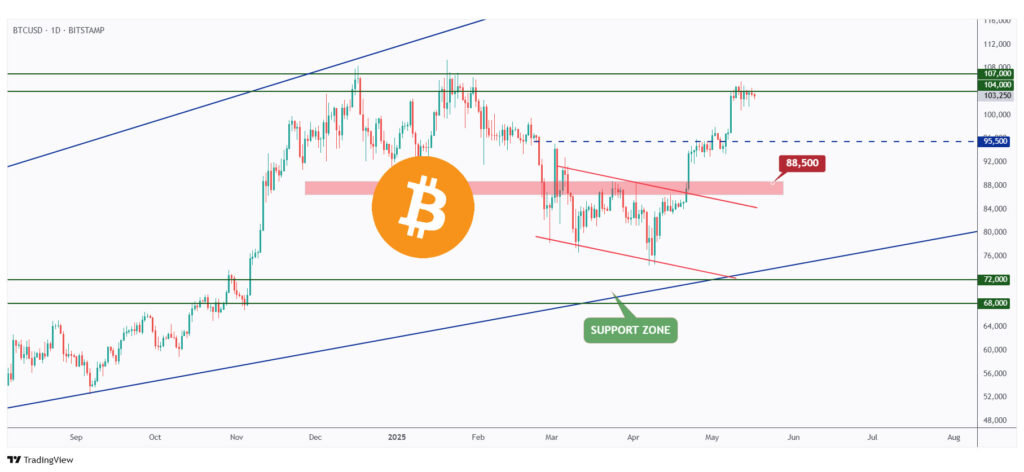
As mentioned in our last market overview, BTC is still hovering around its all-time high zone.
For the next macro bullish impulse to occur in the crypto market, a break above the $109,500 level on BTC is needed.
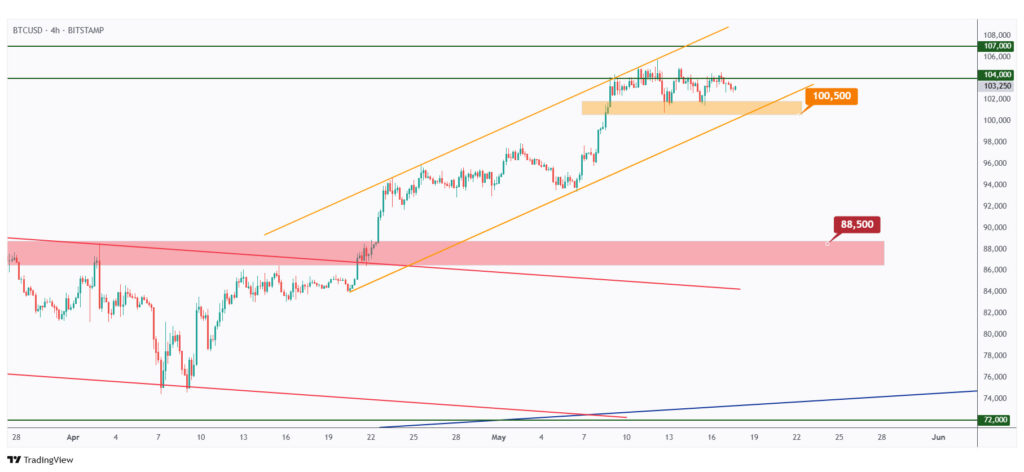
BTC remains bullish in the short term, trading within the rising orange channel.
If the $100,500 level is broken to the downside, a deeper bearish correction toward the $90,000 round number would be expected.
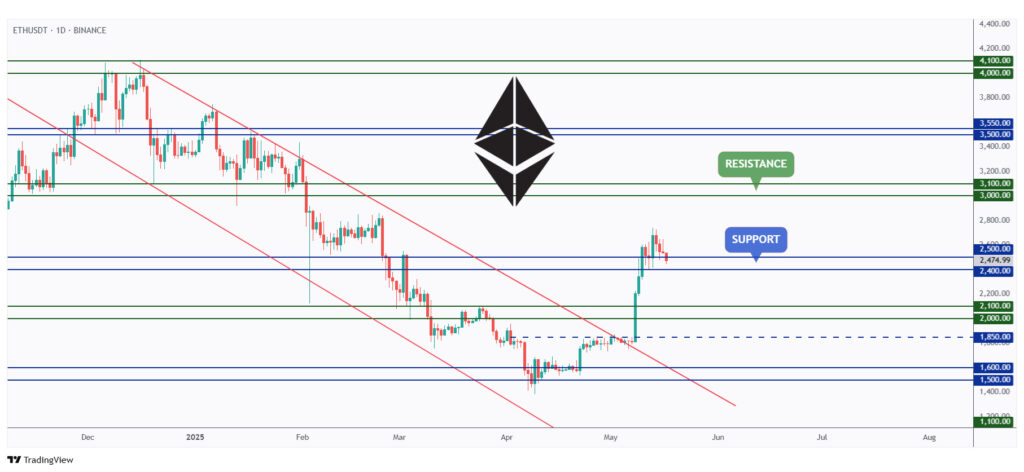
After breaking above the $2,400–$2,500 resistance zone, ETH has been stronger than ever as mentioned in our last roundup article.
The $2,400 level is now acting as support, so as long as ETH holds above it, further upside is expected — which will also push altcoins higher.
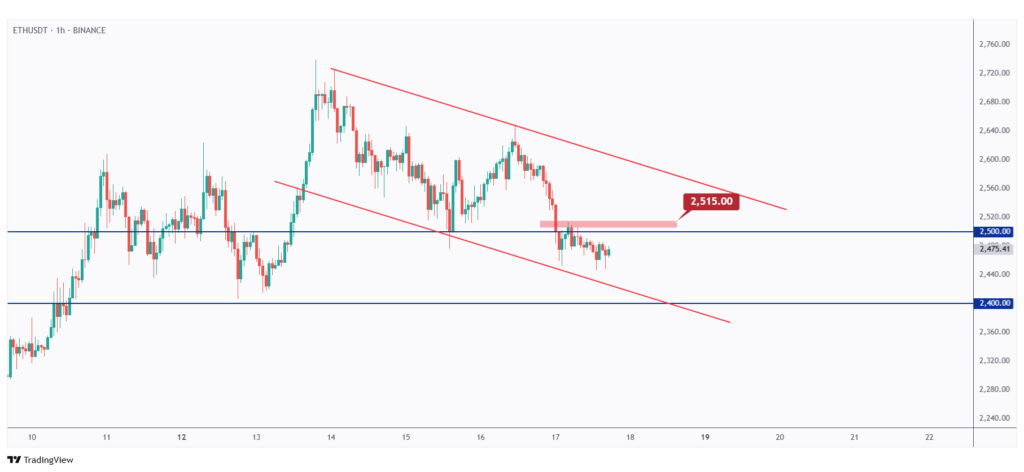
For the next short-term bullish movement to begin, a break above the last minor high at $2,515 is needed.
Then, for the bulls to stay in control in the medium term, a break above the upper red trendline is required.
Quotes / Advices
I believe in analysis and not forecasting.
~ Nicolas Darvas
Closing Remarks
In summary, the crypto market continues to show strong bullish momentum this May, with ETH leading the charge and altcoin season gaining traction.
The Fear and Greed Index has climbed to 74, reflecting growing investor optimism.
The US500 is retesting its all-time high at $6,000, with potential for more upside if it breaks $6,150. Meanwhile, the DXY remains strong above $100, yet crypto has remained resilient despite a rising dollar.
For crypto to maintain its bullish trajectory, USDT.D must stay below 4.40%, while BTC needs to break above $109,500 and ETH above $2,515 to sustain upward momentum.