

Welcome to our latest crypto market outlook for September 30th!
The crypto market has been struggling this month, which isn’t surprising since September is historically a tough period. But guess what? October is just around the corner, and it’s often a positive month, commonly referred to as “Uptober.”
Here are 5 altcoins I’m watching in October: PYTH, SUI, VIRTUAL, XLM, and ZRO.
Today, we will cover the following topics:
– BTC Analysis
– 5 Altcoins Analysis
– Quotes / Advices
– Closing Remarks
BTC analysis
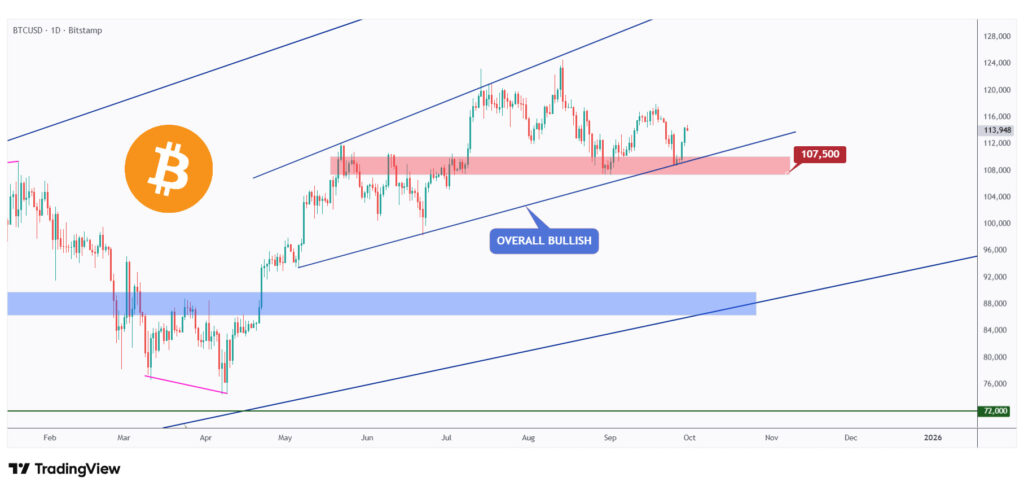
As per our latest BTC analysis, it is still holding strong above the $107,500 structure, while almost all altcoins have recorded new lows this week.
As long as $107,500 holds as support, the bull run remains intact.
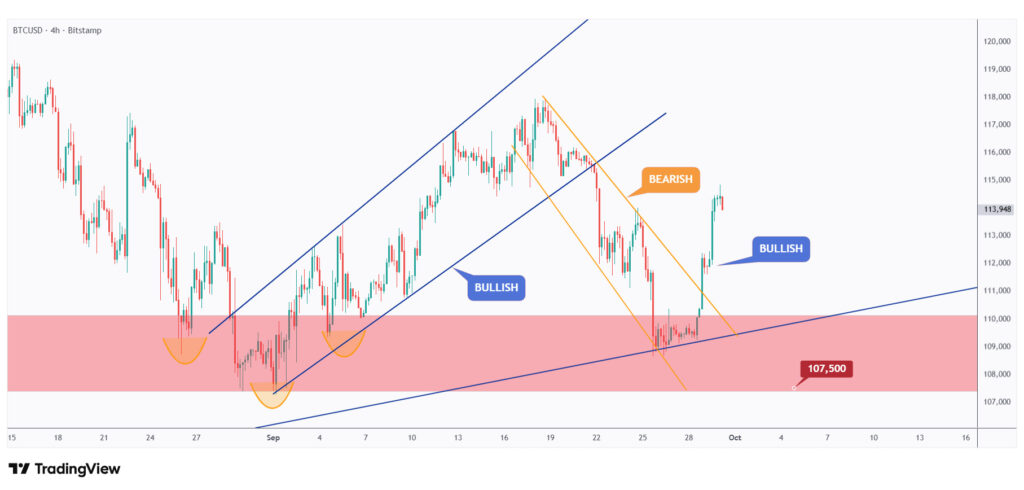
After breaking above the falling orange channel, BTC’s momentum has shifted once again from bearish to bullish.
As BTC retests the red-marked support zone, we’ll be looking for trend-following long setups.
5 Altcoins Analysis
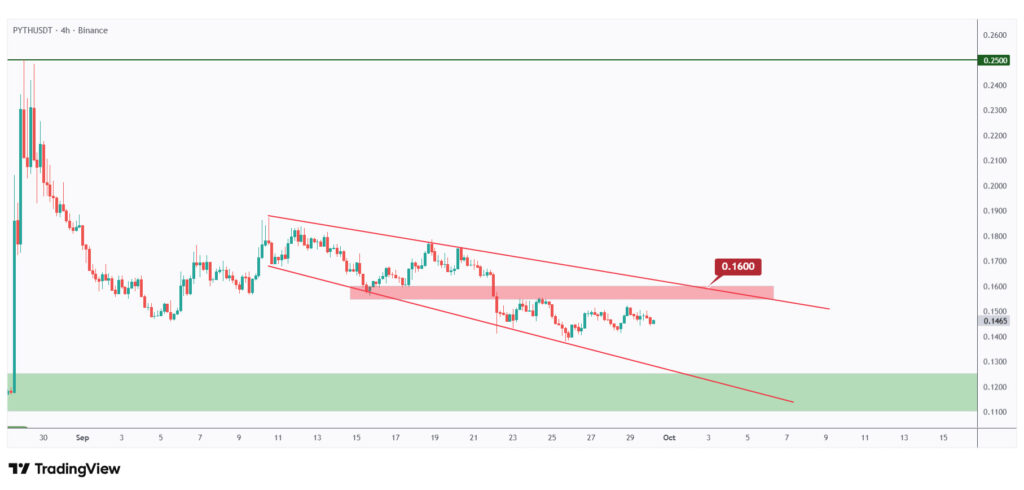
PYTH surprised everyone last week with a sudden 100% pump to the upside, rallying from $0.12 to $0.25.
After rejecting the $0.25 round number, PYTH has entered a correction phase. Since it is now retesting the green demand zone, we’ll be looking for trend-following longs on the lower timeframes.

For the bulls to take control and trigger the next impulse move toward the $0.25 resistance level, PYTH needs to break above both the falling wedge and the last major high at $0.16.
In the meantime, PYTH remains bearish and could still retest the $0.10 round number before moving higher.
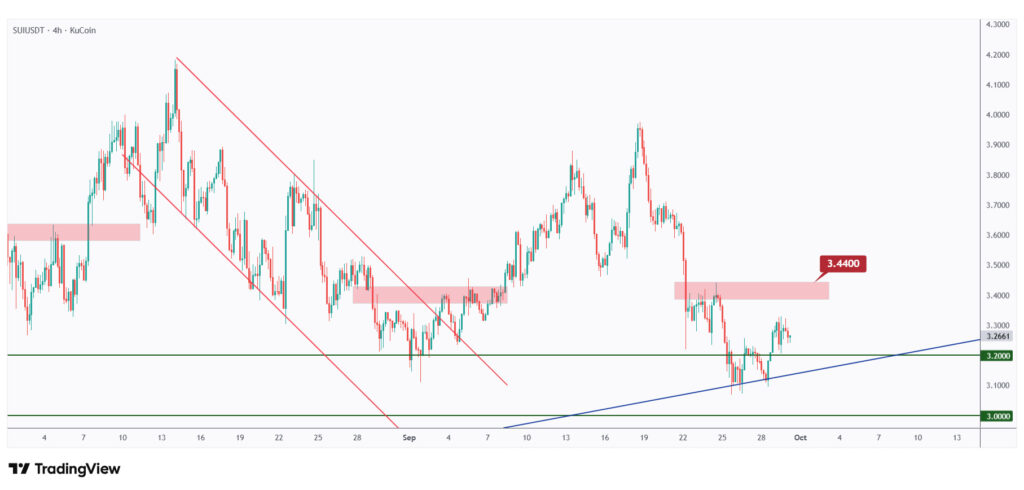
As per our latest SUI analysis, it is still holding strong above the $3 round number.
Therefore, we’ll be looking for long setups targeting the $5 resistance and round number.
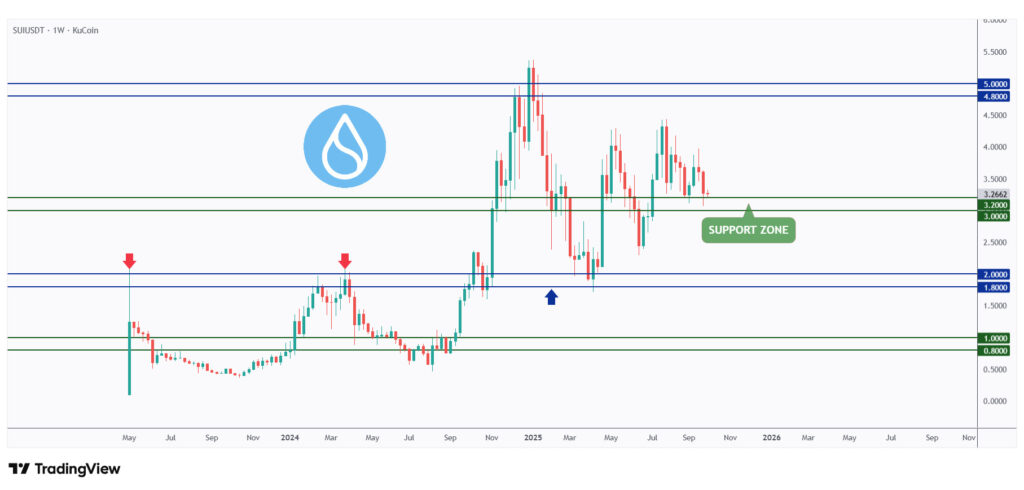
For the bulls to regain control and trigger the next pump, SUI needs to break above the last major high at $3.44.
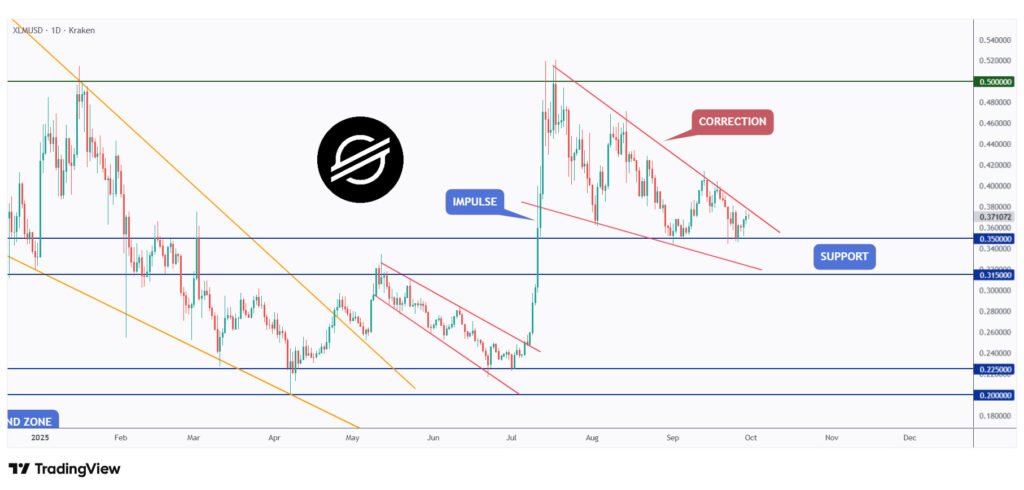
After rejecting the $0.50 round number, XLM has been in a prolonged correction phase, forming a falling wedge pattern marked in red.
As long as the $0.315–$0.35 support zone holds, we can expect the bulls to step in at any time.
For the bulls to confirm the start of the next impulsive phase, a break above the wedge’s upper red trendline is required.
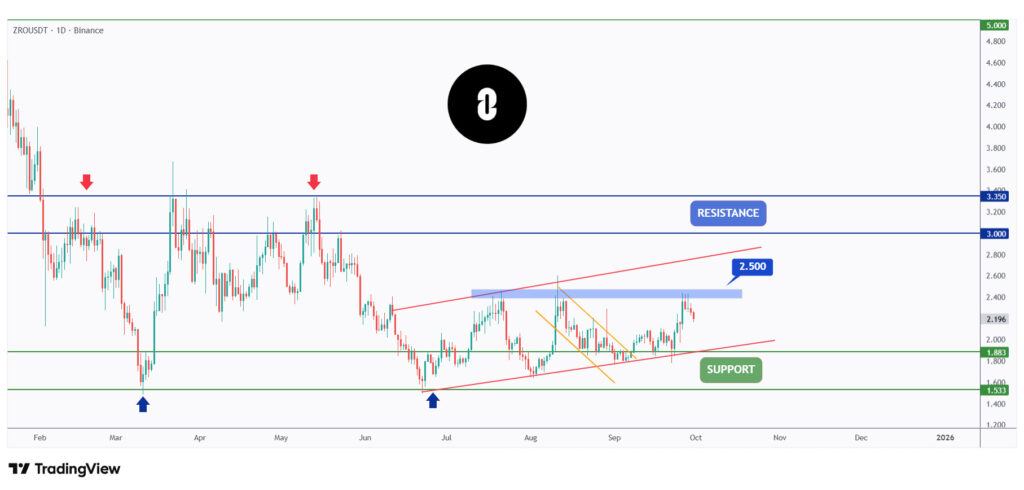
As per our latest ZRO analysis, it perfectly rejected the lower bound of its rising channel marked in red and surged by over 30%.
What’s next, you might ask? For the bulls to stay in control and push toward the $3 resistance level, a break above the $2.50 structure is required.
On the other hand, if ZRO retests the lower bound of the range at $1.80, we’ll be looking for fresh short-term long opportunities.
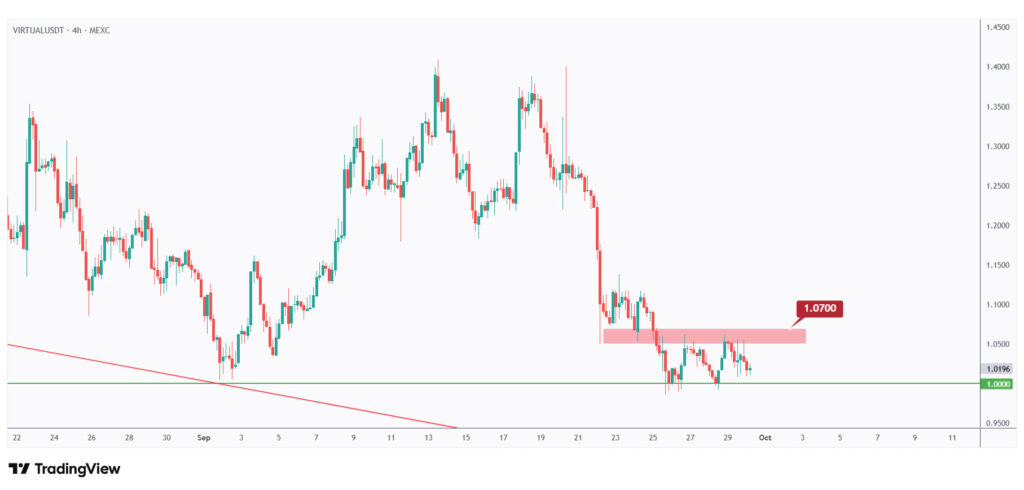
VIRTUAL has been overall bearish in the medium term, trading within the falling channel marked in red.
However, this week it is retesting the lower bound of the channel, which aligns perfectly with the $1 round number.
Thus, as long as the $1 level holds, we’ll be looking for longs targeting the upper bound of the channel.
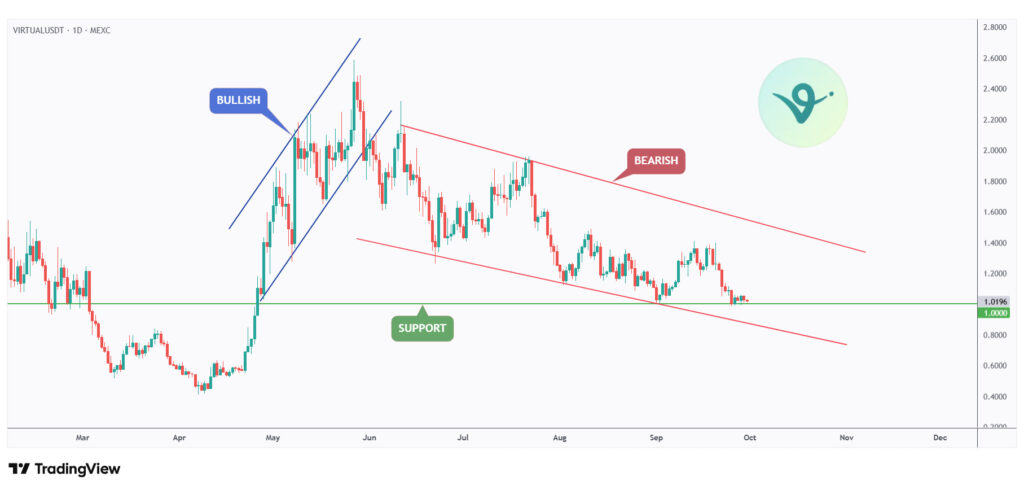
For the bulls to take control and initiate the next major correction phase on the daily timeframe, a break above the last major high at $1.07 is required.
Quotes / Advices
The core problem, however, is the need to fit markets into a style of trading rather than finding ways to trade that fit with market behaviour.
~ Brett Steenbarger
Closing Remarks
In summary, September has been tough, but with “Uptober” around the corner, the outlook is improving. BTC is still holding above $107,500, keeping the broader bull run intact.
PYTH: Needs to break above $0.16 to confirm a move back toward $0.25.
SUI: Holding above $3, with $3.44 as the key breakout level for a push toward $5.
XLM: Still in a falling wedge, but support at $0.315–$0.35 is crucial for a bullish reversal.
ZRO: Surged 30%, now watching $2.50 for continuation toward $3.
VIRTUAL: Retesting the $1 support, with potential upside if it breaks above $1.07.