

Welcome to another crypto market outlook for the 7th of September!
The crypto market has been in a challenging phase for almost a month. The big question is: is this a distribution phase leading to a markdown, or just a correction before a larger bullish impulse? In this article, we’ll explore the possible scenarios together.
Today, we will cover the following topics:
– Market Heatmap and Fear and Greed Index
– US500 and DXY
– USDT.D, Bitcoin and Ethereum Analysis
– Quotes / Advices
– Closing Remarks
Market Heatmap and Fear and Greed Index
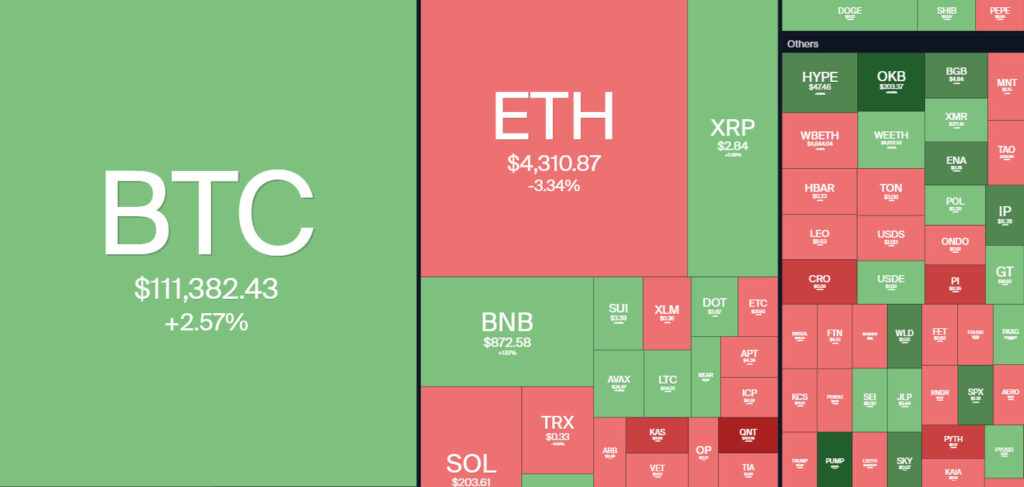
The 7-day crypto heatmap is showing mixed signals between bullish and bearish, which often serves as an early indication of a potential bullish reversal in the market.
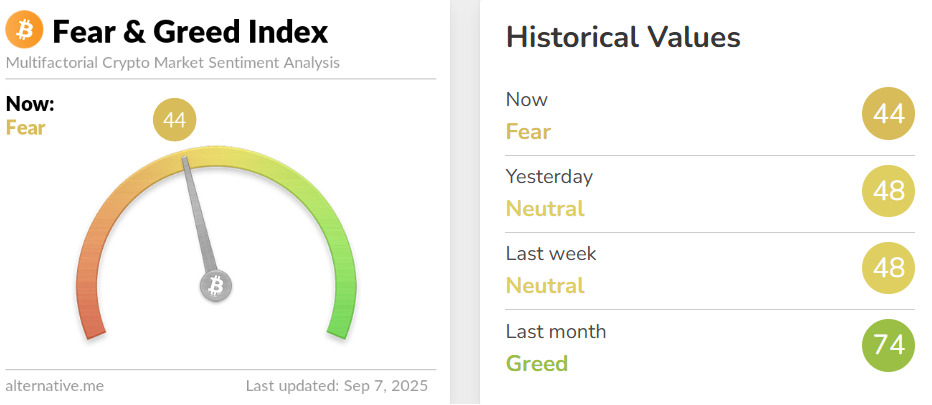
The Fear and Greed Index has flipped from Neutral to Fear this week, which could signal that the bulls may step in soon. It might take a week or two before the whales make their move.
US500 and DXY analysis
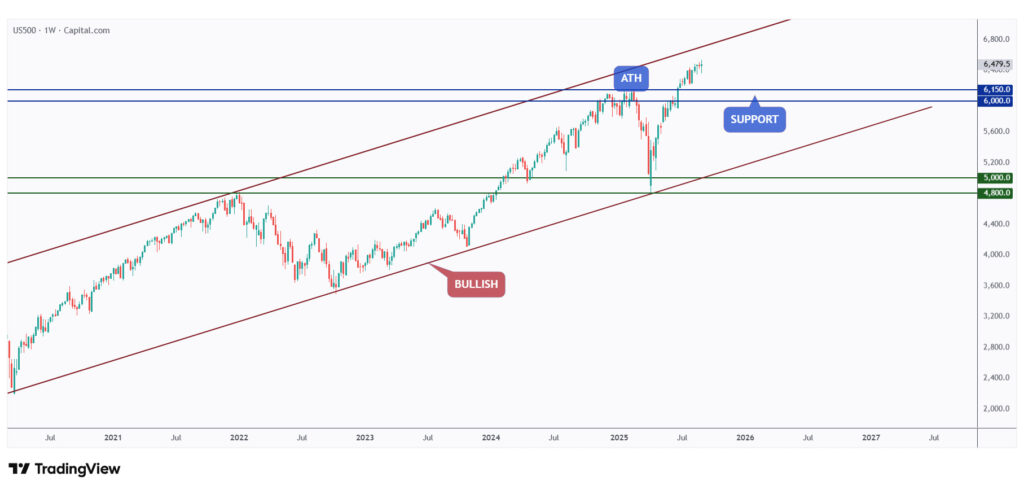
As per our previous US500 update, it is still not showing any signs of weakness. Despite ongoing events in the US, including tariffs, uncertainty around the Fed’s decisions, and Trump’s policies, the stock market remains optimistic.
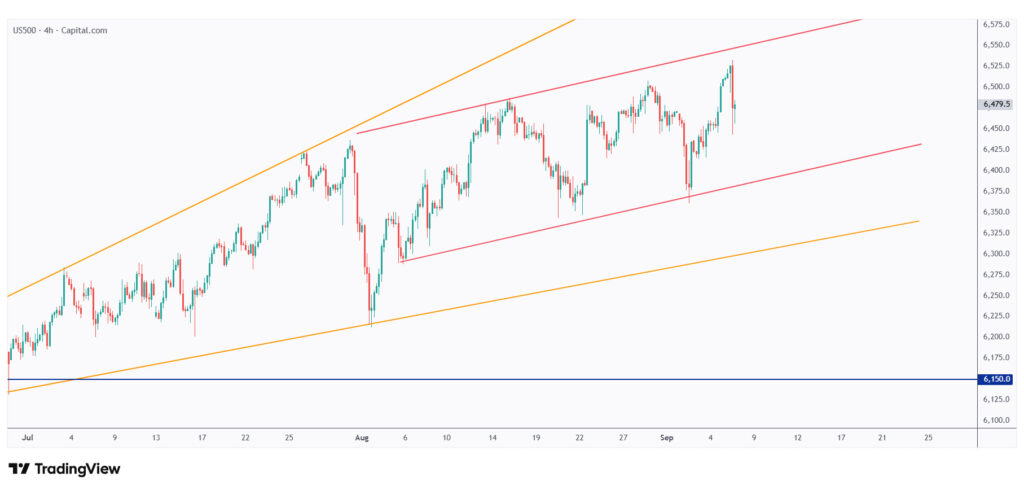
US500 is expected to remain bullish in the short- and medium-term as long as it trades within the rising channels highlighted in red and orange.
The stock market outlook will also stay optimistic while US500 holds within these structures.
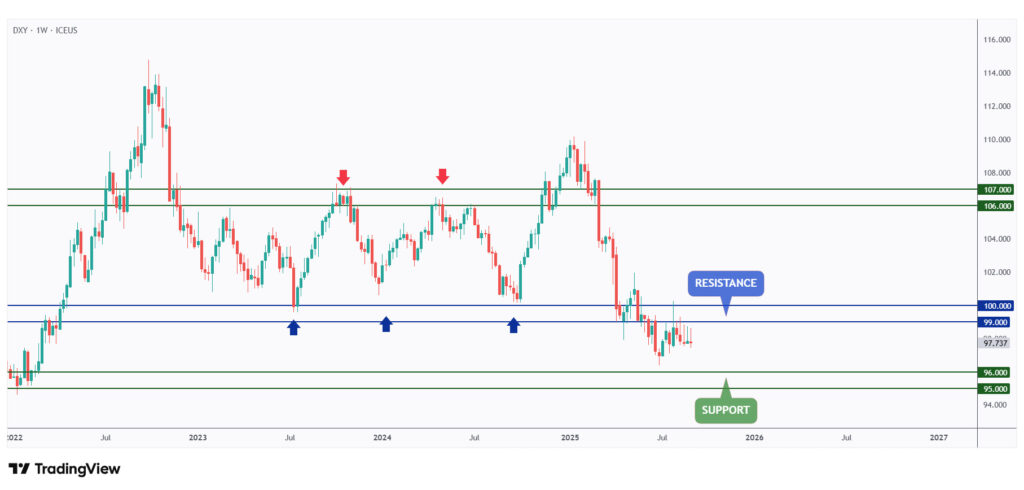
DXY is still hovering within a tight range around the $90–$100 resistance zone. As long as this resistance holds, further downside can be expected.
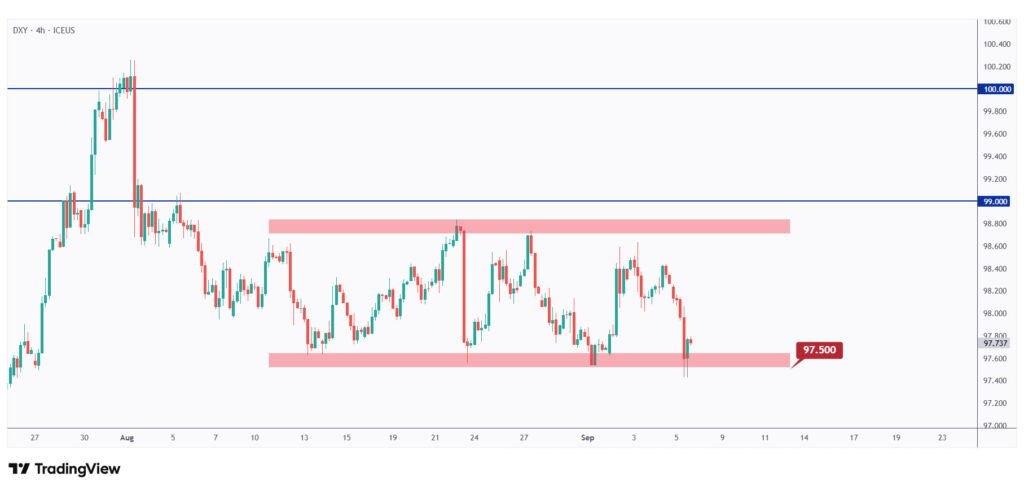
In the medium term, DXY has been hovering within the range marked in red. This week, it is retesting the lower bound of that range.
As long as the $97.5 support level holds, we can expect a stronger USD next week.
USDT.D, Bitcoin, and Ethereum analysis
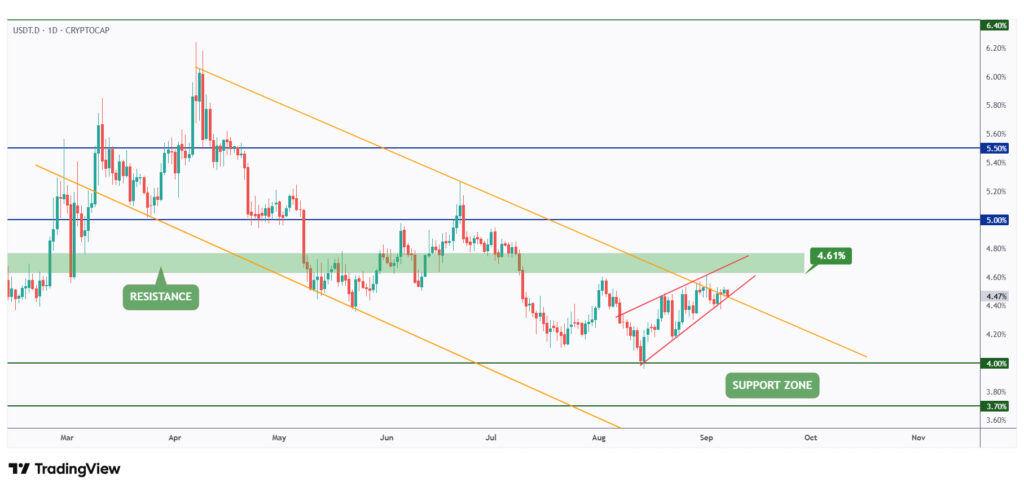
As per our latest USDT.D update, it has been bullish in the short term, trading within the rising wedge pattern marked in red, a sign of a broader correction phase.
However, as USDT.D approaches the 4.6% resistance level, we expect the bears to take over, which would be bullish for crypto.
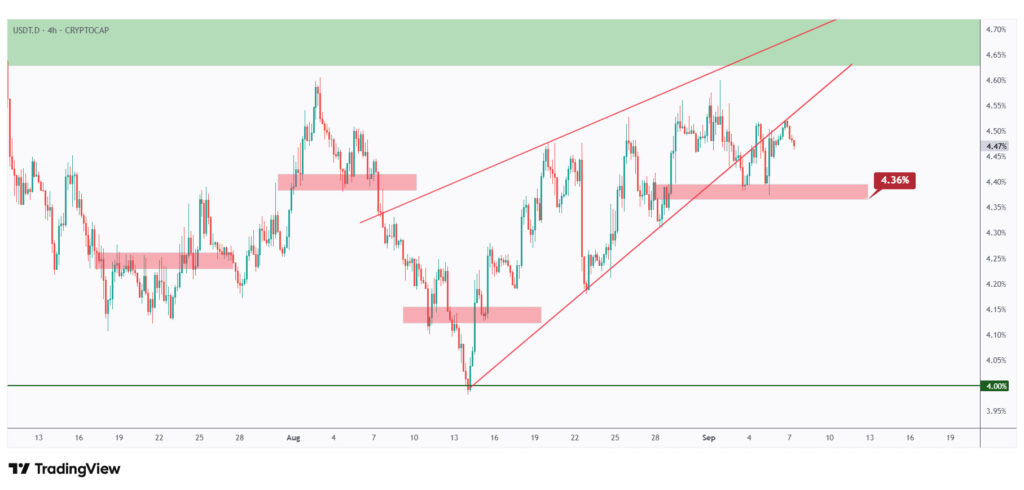
If the last major low at 4.36% breaks to the downside, the bears will take control of USDT.D, a very bullish signal for BTC and altcoins.
On the other hand, as long as the 4.36% level holds, the bulls will maintain the upper hand on USDT.D.
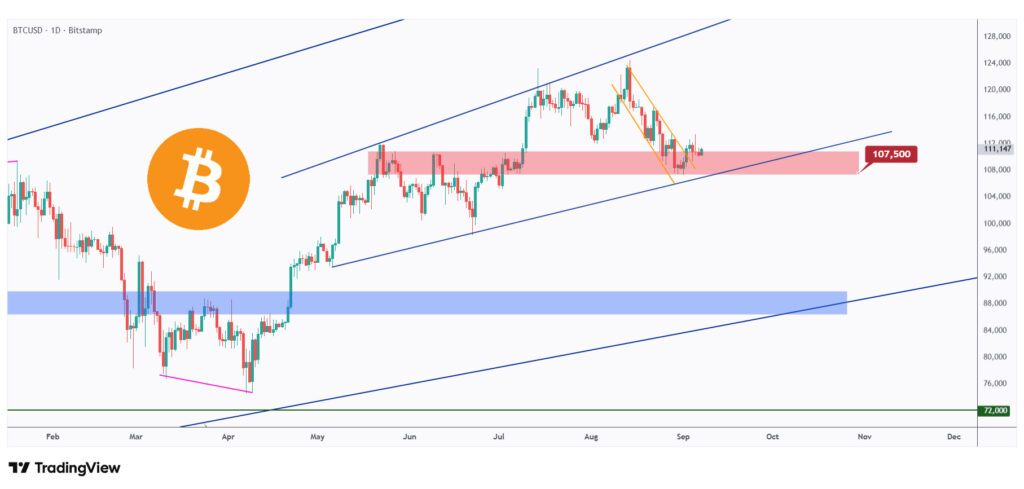
As per our latest BTC update, the overall bias remains bullish as long as the $107,500 structure marked in red holds.
If, and only if, $107,500 breaks to the downside, we can expect further weakness toward the $100,000 round number.
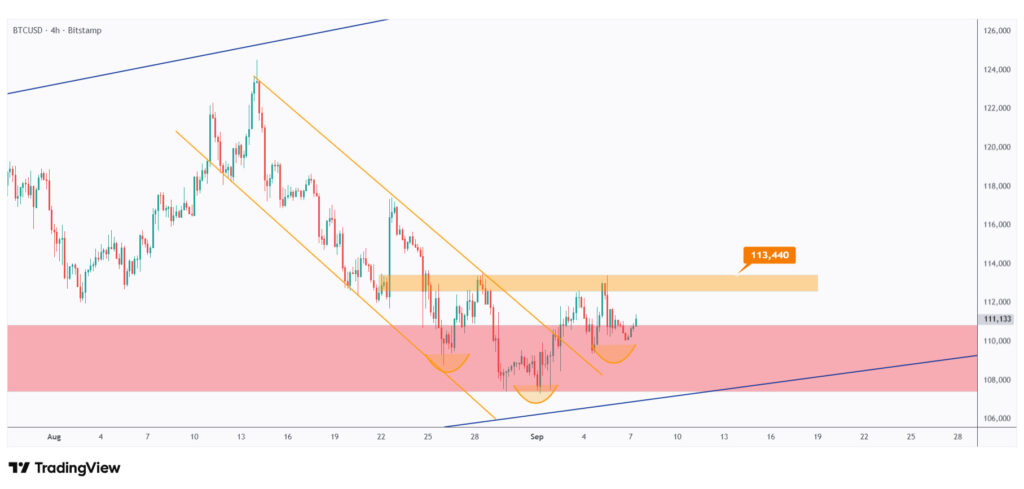
For the bulls to fully take control and trigger the next major bullish leg, a break above the inverse head and shoulders neckline at $113,440 is required.
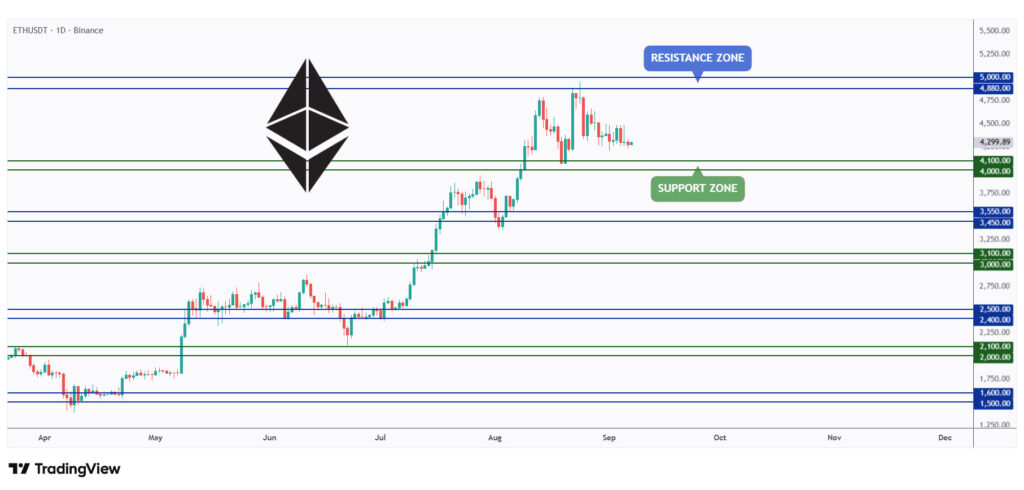
As per our latest ETH analysis, the price is retesting the lower bound of its range at $4,000.
As long as this round number holds, we can expect ETH to show strength heading into next week.
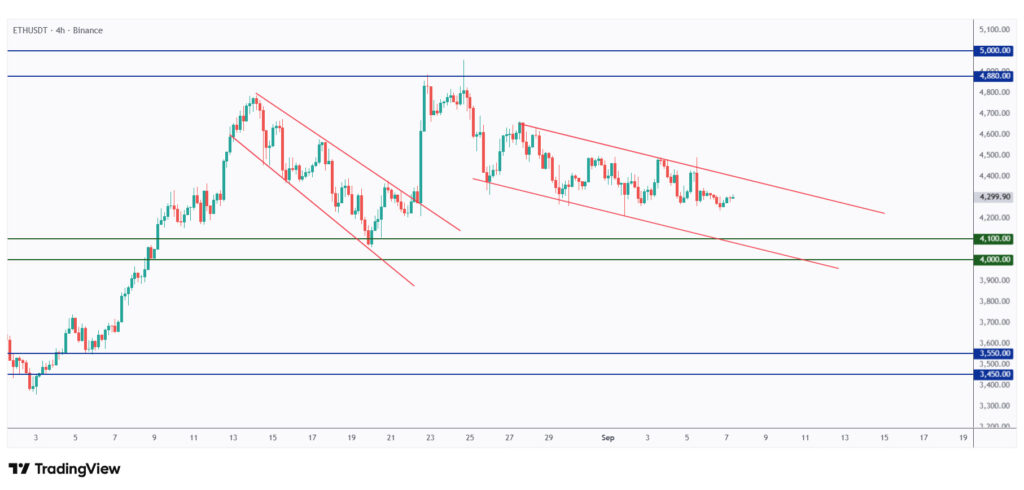
In the medium term, after rejecting the $5,000 round number, ETH has been in a bearish correction, trading within the falling channel marked in red.
For the bulls to regain control and start the next bullish impulse toward the upper bound of the range, a break above the upper red trendline is required.
Quotes / Advices
Routine is necessary for efficiency; breaking routine is necessary for adaptation.
~ Brett Steenbarger
Closing Remarks
In summary, the crypto market remains at a crossroads, with mixed signals across key indicators.
The heatmap and Fear and Greed Index hint at a potential bullish reversal, though whales may take time to step in.
Traditional markets, led by the US500, continue to show resilience, while DXY is consolidating within a critical range.
USDT.D is nearing a resistance level that could flip momentum in favor of BTC and altcoins.
Bitcoin remains bullish above $107,500, with $113,440 as the breakout level to watch, while Ethereum’s outlook depends on holding $4,000 and breaking out of its falling channel.