

Welcome to another crypto market outlook for the 12th of April!
After Trump announced a 90-day pause on tariffs last week, the market suddenly turned bullish. Is this just a correction phase, or the beginning of a new impulse move? Let’s explore the possibilities together.
Today, we will cover the following topics:
– Market Heatmap and Fear and Greed Index
– US500 and DXY
– USDT.D, Bitcoin and Ethereum Analysis
– Quotes / Advices
– Closing Remarks
Market Heatmap and Fear and Greed Index
After a couple of bearish weeks, the market is finally turning bullish, recording its first green week this month — with BTC up by 3.35% and ETH by 1.47%.

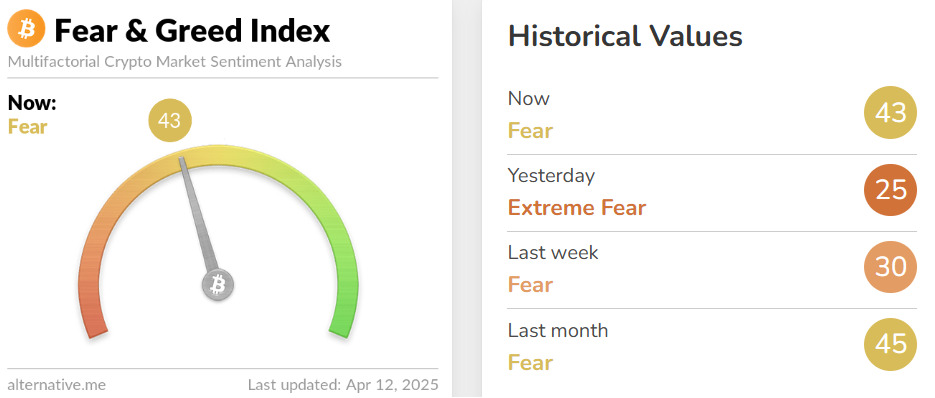
The Fear and Greed Index jumped from 25 to as high as 43, signaling early signs of optimism among traders.
US500 and DXY analysis
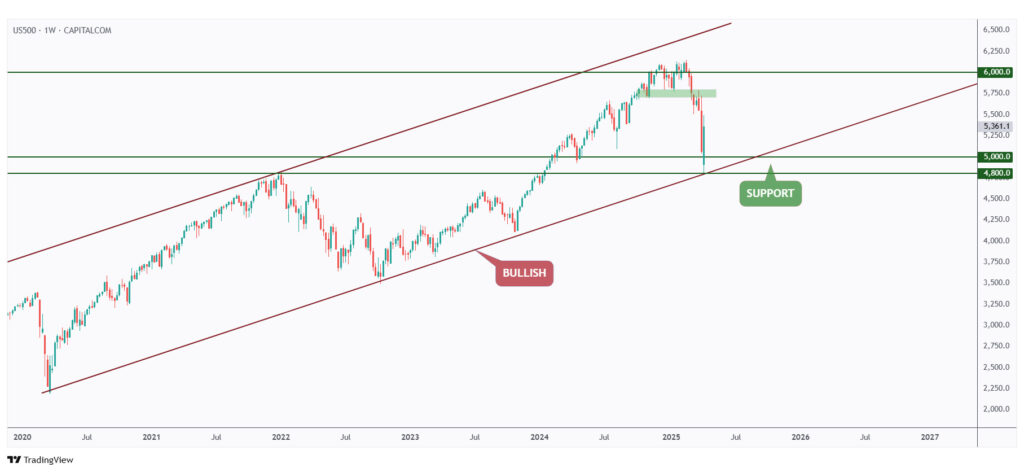
As per our latest market outlook, the US500 rejected the $4,800 previous all-time high and the lower brown trendline.
As long as this support holds, further upside toward the $6,000 round number is expected.
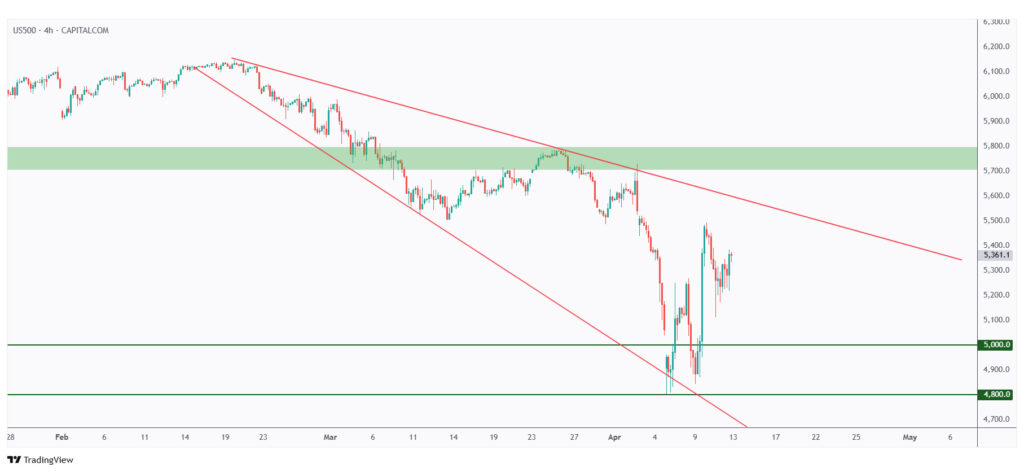
From a medium-term perspective, the US500 remains bearish, trading within the falling wedge pattern marked in red.
As it approaches the upper bound of the wedge, we expect the bears to step in again.
Meanwhile, if it retests the $5,000 support, we’ll be looking for new long opportunities.
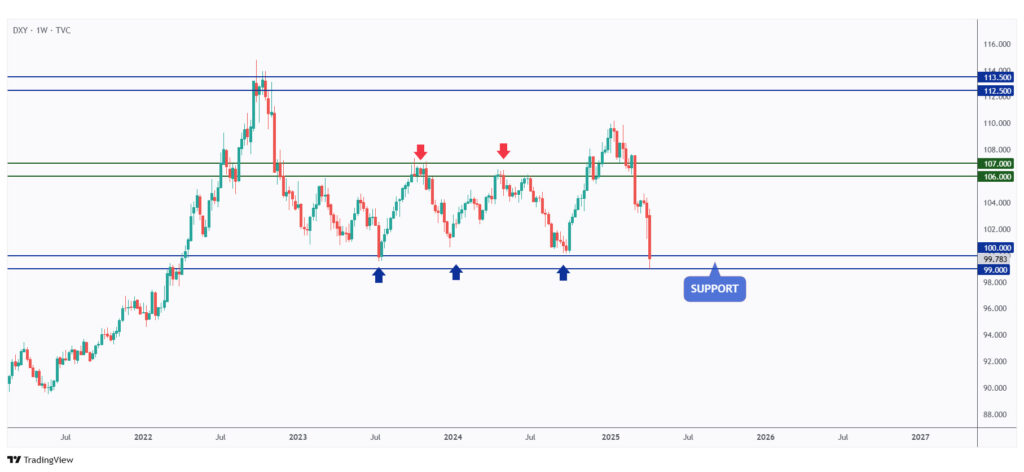
As per our last market outlook, DXY dropped sharply after rejecting the $106 resistance level.
Yesterday, it broke below the $100 round number for the first time in two years.
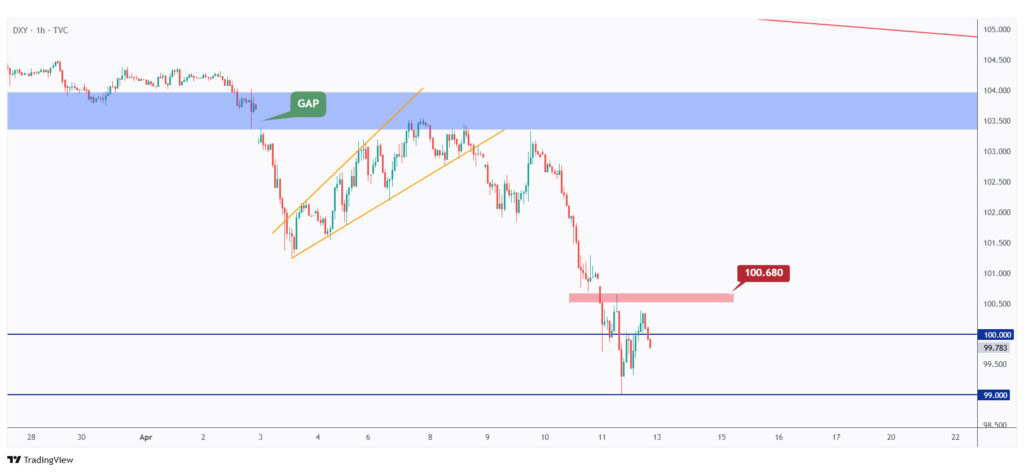
In the short term, for the bulls to reject the $100 support and push higher, a break above the last minor high marked in red at $100.68 is needed.
USDT.D, Bitcoin, and Ethereum analysis
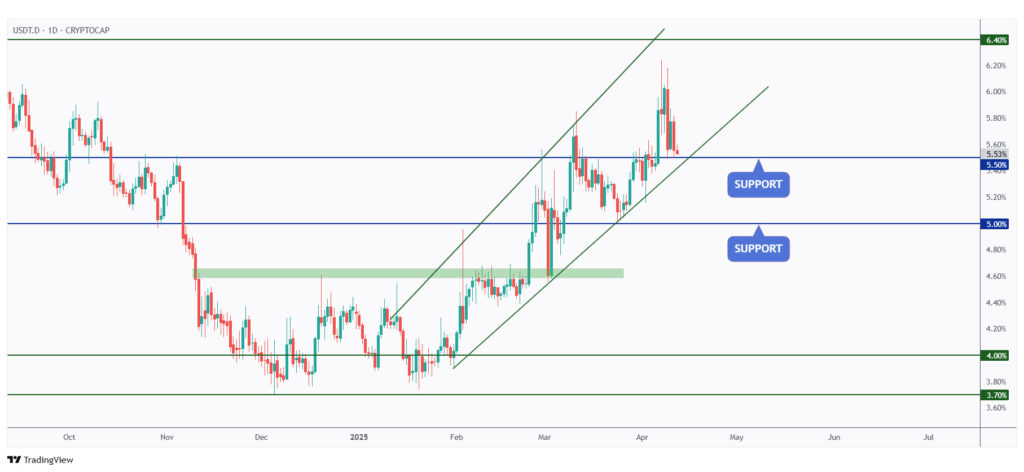
As per our latest USDT.D update, it rejected the upper bound of the rising wedge marked in green and has been in a correction phase over the past week.
Currently, it is retesting strong support at 5.5%, which intersects with the lower bound of the rising wedge.
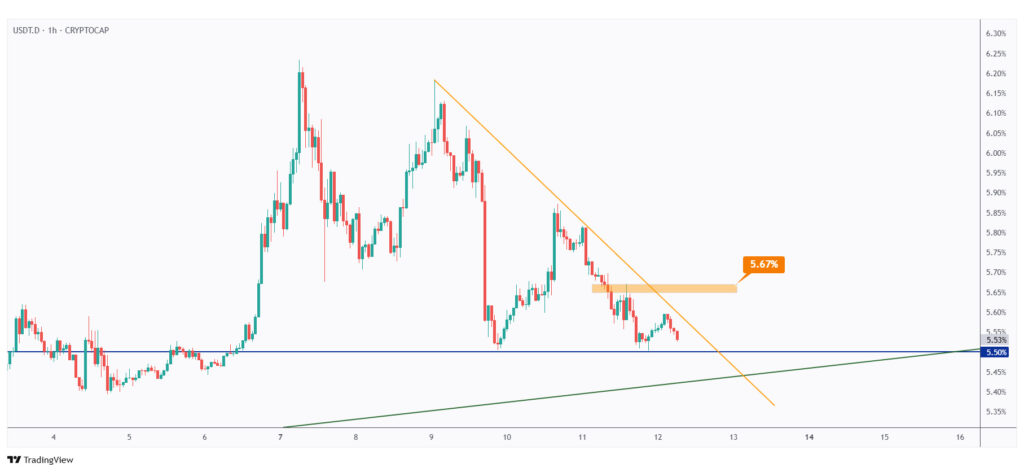
For the bulls to take over again — which would be bearish for crypto — a break above the last major high marked in orange at 5.67% is required.
Meanwhile, as long as USDT.D is trading below the orange trendline, further decline is expected, which would be positive for crypto.
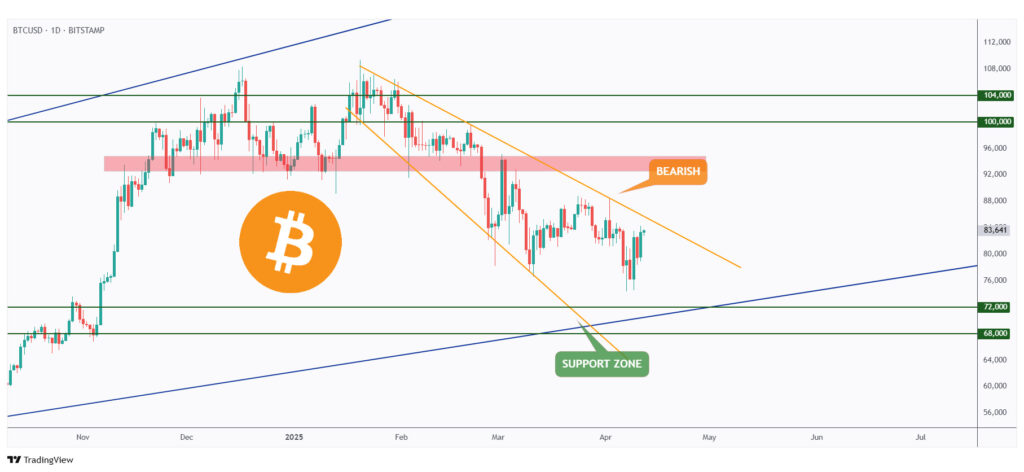
BTC remains bearish in the medium term, undergoing a major correction phase within the falling wedge pattern marked in orange, all while trading inside the larger rising channel marked in blue.
For the bulls to start the next upward impulse movement in line with the rising blue channel, a break above the upper orange trendline is needed.
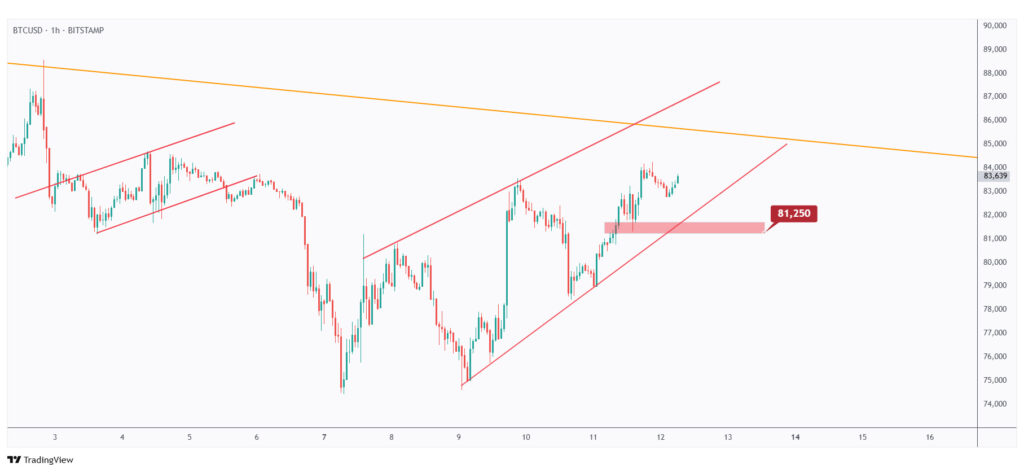
In parallel, if the rising wedge marked in red and the last low at $81,250 are broken to the downside, another major bearish leg within the falling orange wedge toward the $70,000 support would be very likely.
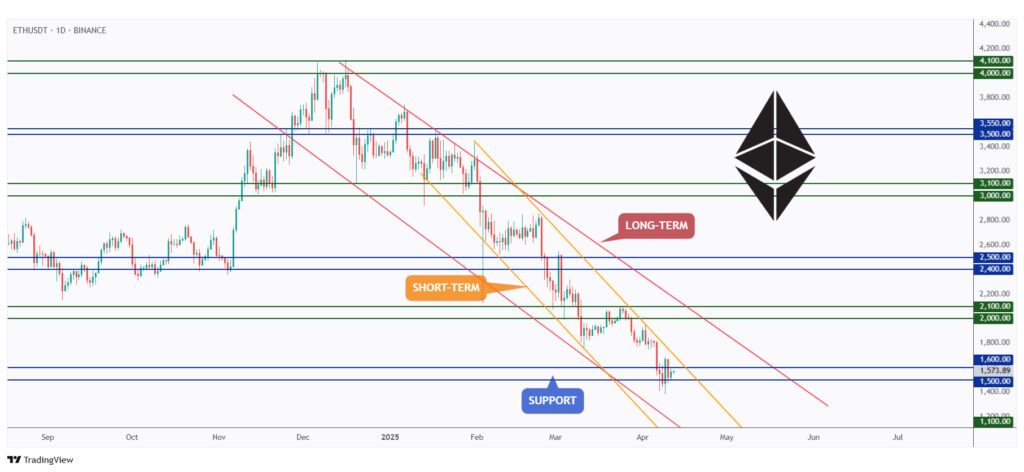
ETH also remains bearish in the medium and long term, trading within the falling channels marked in orange and red.
If the $1,500 support is broken to the downside with a daily candle close, further bearish movement toward the $1,000–$1,100 zone would be on the horizon.
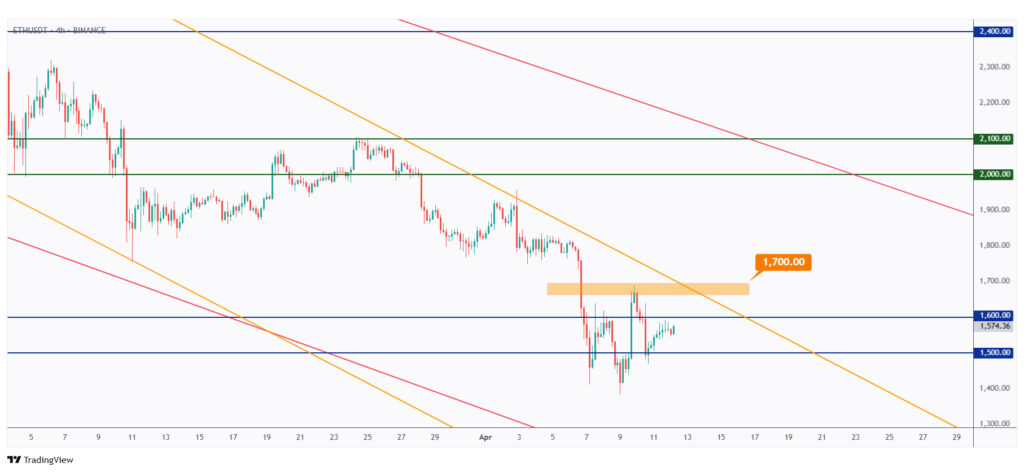
In parallel, for the bulls to take over in the medium term and push toward $2,000, a break above the last major 4H high at $1,700 is needed.
Quotes / Advices
Trading is very competitive and you have to be able to handle getting your butt kicked.
~ Paul Tudor Jones
Closing Remarks
In summary, this week’s market outlook highlights a potential shift in sentiment following Trump’s 90-day tariff pause, with early bullish signs emerging across crypto and traditional markets.
The Fear and Greed Index climbed from 25 to 43, signaling growing optimism. While the US500 shows short-term bullish potential, it remains in a medium-term correction.
DXY broke below the $100 level for the first time in two years, and USDT.D is testing key support.
BTC and ETH are still trading within bearish structures, with critical levels to watch for a potential breakout or continuation of the downtrend.