
Welcome to another crypto market outlook for the 30th of August!
The crypto market has been testing paper hands for nearly three weeks now. Sharp corrections like this are quite normal after a big pump, especially when BTC or ETH tap their all-time highs. The real question is: will the bearish trend persist, or is a reversal getting closer?
Today, we will cover the following topics:
– Market Heatmap and Fear and Greed Index
– US500 and DXY
– USDT.D, Bitcoin and Ethereum Analysis
– Quotes / Advices
– Closing Remarks
Market Heatmap and Fear and Greed Index
The 7-day crypto heatmap is flashing red this week, with the market still in a correction phase and altcoins plunging sharply.

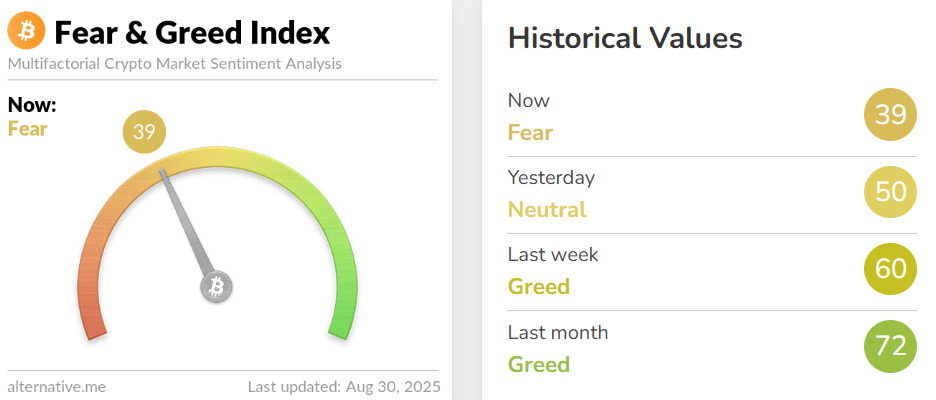
For the first time in weeks, the Fear and Greed Index has flipped from greed to fear.
US500 and DXY analysis
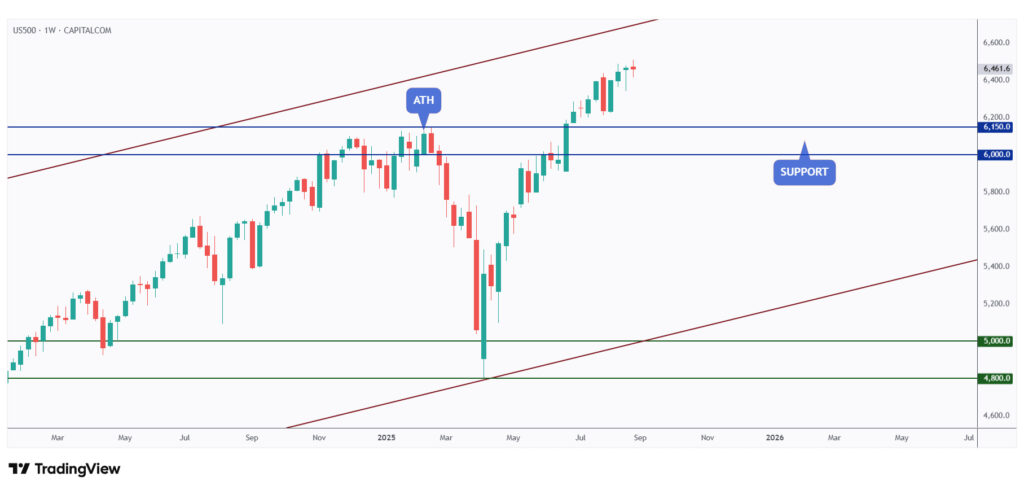
According to our latest market outlook, the US500 is still holding strong above $6,000, indicating that optimism is continuing to spread among both stock and crypto traders.
Even if the US500 retests the $6,000 level, the overall bias will remain bullish as long as this support holds.
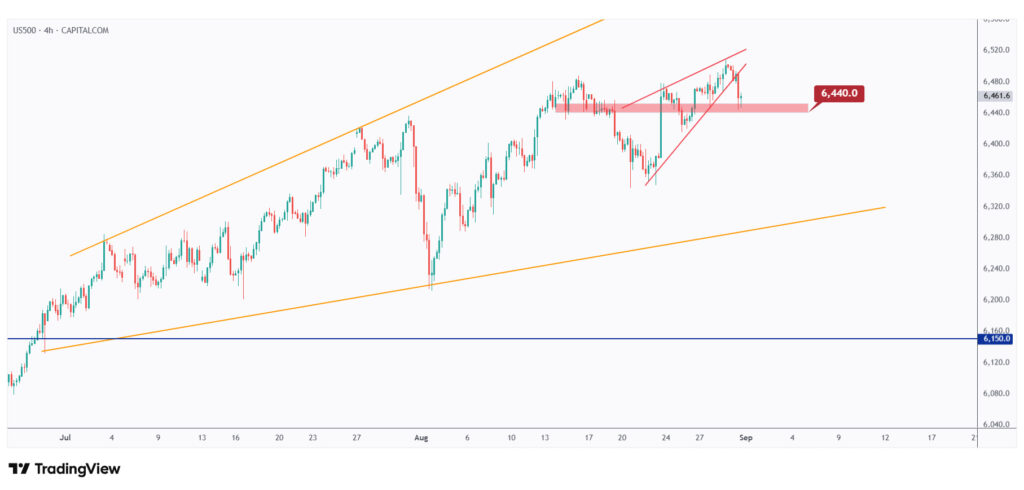
The bulls will remain in control in the short term as long as price holds above the last major low marked in red at $6,440.
If $6,440 breaks to the downside, a bearish correction toward the $6,300 lower bound of the rising orange channel would be expected.
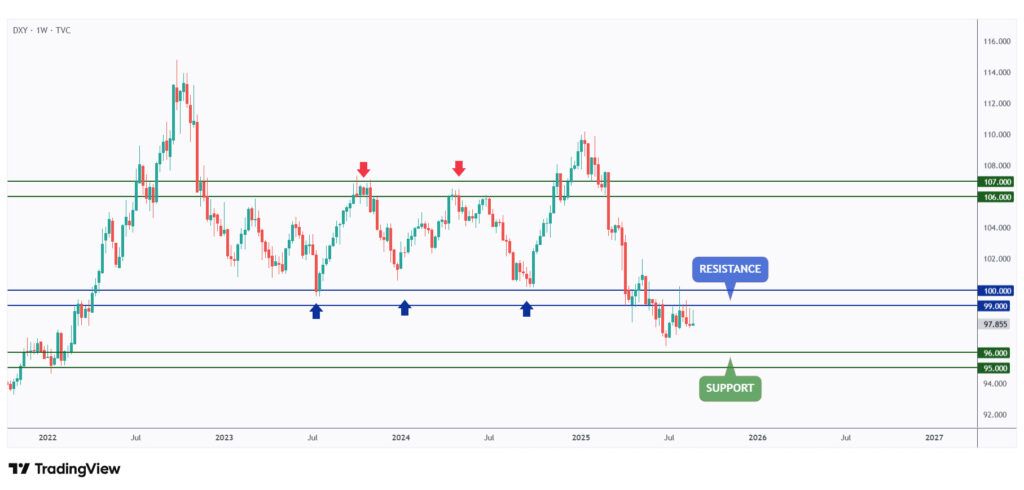
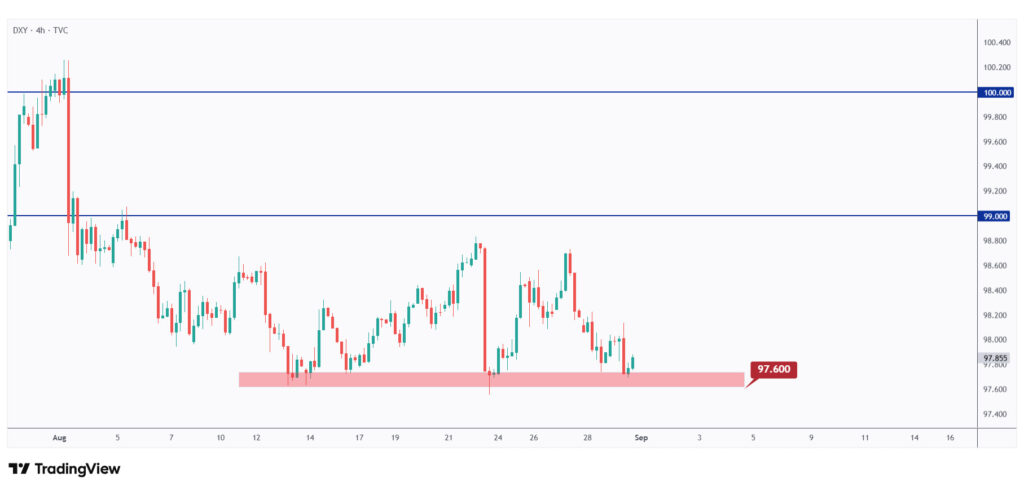
DXY is still holding below the $90–$100 resistance zone, so the overall bias remains bearish.
For the bulls to take the upper hand, a break above the $100 mark is needed.
Medium-term, DXY is retesting the lower bound of its range at $92.6.
As long as the $92.6 support holds, we expect DXY to remain strong in the coming week.
USDT.D, Bitcoin, and Ethereum analysis
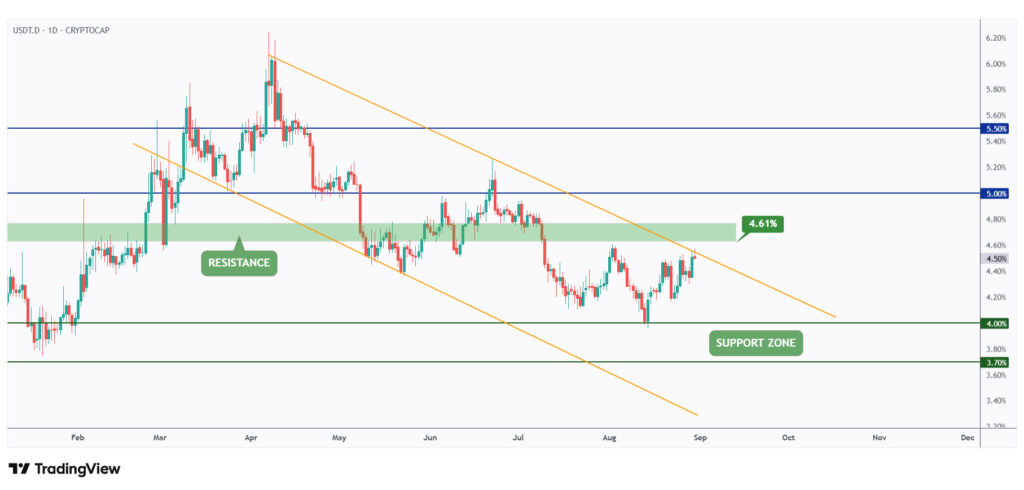
As per our latest USDT.D update, it remains overall bearish in the long term, trading within the falling channel marked in orange.
This week, USDT.D is retesting the upper bound of the channel, which aligns perfectly with the 4.6% resistance zone. As long as this intersection holds, we expect a weaker USDT.D — which signals a bullish crypto market.
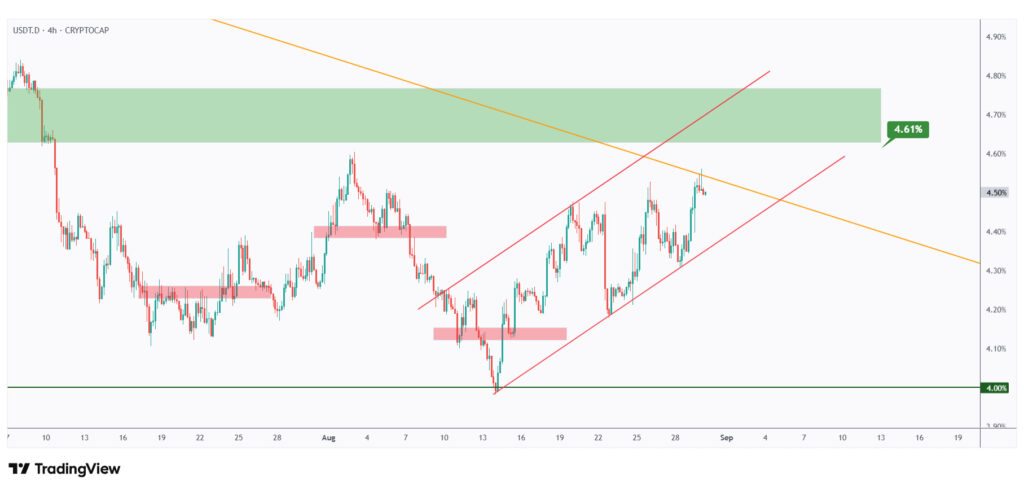
For the bears to take full control of USDT.D, which would mean a major bullish leg for crypto, a break below the rising red channel is needed.
In the meantime, USDT.D will remain bullish as long as it continues to trade within the rising channel.

As per our latest BTC update, it will remain overall bullish as long as it holds above the $107,500 structure marked in red.
If this structure breaks to the downside, we expect a further move lower toward the $100,000 round number.

For the bulls to finally take over and restore optimism in the crypto market, a break above the last major high marked in orange at $113,500 is needed.
Until then, the bears will remain in control.
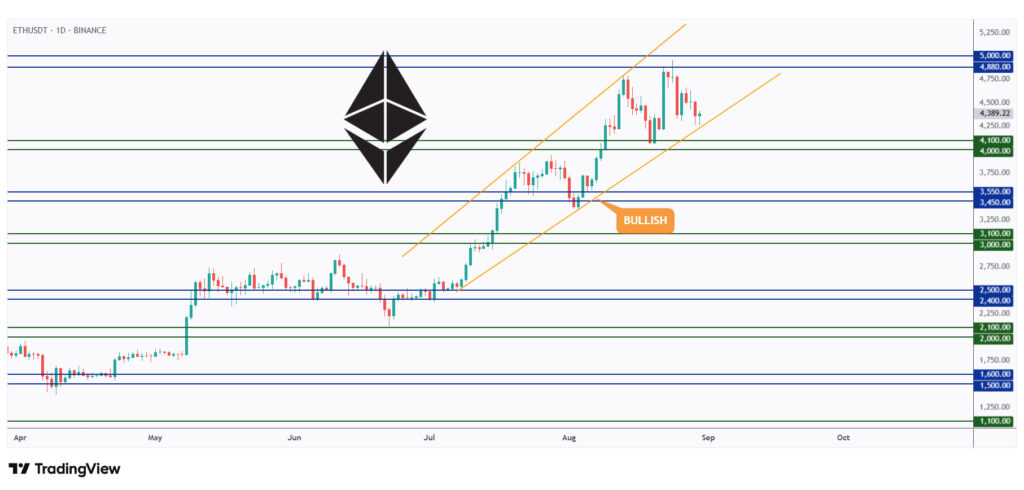
As per our latest ETH analysis, the overall bias will remain bullish as long as it trades within the rising orange channel and above the $4,000 mark.
The bears will only take control if the $4,000 level breaks to the downside.
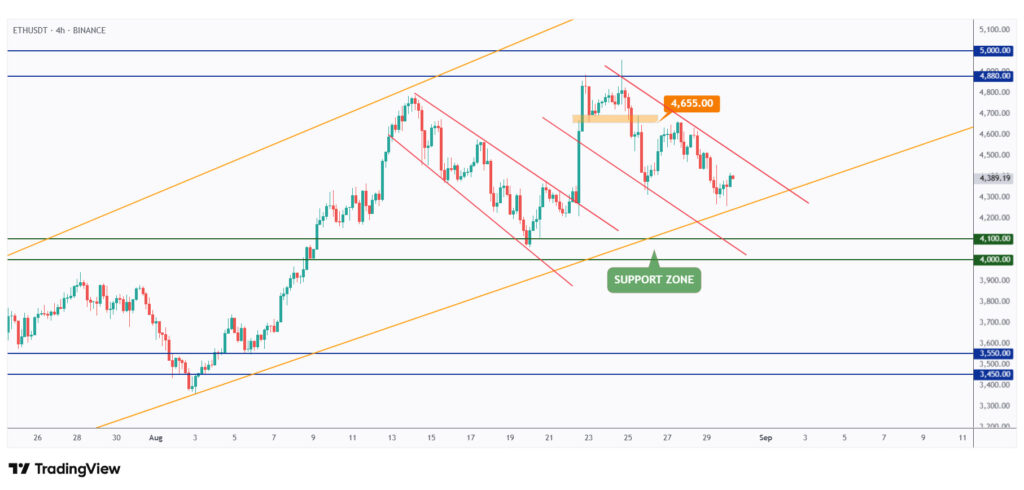
As expected, after breaking below the orange structure at $4,655, ETH entered a correction phase and is currently trading within the falling channel marked in red.
For the bulls to regain control and shift the momentum in their favor, a break above the upper red trendline is needed.
In the meantime, ETH will remain bearish, with further downside toward the $4,000–$4,100 support zone on the horizon.
Quotes / Advices
Advises focusing on appropriate reactions to available information rather than attempting to predict the future.
~ Ray Dalio
Closing Remarks
In summary, the market remains in a corrective phase with altcoins under heavy pressure and sentiment shifting from greed to fear.
US500 continues to show strength above $6,000, while DXY holds a bearish bias below the $100 mark.
USDT.D is testing key resistance, suggesting potential relief for crypto if it weakens further.
BTC stays bullish above $107,500 but needs a breakout over $113,500 to regain momentum, while ETH remains under correction with critical support at $4,000. Overall, the next moves will depend on whether key support and resistance levels hold or break in the coming days.