
Welcome to our latest crypto market outlook for July 29th!
A new month is about to begin, bringing fresh opportunities with it. August is typically a bullish month, so make sure you’re holding your favorite bags. Here are my top picks for the week: GRT, OP, LDO, KMNO, and W.
Today, we will cover the following topics:
– BTC Analysis
– 5 Altcoins Analysis
– Quotes / Advices
– Closing Remarks
BTC analysis
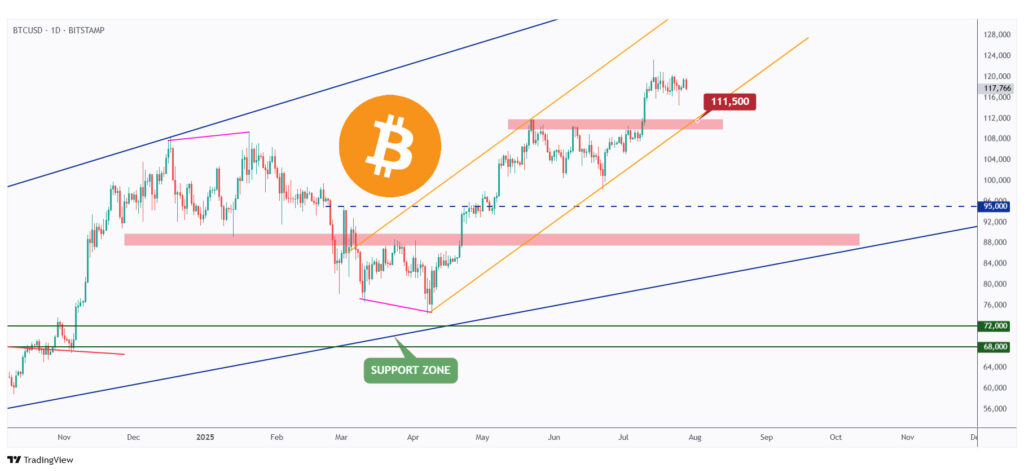
As per our latest BTC analysis, it has been hovering within a narrow range between $115,000 and $120,000.
In the long term, BTC remains overall bullish as long as it continues to trade within the rising orange channel.
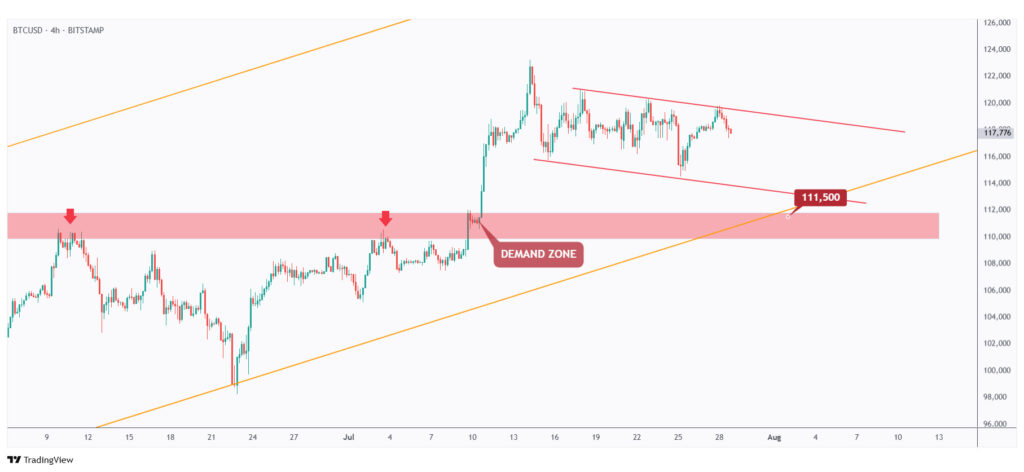
For the bulls to start the next big impulse phase pushing toward the $135,000 mark, a break above the falling red channel is needed.
Meanwhile, the bears will remain in control in the short term, and BTC could still move lower toward the $111,500 support level.
5 Altcoins Analysis
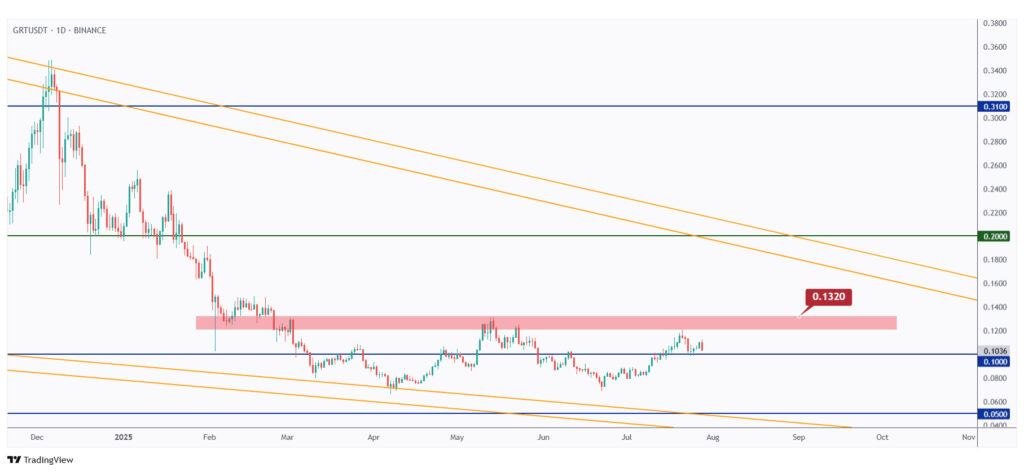
GRT is one of the best-looking charts this week, as it has been trading within a clean wedge pattern marked in orange.
Since it is rejecting the lower bound of the wedge and the $0.10 round number, we will be looking for long setups to catch the bullish correction toward the upper bound of the wedge.
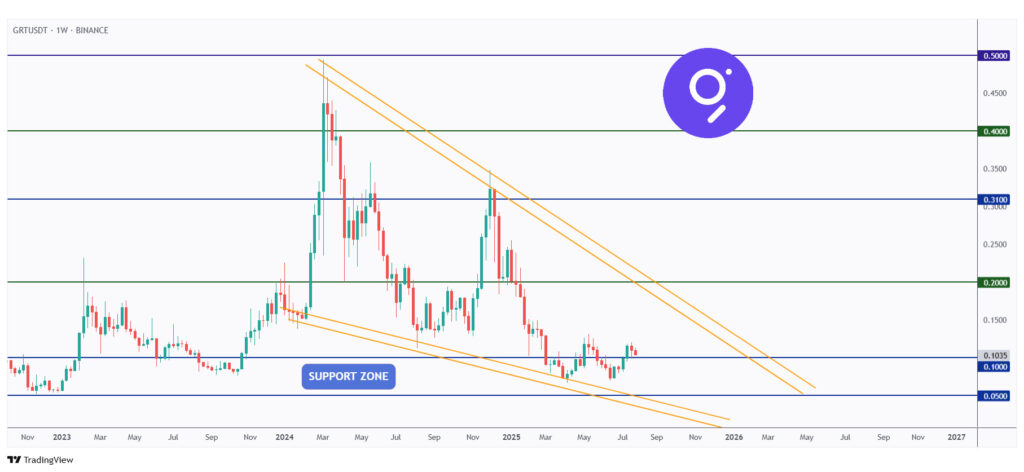
For the bullish correction phase to be activated, a break above the $0.132 structure marked in red is needed.
As per our latest OP analysis, it has been overall bullish, trading within the rising broadening wedge pattern marked in orange.
As OP retests the lower bound of the wedge, we will be looking for trend-following long setups, targeting the $1 resistance level.

As OP approaches the $0.67 structure, which intersects with the lower orange trendline, we will be looking for trend-following long setups on lower timeframes.

As per our last LDO analysis, it rejected the $0.5–$0.6 support zone cleanly and has been trading higher since then.
This week, LDO broke above the $1–$1.1 resistance zone, which is now acting as support.
Thus, as long as the $1 support level holds, we will be looking for long setups targeting the upper bound of the range at $1.5.

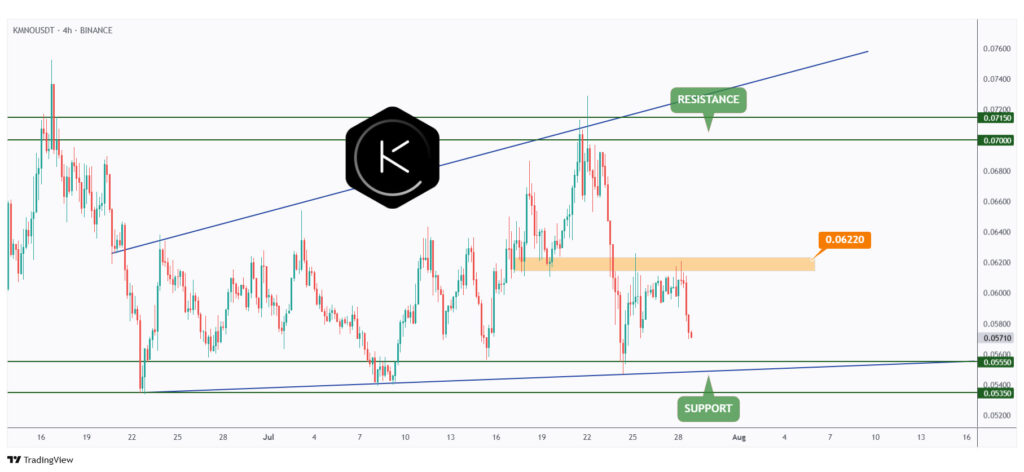
As per our previous Coin of the Week article, KMNO has been trading within the flat rising wedge marked in blue.
This week, KMNO is retesting the lower bound of the wedge, which lines up perfectly with the $0.055 support level.
As long as the support holds, we will be looking for the next bullish impulse targeting the upper bound of the wedge.
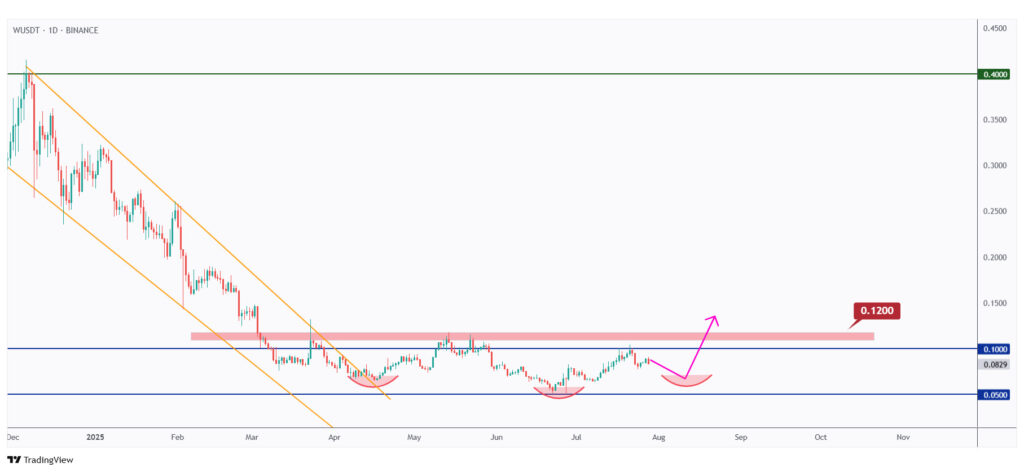
W has been holding within a narrow range between the $0.05 and $0.10 round numbers.
Since it is currently trading around its all-time low area, we will be looking for long-term long setups.

That big range on W is forming an inverse head and shoulders pattern.
For the bulls to finally take over and activate the markup phase, a break above the $0.12 neckline marked in red is needed.
Quotes / Advices
In trading, losses are inevitable. What matters is how you manage and learn from them to come out stronger.
~ Steve Nison
Closing Remarks
In summary, BTC continues to consolidate between $115,000 and $120,000, with the broader trend remaining bullish as long as it holds within the rising channel.
A breakout above the falling red channel is needed to kick off the next major impulse toward $135,000, while a drop toward $111,500 remains possible in the short term.
As for altcoins, GRT is forming a bullish wedge and needs a break above $0.132 to confirm a move higher.
OP is retesting key support and showing potential for a bounce toward $1, especially if $0.67 holds.
LDO flipped the $1–$1.1 resistance into support and looks poised to push toward $1.5.
KMNO is retesting support at $0.055 within a rising wedge, while W is forming an inverse head and shoulders pattern, with $0.12 as the key breakout level to watch.