
Welcome to another crypto market outlook for the 26th of July!
July is coming to an end, and even though the last week has been bearish, the overall month has been good to us. Are you ready for August — another bullish month, according to previous cycles? Let’s go over the possible scenarios together for the month ahead.
Today, we will cover the following topics:
– Market Heatmap and Fear and Greed Index
– US500 and DXY
– USDT.D, Bitcoin and Ethereum Analysis
– Quotes / Advices
– Closing Remarks
Market Heatmap and Fear and Greed Index
The 7-day crypto heatmap is signaling altseason, as BTC closed the week bearish while ETH surged by over 5%. This gave altcoins room to thrive and break above previous highs.
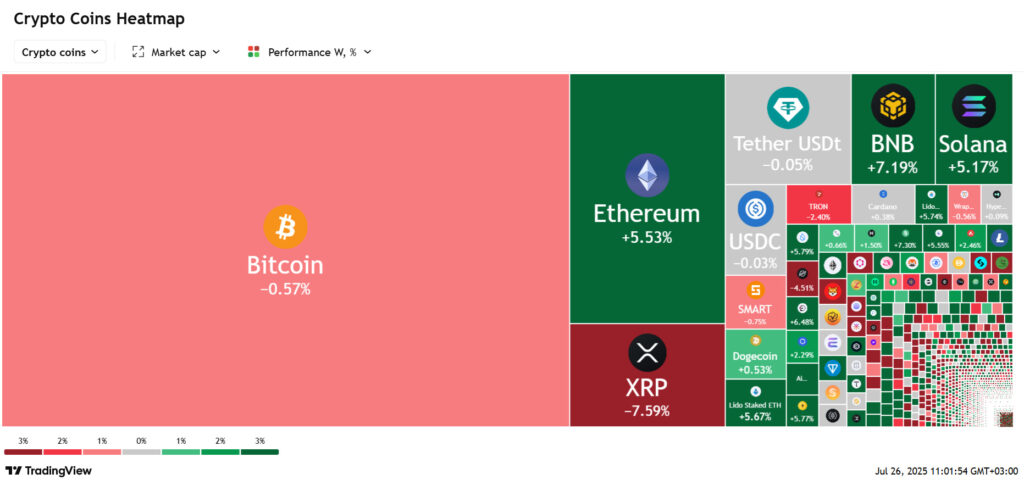
The Fear and Greed Index has been signaling Greed for three consecutive weeks — a clear sign that traders are more optimistic than ever.

US500 and DXY analysis
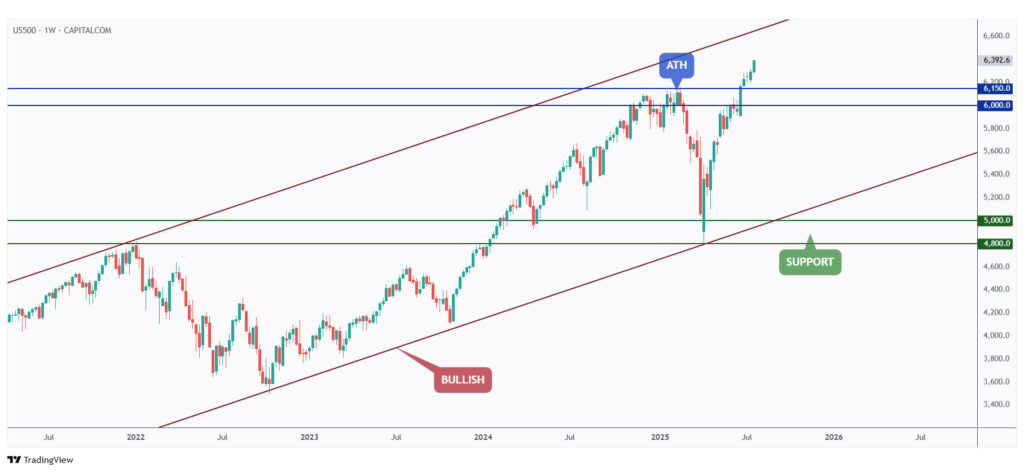
As per our latest US500 update, it’s still in the price discovery phase, recording new all-time highs daily.
This is a perfect example of a clear bullish trend across both stocks and crypto.
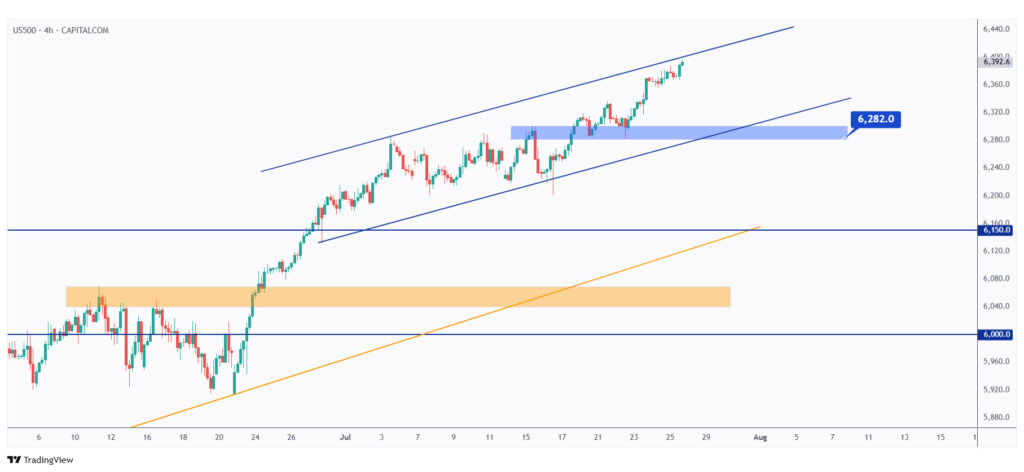
The bulls will remain in control as long as the US500 continues to trade within the rising blue channel.
This week, the US500 is retesting the upper bound of the channel, suggesting a potential short-term bearish correction next week.
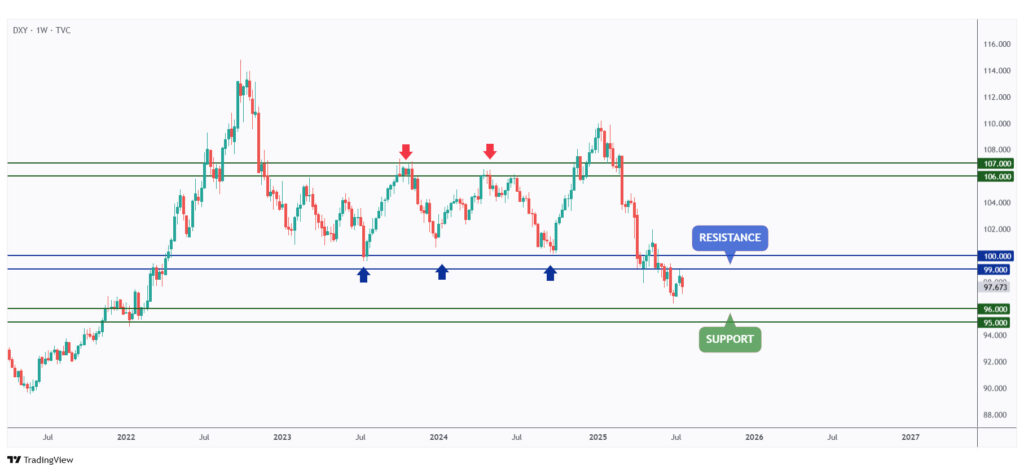
DXY rejected our $99 resistance level perfectly this week, and the overall bias has turned bearish again.
As long as the bears remain in control, further downside toward the $96 mark is expected.
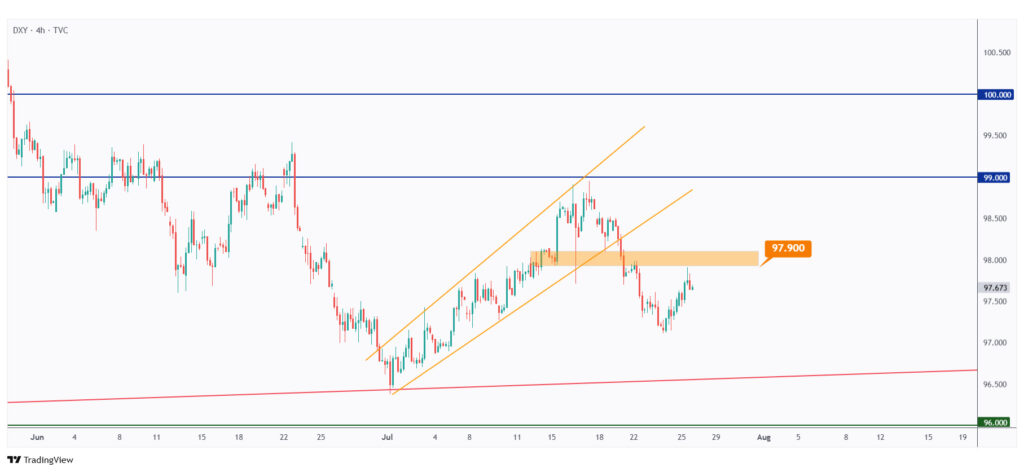
In the medium term, the bears took over after DXY broke below the orange channel and the last major low at $97.9.
Next week, we expect another bearish leg for DXY, which would be bullish for crypto.
USDT.D, Bitcoin, and Ethereum analysis
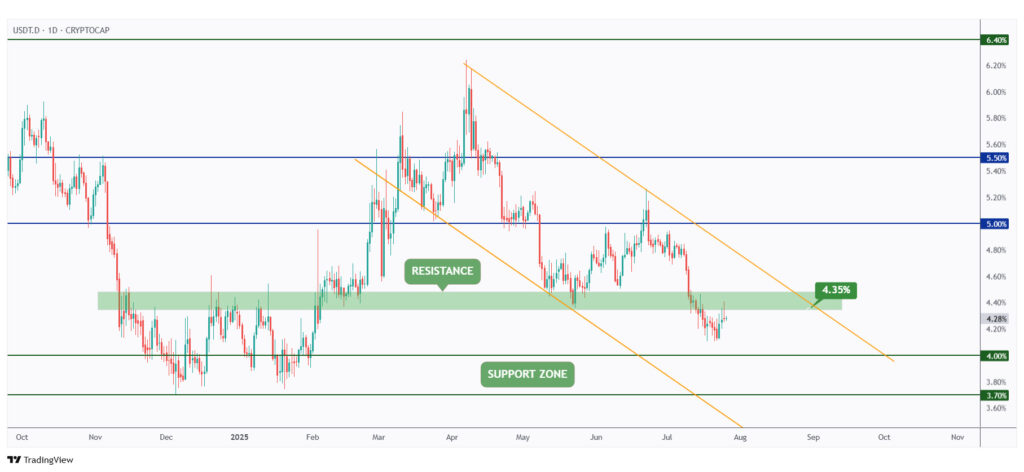
As per our overview last week, USDT.D is precisely rejecting the 4.35% resistance level.
This is extremely bullish for crypto, as long as the 4.35% resistance holds, further downside toward the 4% support level is expected for USDT.D.
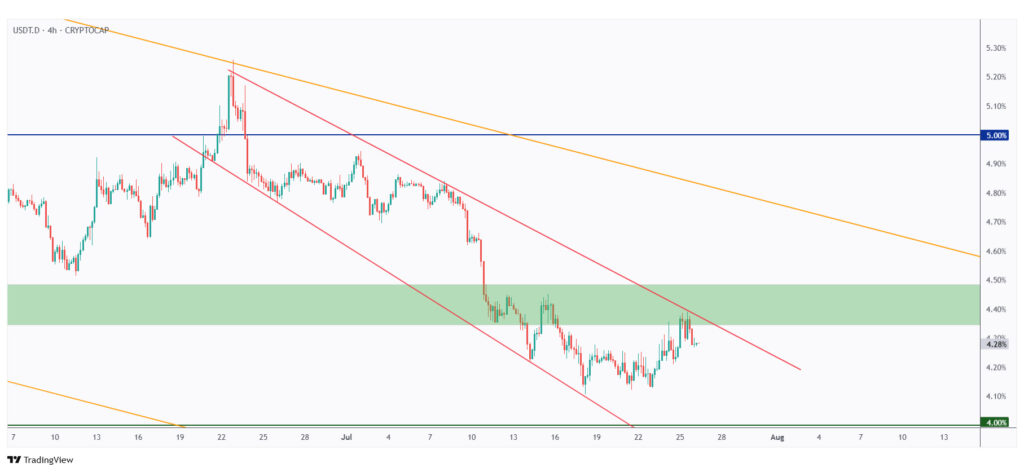
In the medium term, USDT.D will remain bearish as long as it trades within the falling channel marked in red.
A shift in momentum will occur if, and only if, the channel is broken to the upside — which would be bearish for crypto.
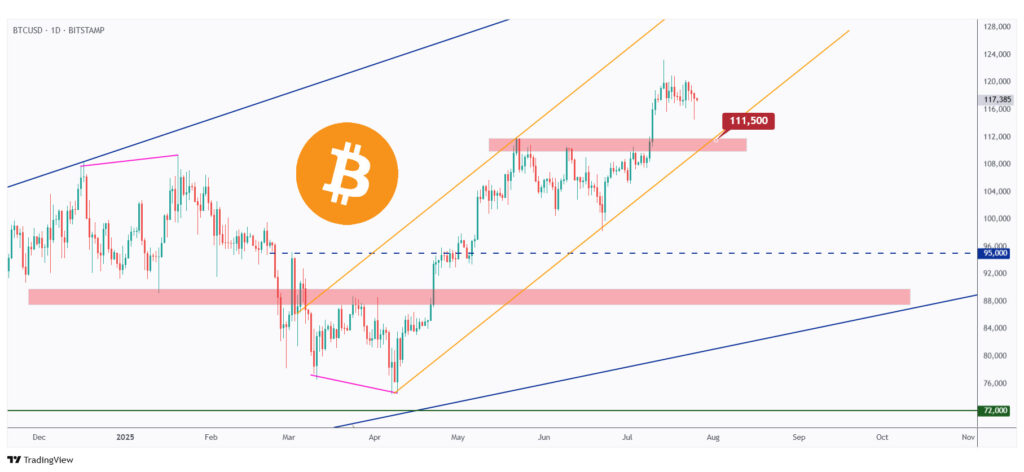
As mentioned in our latest BTC update, the overall bias remains bullish as long as it continues to trade within the rising orange channel.
As BTC approaches the $111,500 major low — which intersects with the lower orange trendline — we’ll be looking for trend-following long setups.

The $111,500 level is a strong rejection zone, as it marks the intersection of a demand zone, the lower red trendline, and the lower orange trendline.
As long as this intersection holds, the only way from here is up.
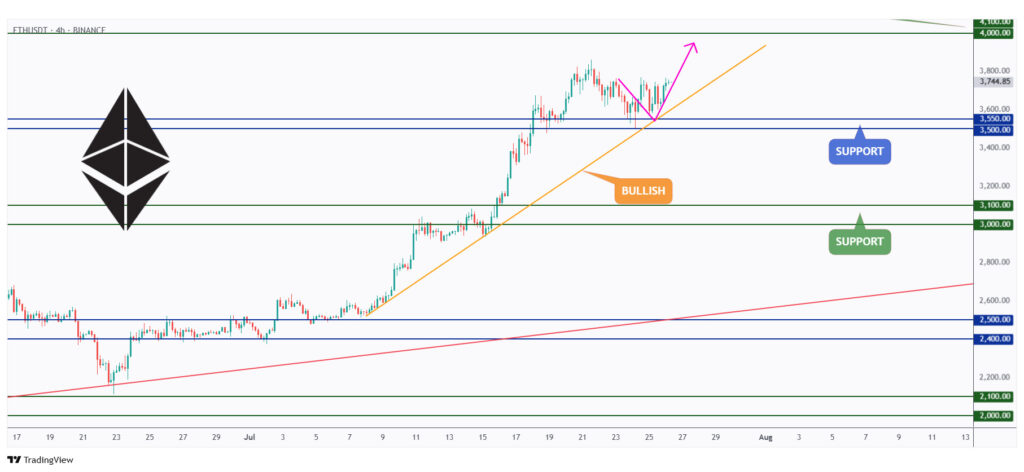
As expected in our latest ETH update, it rejected the $3,500 support level and the orange trendline, then traded higher.
As long as the bulls remain in control, a further continuation toward the $4,000 mark is very likely.
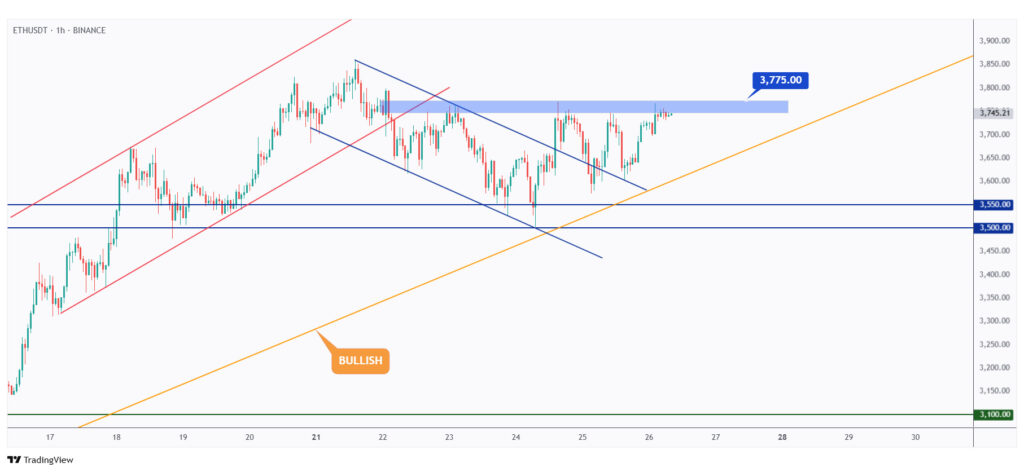
For the bulls to take over and trigger the next upward impulse, ETH needs to break above the blue structure at $3,775.
Until then, ETH is likely to remain stuck within a wide range between $3,600 and $3,775.
Quotes / Advices
The most important investment you can make is in yourself.
~ Warren Buffett
Closing Remarks
In summary, despite a bearish final week, July closed on a strong note, and August is shaping up to be another bullish month if historical cycles repeat.
The 7-day heatmap and Fear & Greed Index point to rising optimism, with altcoins showing strength as ETH outperformed BTC.
US500 remains in price discovery mode, while DXY turned bearish after rejecting resistance — both bullish signs for crypto.
USDT.D is also trending downward, reinforcing the crypto-positive sentiment. BTC is holding within its rising channel near key support, and ETH is showing bullish momentum but remains range-bound until a breakout above $3,775.