

Welcome to our latest crypto market outlook for April 30th!
The crypto market is optimistic again after a couple of tough months. Which altcoins are on your watchlist? Here are five I’m currently keeping an eye on: DOT, JASMY, ONE, QTUM, and SUI.
Today, we will cover the following topics:
– BTC Analysis
– 5 Altcoins Analysis
– Quotes / Advices
– Closing Remarks
BTC analysis
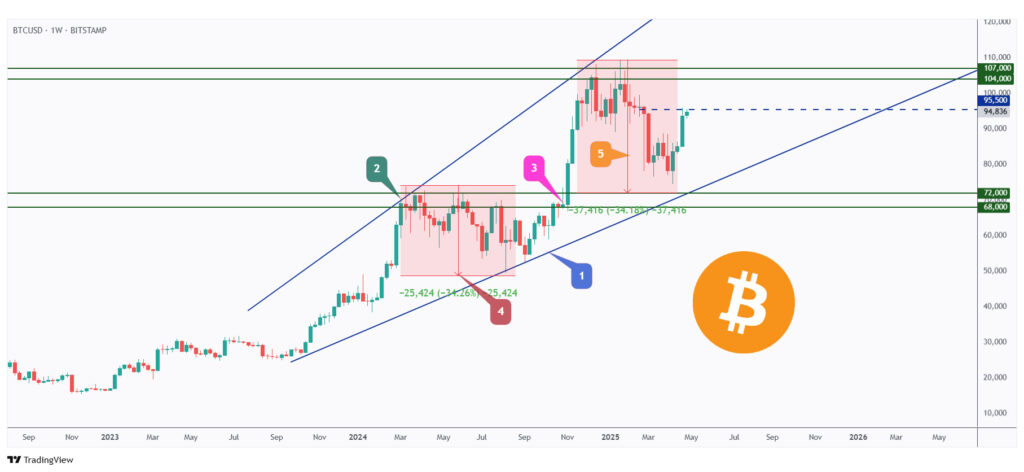
BTC rejected the lower bound of the blue rising channel, just as expected in our last market outlook.
However, it’s now approaching a make-or-break zone.
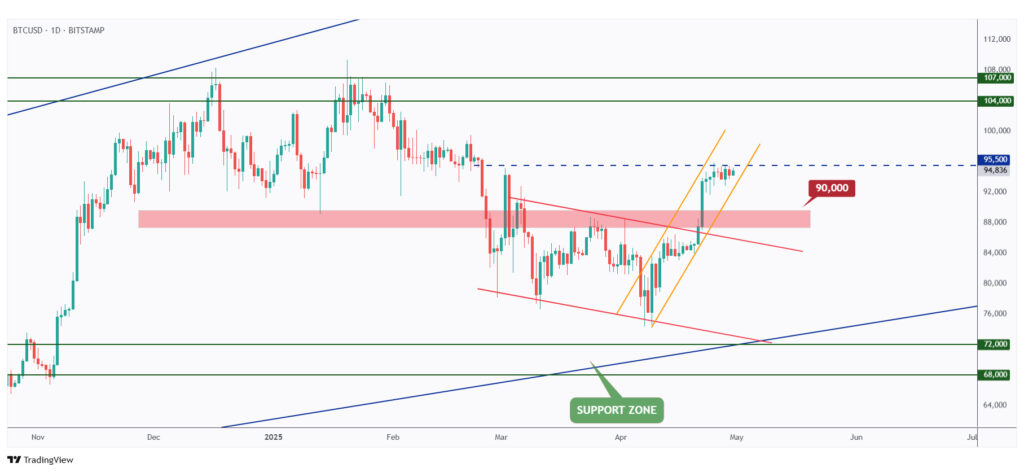
If BTC breaks above the $95,500 mark, a continuation toward the previous all-time high around $108,000 would be expected.
In parallel, if the $90,000 level and the lower orange trendline are broken to the downside, a deep bearish correction could be on the horizon.
5 Altcoins Analysis
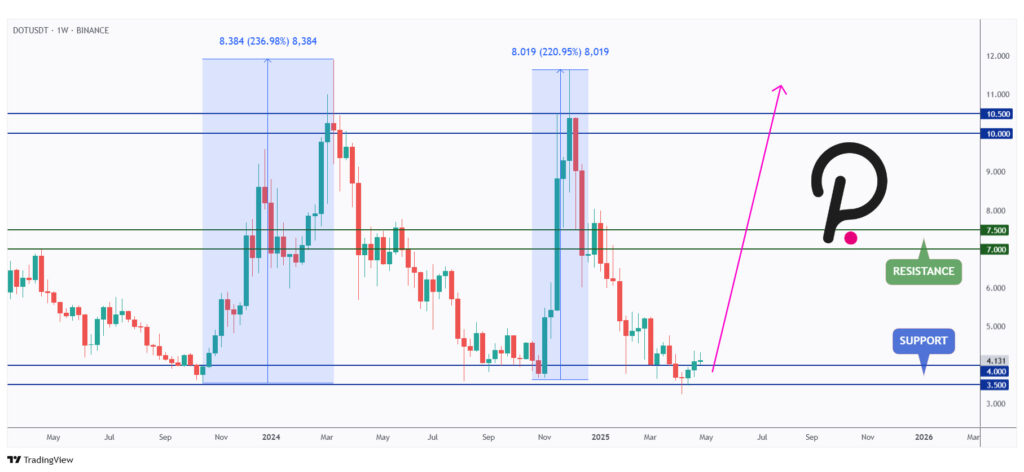
DOT is one of the best-looking charts this week, trading within a clean range between $4 and $10.
Since it’s currently sitting around the lower bound of the range, we’ll be looking for longs targeting the $7 resistance as the first target.
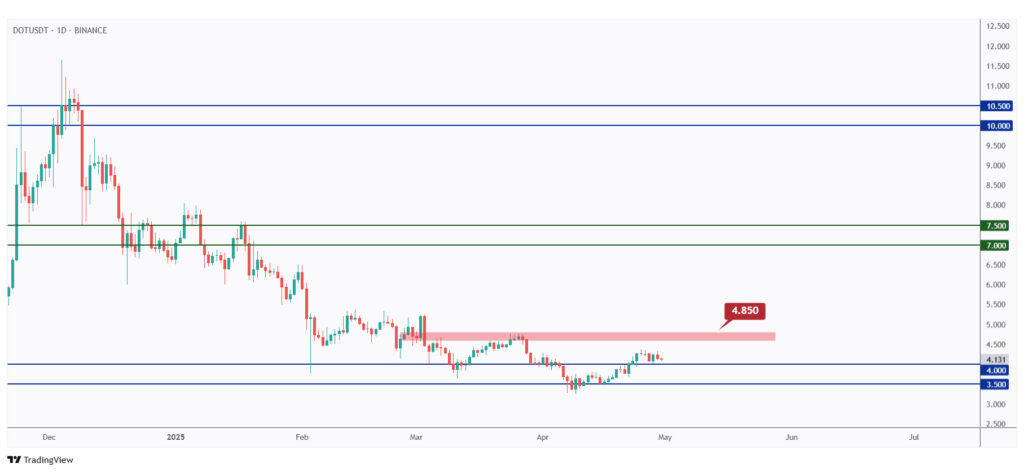
For the momentum to shift from bearish to bullish, a break above the last major high marked in red at $4.85 is needed.
Meanwhile, as DOT retests the $3.5–$4 support zone, we’ll be looking for new short-term longs.
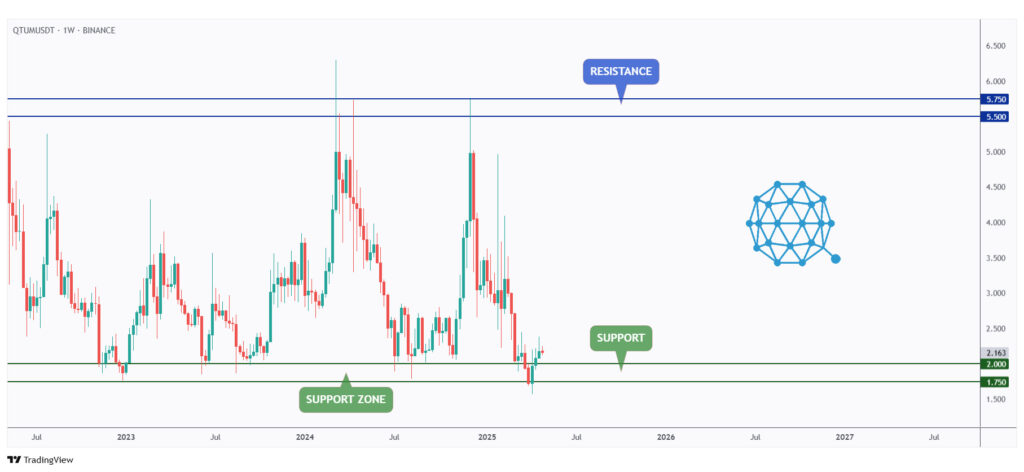
QTUM’s chart is very similar to DOT. It has also been rejecting the lower bound of its range at $1.75.
As long as $1.75 holds as support, the only way from here is up.
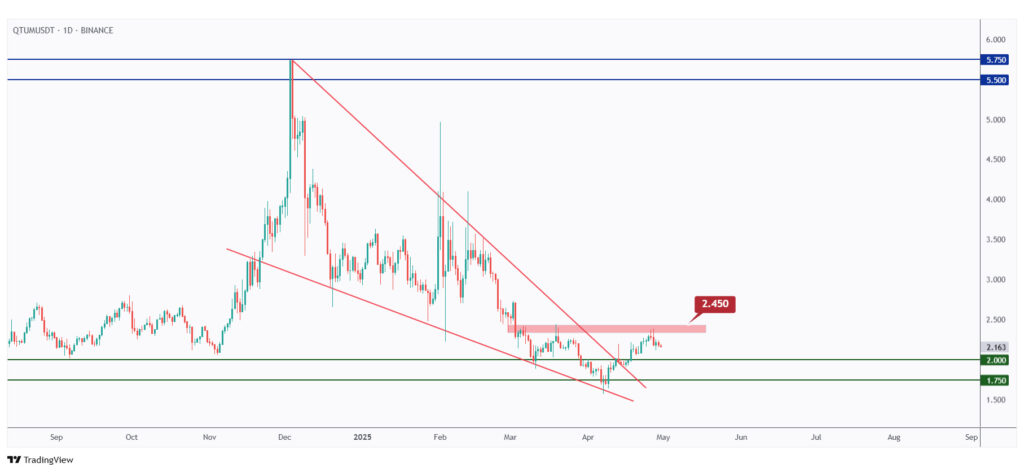
QTUM has been bearish in the medium term, trading within the falling wedge pattern marked in red.
For the bullish reversal pattern to be activated, a break above the inverse head and shoulders neckline at $2.45 is needed.
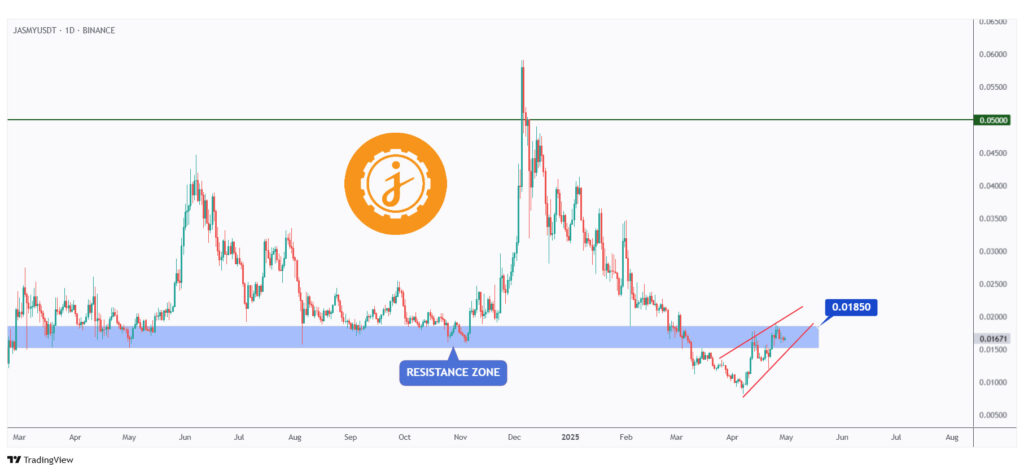
JASMY is retesting a weekly resistance marked in blue.
For the bulls to take full control, a break above the $0.0185 mark is needed.
Meanwhile, if the wedge pattern marked in red is broken to the downside, a bearish continuation toward the $0.01 level would be expected.
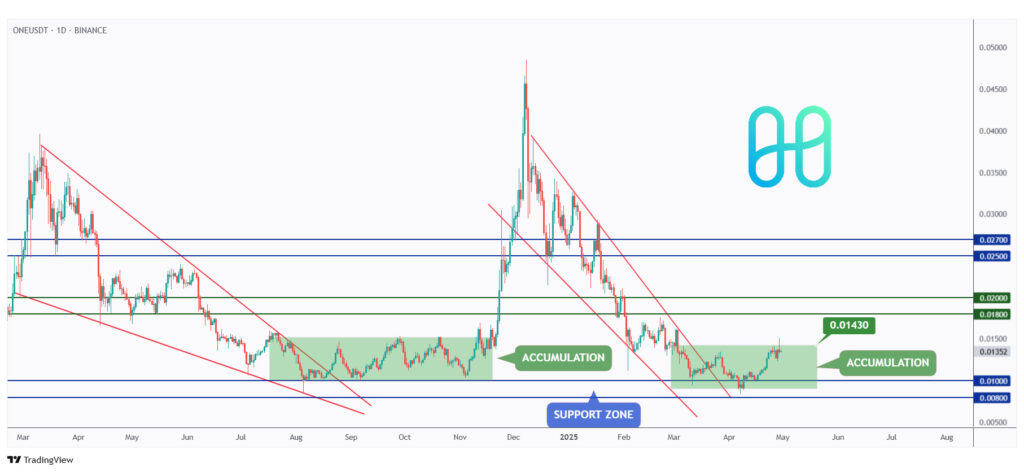
As mentioned in our last YouTube overview, ONE has been hovering within a large range, forming an accumulation phase marked in green.
For the markup phase to begin, a daily candle close above the $0.0143 level is needed.
Meanwhile, as ONE retests the lower bound of the accumulation zone and the $0.01 round number, we’ll be looking for new short-term longs.
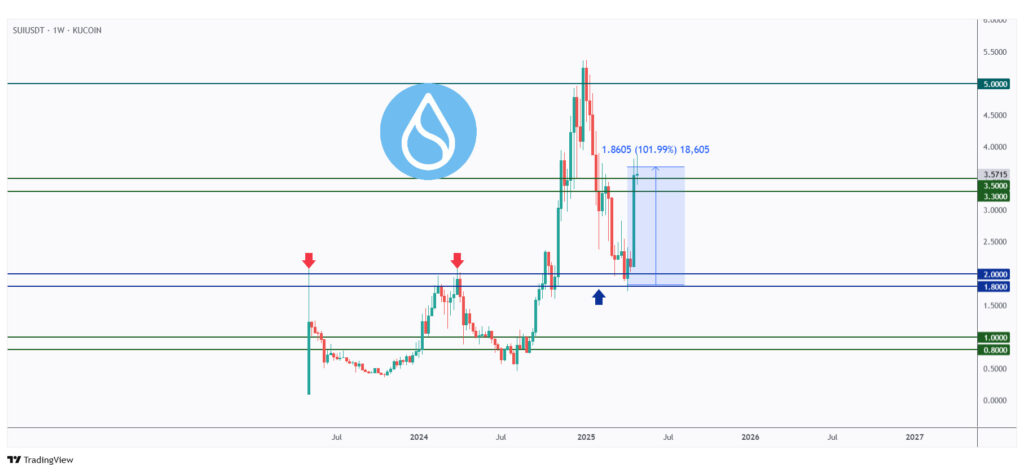
As mentioned in our last altcoins article, SUI rejected the $2 round number and surged by over 100%.
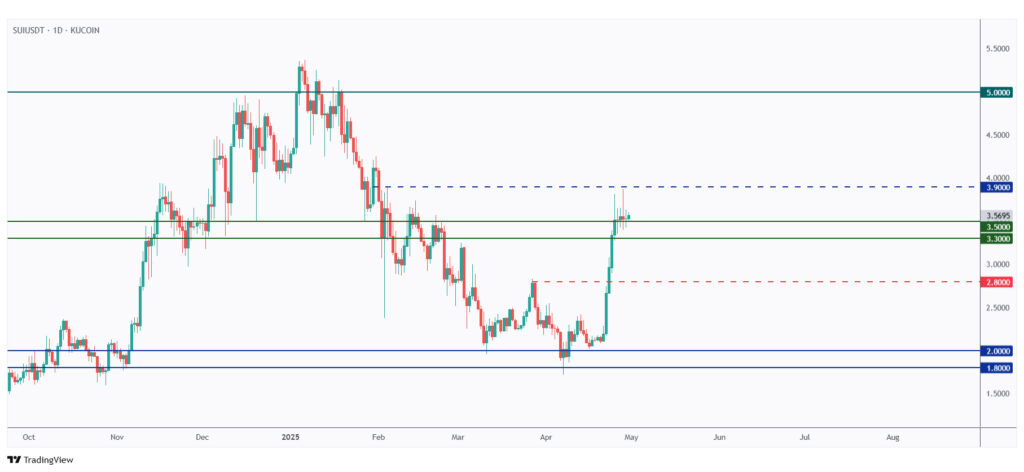
As long as the $3.3 support level holds, a continuation toward the $5 round number remains possible.
For the bulls to remain in control, a break above the $3.9 structure is needed.
In parallel, if the $3.3 major low is broken to the downside, a bearish correction toward the $2.8 structure marked in red would be expected.
Quotes / Advices
Where you want to be is always in control, never wishing, always trading, and always, first and foremost, protecting your butt.
~ Paul Tudor Jones
Closing Remarks
In summary, After months of downside pressure, optimism has returned to the crypto market. BTC is now at a make-or-break zone, with $95,500 as key resistance and $90,000 as crucial support.
Meanwhile, five altcoins are showing promising setups:
DOT is ranging between $4–$10 and nearing support.
QTUM is forming a bullish reversal within a falling wedge.
JASMY faces resistance at $0.0185.
ONE remains in accumulation near the $0.01 zone.
SUI is holding strong above $3.3 after a 100% surge.