

Welcome to another crypto market outlook for the 22nd of March!
The crypto market isn’t taking a break — it has been in a bullish correction phase for weeks, and a few altcoins are already showing signs of strength again. Altseason might be closer than you think, and here’s why!
Today, we will cover the following topics:
– Market Heatmap and Fear and Greed Index
– US500 and DXY
– USDT.D, Bitcoin and Ethereum Analysis
– Quotes / Advices
– Closing Remarks
Market Heatmap and Fear and Greed Index
The 7-day heatmap is screaming bullish, as both BTC and ETH closed the week strong. ETH outperformed BTC this week — a clear sign that altcoin season may be on the horizon.
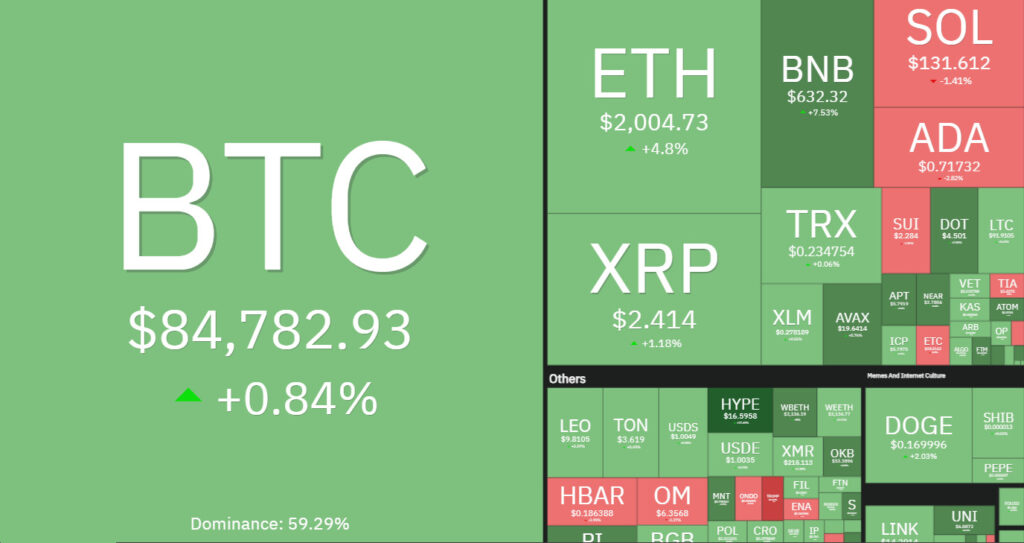
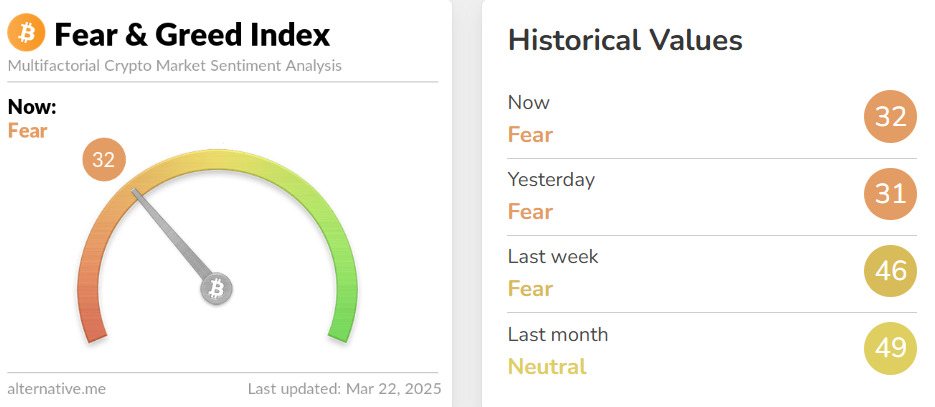
Even though the Fear and Greed Index is still signaling “Fear,” the market is already picking up — giving us a strong indication that the accumulation phase is ending and the markup phase is beginning.
US500 and DXY analysis
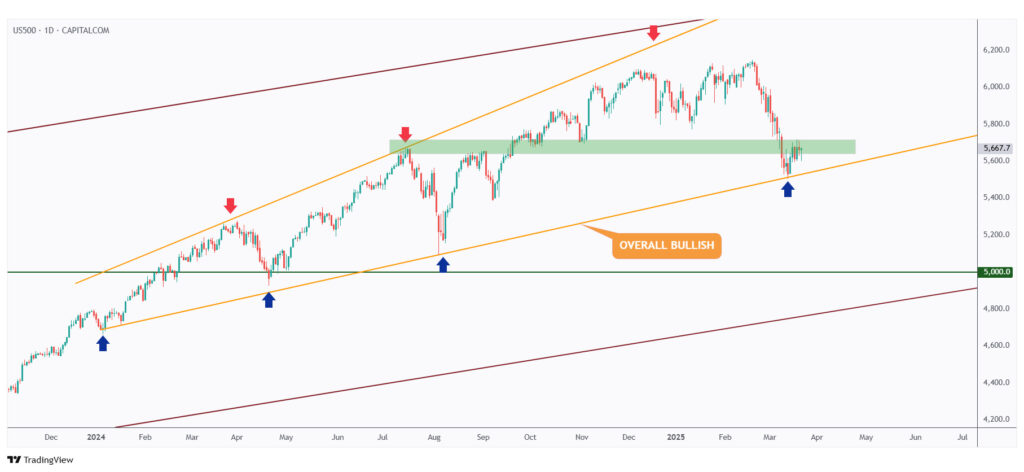
As per our latest market overview, the US500 has rejected the lower bound of the rising wedge pattern marked in orange.
As long as that ascending support holds, the bulls will retain the upper hand.

For the bulls to shift the momentum in their favor, a break above the last major high and structure, marked in green at $5,720, is needed.

DXY rejected our demand zone, marked in blue, perfectly. That’s the power of technical analysis.
As long as the demand zone holds, a corrective move toward the green resistance zone remains likely — indicating a stronger DXY.

Meanwhile, from a short-term perspective, DXY continues to hover within a range.
For the bulls to confirm control, a break above the upper boundary of the range at $104.4 is required.
USDT.D, Bitcoin, and Ethereum analysis

As per our latest USDT.D analysis, it is still struggling around the upper boundary of the resistance at 5.3%.
As long as this resistance holds, the crypto market is likely to continue its bullish correction.

In the medium term, USDT.D has been trading within the falling channel marked in orange.
If the last major high at 5.5% is broken to the upside, it could signal another dip in the crypto market.
Meanwhile, the overall sentiment remains bearish for USDT.D and bullish for crypto — especially if the blue and green trendlines are broken to the downside.

BTC remains overall bullish in the long term, trading within the weekly rising channel marked in blue. However, it is bearish in the medium term, trading within the falling wedge pattern in orange.
If the bearish correction continues, a further decline toward the $75,000 support level is highly likely.

On the other hand, for the bulls to regain control, a break above the $87,400 major high, marked in blue, is needed.
Meanwhile, a deeper dip is expected if the last low at $82,200 is broken.

As per our latest market outlook, ETH is still retesting the $2,000–$2,100 resistance zone.
For the bulls to sustain the correction phase and push toward the $2,500 resistance and the upper red trendline, a daily candle close above the $2,100 level is required.

On the other hand, if the last low marked in green at $1,900 is broken to the downside, further bearish movement toward the $1,500 support level becomes highly likely.
Quotes / Advices
Market fluctuations are your friend, not enemy.
~ Warren Buffet
Closing Remarks
In summary, the crypto market continues its bullish correction phase, with altcoins beginning to show strength — hinting that altseason may be approaching.
The 7-day heatmap and market structure support this view, despite the Fear and Greed Index still signaling fear.
Traditional markets like the US500 are holding key supports, while DXY remains in a short-term range but shows strength from demand zones.
USDT.D is facing resistance, keeping the crypto outlook bullish for now. BTC remains long-term bullish but medium-term bearish, and ETH is retesting critical resistance levels.