

Welcome to another crypto market outlook for the 29th of March!
Both international markets and the crypto market have been having a hard time recently due to Trump imposing more tariffs on various commodities and countries. Is more pain expected, or are the bulls gearing up for April? Let’s go over the possibilities together.
Today, we will cover the following topics:
– Market Heatmap and Fear and Greed Index
– US500 and DXY
– USDT.D, Bitcoin and Ethereum Analysis
– Quotes / Advices
– Closing Remarks
Market Heatmap and Fear and Greed Index
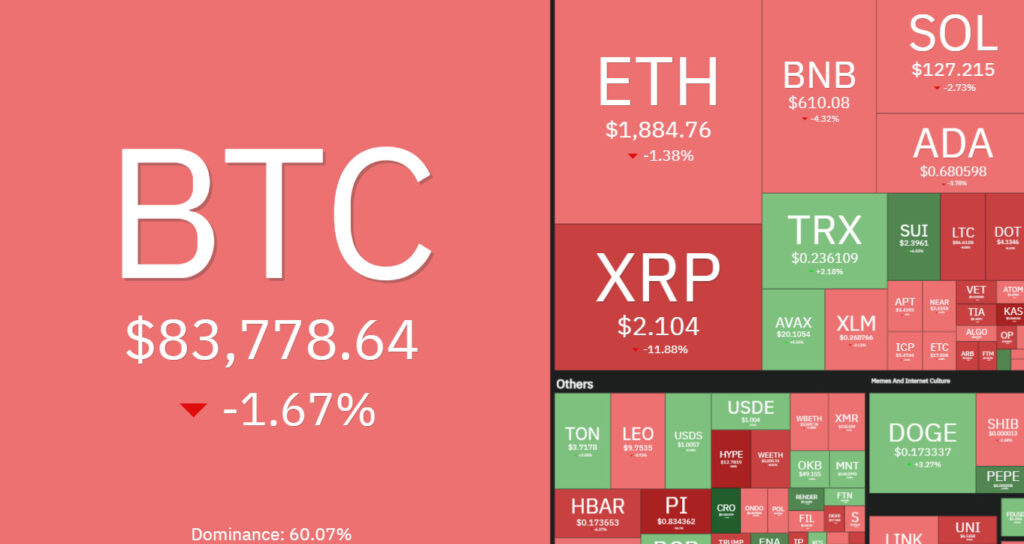
The crypto heatmap is showing no signs of relief. This week also closed bearish, ending March in the red. Both BTC and ETH dipped by over 1.3%, dragging the entire crypto ship down with them.
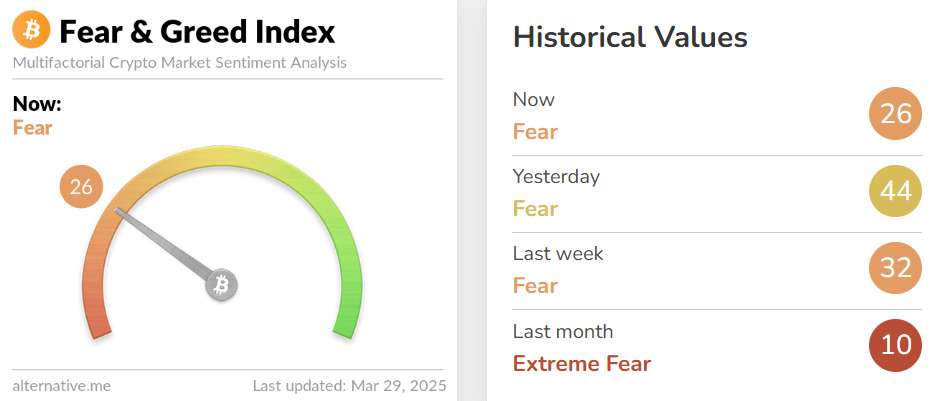
The Fear and Greed Index is still dropping sharply, recording a new monthly low for March at 26—showing no signs of an accumulation phase in the making.
US500 and DXY analysis
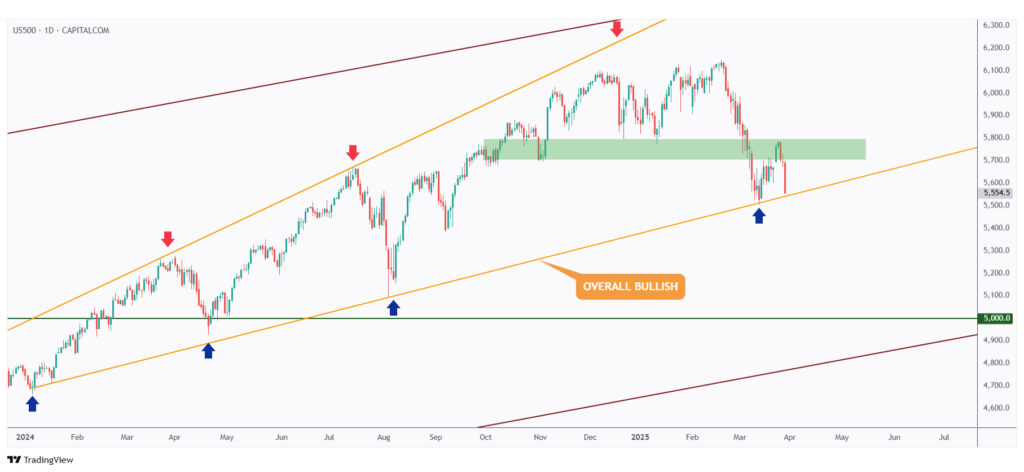
According to our latest US500 analysis, it is currently retesting the lower bound of the rising wedge pattern marked in orange.
As long as the trendline holds, the bulls could still surprise the market with a strong move.
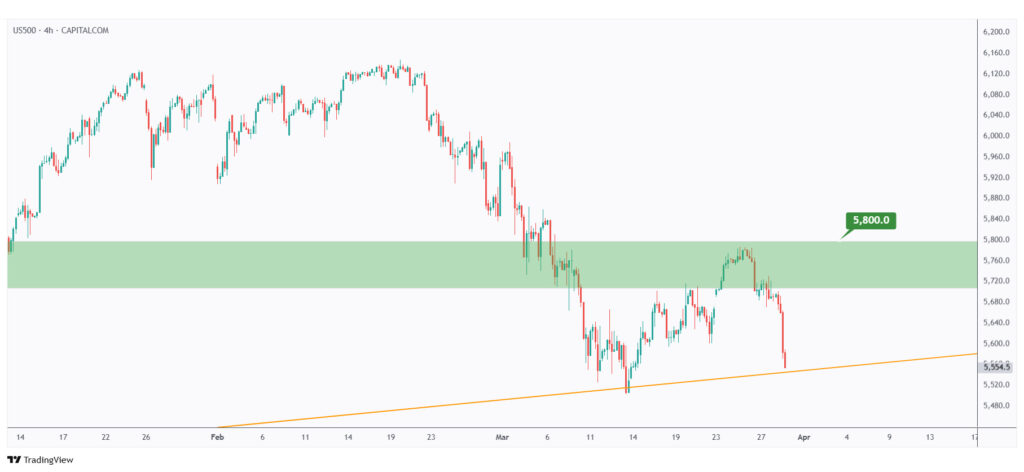
If the recent low at $5,500 is broken to the downside, more pain can be expected for stocks.
In parallel, for the bulls to take over, a break above the recent major high at $5,800 is needed.
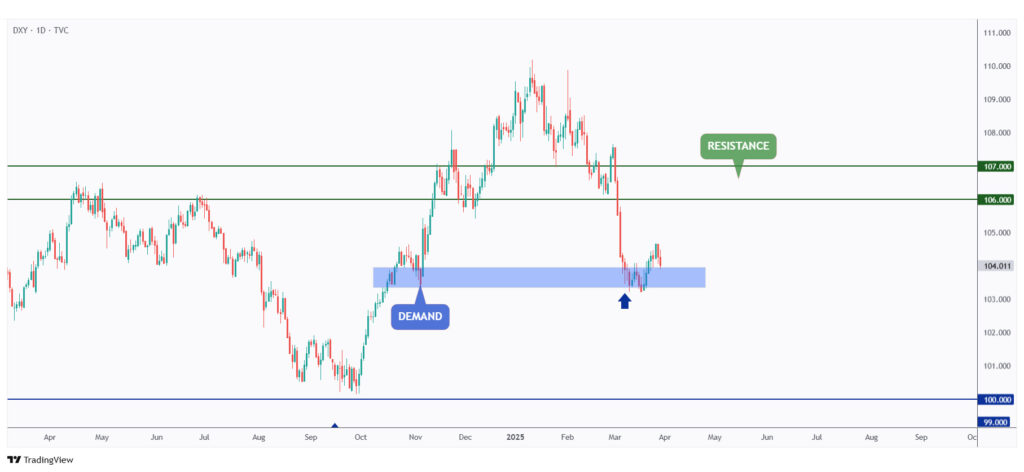
DXY has also been retesting the demand zone marked in blue.
As long as the zone holds, the bulls are likely to remain in control.
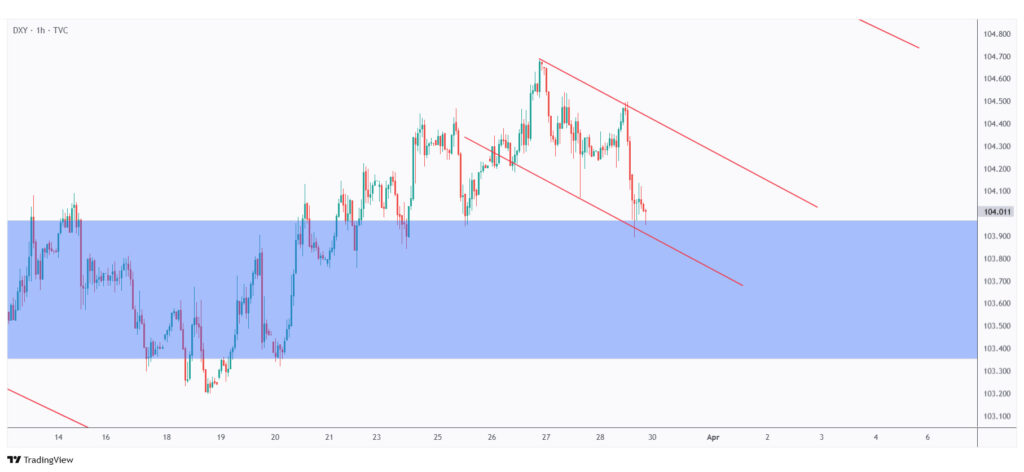
In the short term, DXY has been in a correction phase, trading within the falling channel marked in red.
For an impulsive move to begin, a break above the channel is needed. Until then, a further decline remains highly likely.
USDT.D, Bitcoin, and Ethereum analysis
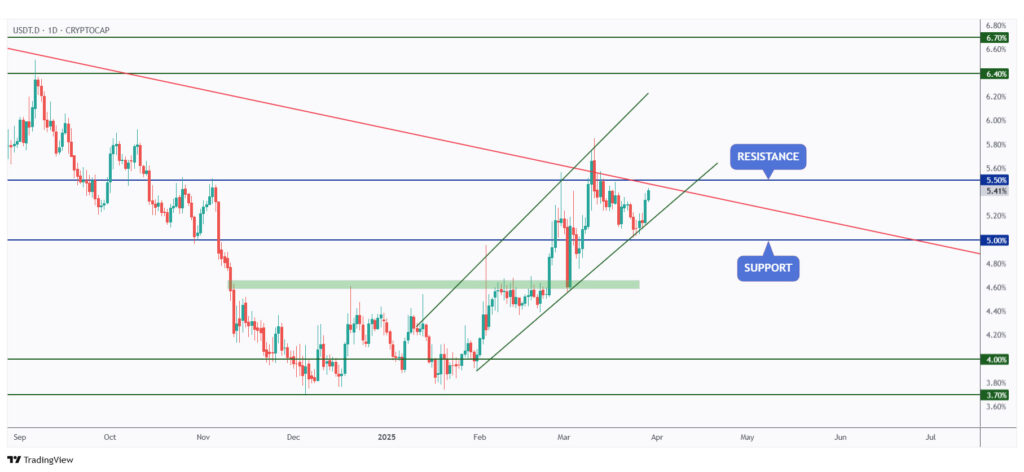
According to our last market overview, USDT.D rejected the 5% support level and the lower bound of the rising green channel.
This rejection triggered a bearish impulse movement across the crypto market.
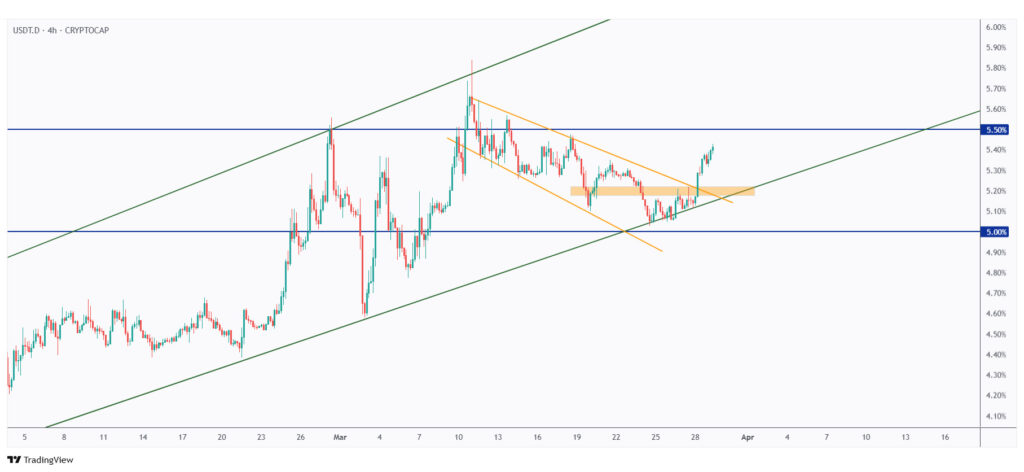
If the 5.5% round number is broken to the upside, further downside pressure can be expected for the crypto market.
However, if the bears manage to defend the 5.5% resistance, it would signal a positive shift for crypto.
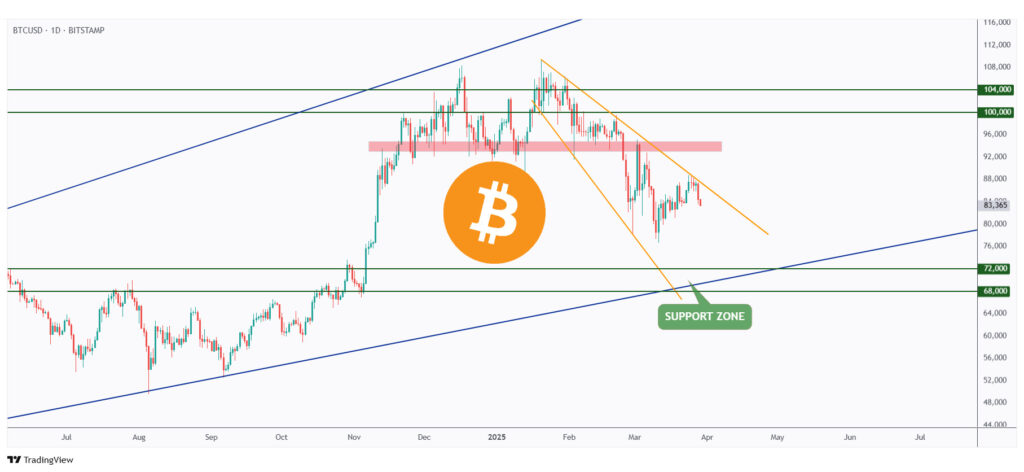
According to our last roundup article, BTC rejected the upper bound of the falling wedge pattern marked in orange.
As long as the bears maintain control, an impulse toward the $75,000 support zone—which aligns with the lower daily blue trendline—is now highly likely.
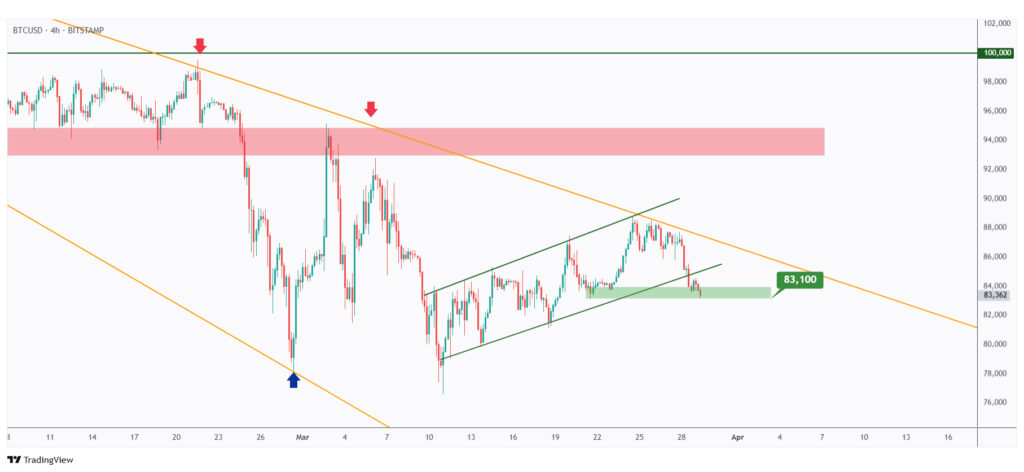
For the bears to confirm the major impulse on the daily timeframe, a break below the last low marked in green at $83,100 is needed.
Meanwhile, the bulls still have a chance to step in — and that’s what we’re all hoping for.
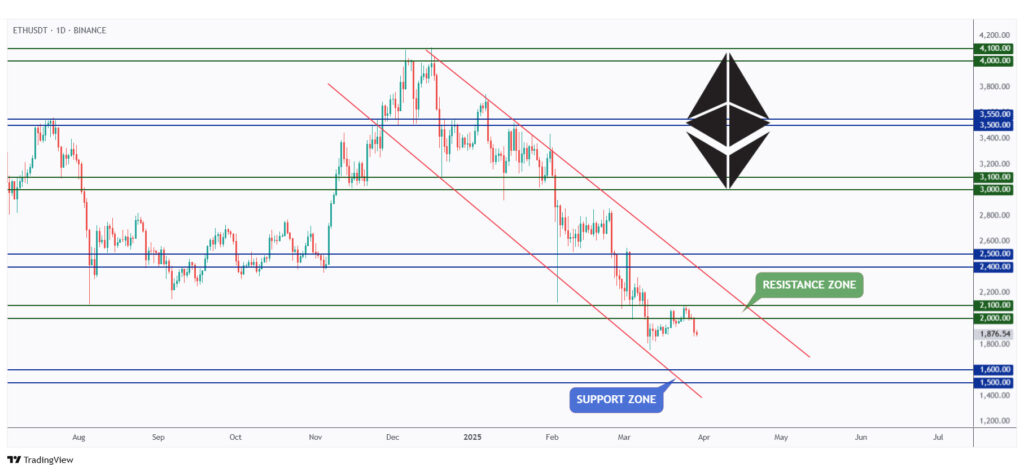
ETH also rejected the $2,100 resistance level, pushing its price lower once again.
It will remain bearish unless the bulls manage to close a daily candle above $2,100.
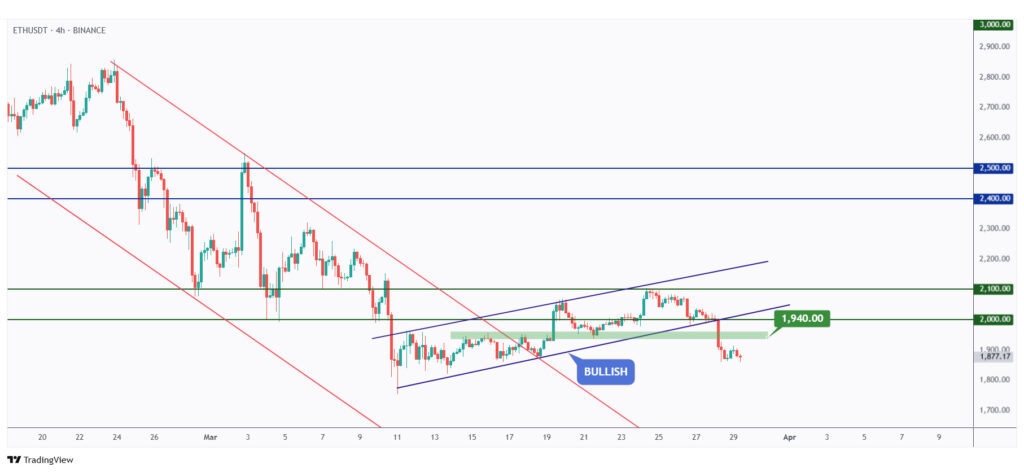
The bears confirmed control after breaking below the last low at $1,940, as mentioned last week.
This breakdown signals a delay in the altseason, which is now unlikely to begin until ETH breaks above the $2,100 mark.
Quotes / Advices
Patterns don’t work 100% of the time. But they are still critical because they help you define your risk. If you ignore patterns and focus on hunches, feelings, and hot tips, just forget about achieving consistency.
~ Ifan Wei
Closing Remarks
In summary, the crypto market closed March on a bearish note, with BTC and ETH both dipping over 1.3%, while the Fear and Greed Index hit a new monthly low at 26—indicating ongoing uncertainty and lack of accumulation.
In traditional markets, US500 is retesting key support within a rising wedge, with potential for either a bounce or deeper correction. Meanwhile, DXY remains in a short-term downtrend but is holding a key demand zone.
BTC and ETH both face strong resistance levels, and unless broken, the bearish momentum may persist. Altseason remains on hold as ETH struggles below $2,100.