

Welcome to our latest crypto market outlook for January 22nd!
The crypto market has been quiet this week, with fewer people buying. This creates the perfect opportunity to time your next entries. Here are my top altcoins at the moment: CTXC, ONE, TRX, VANA, and XVG.
Today, we will cover the following topics:
– USDT.D and BTC Analysis
– 5 Altcoins Analysis
– Quotes / Advices
– Closing Remarks
USDT.D and BTC analysis
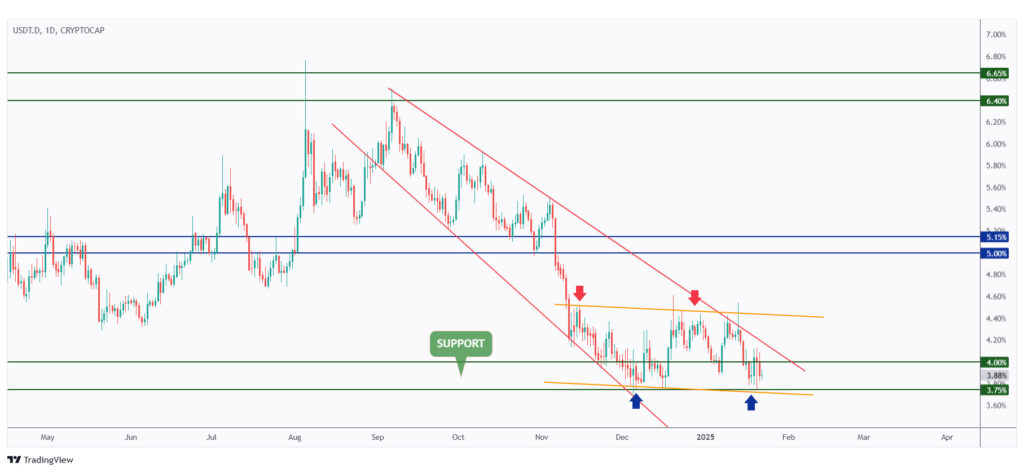
As anticipated in our previous market outlook, USDT.D rejected the upper boundary of the orange channel and traded lower throughout the week.
Currently, USDT.D is approaching the lower boundary of support at 3.75%.
If the 3.75% level is broken to the downside, it could signal the beginning of another long-term bullish phase for crypto.
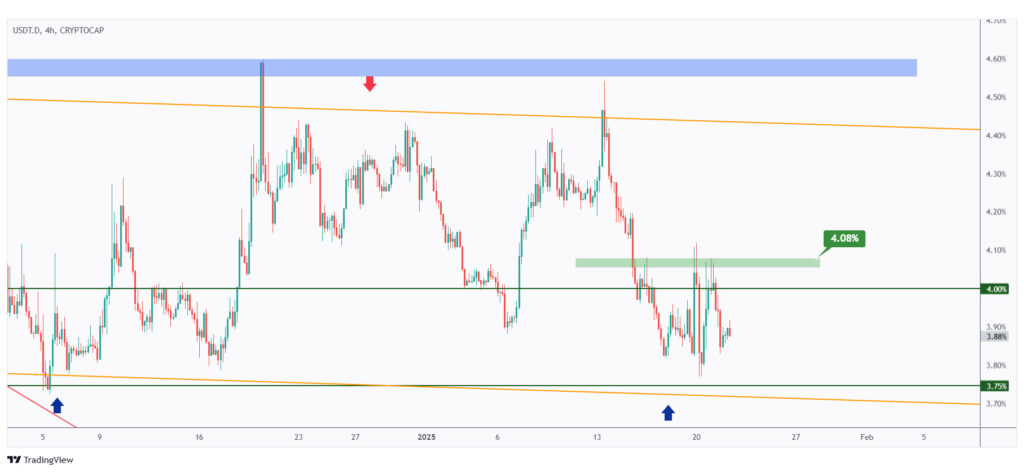
In the medium term, USDT.D has been fluctuating within a narrow range between 3.75% and 4%.
If the previous major high at 4.08% is breached to the upside, a significant bearish correction in the crypto market is likely to follow.
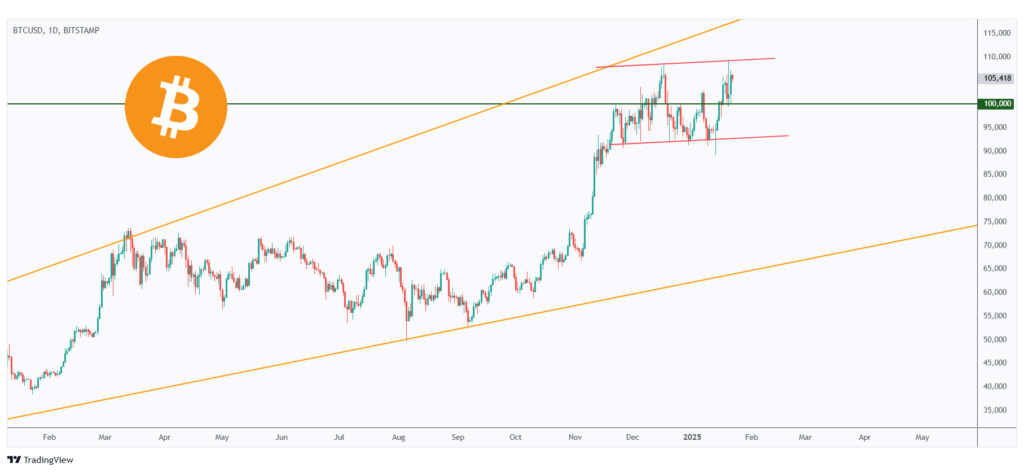
The BTC daily chart, as usual, is the exact opposite of USDT.D. It is currently hovering near the upper boundary of its range at $108,500.
As mentioned in our last BTC update, if the $108,500 level is breached to the upside, anticipate another bullish wave targeting the $120,000 mark.
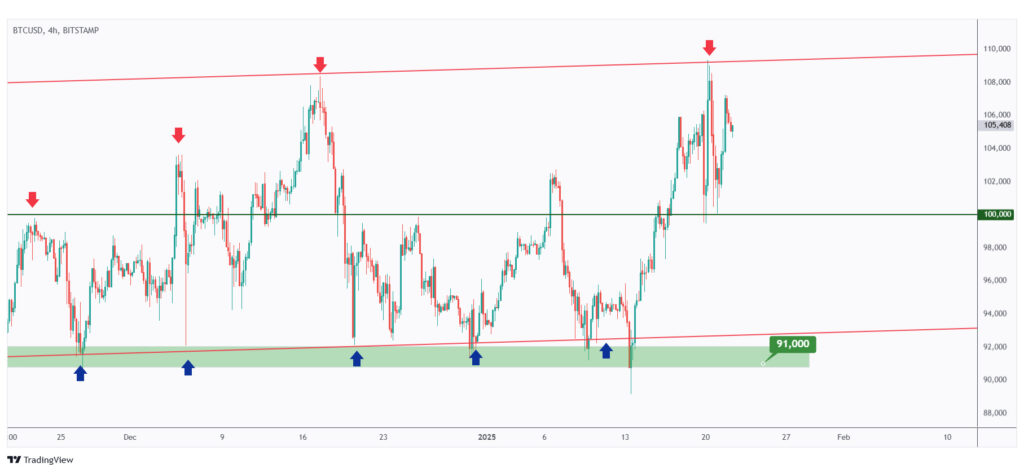
In the short term, BTC is trading within a range between $100,000 and $108,500.
As it retests the $100,000 support level, which also serves as a key psychological round number, we will be looking for new short-term long positions.
5 Altcoins Analysis
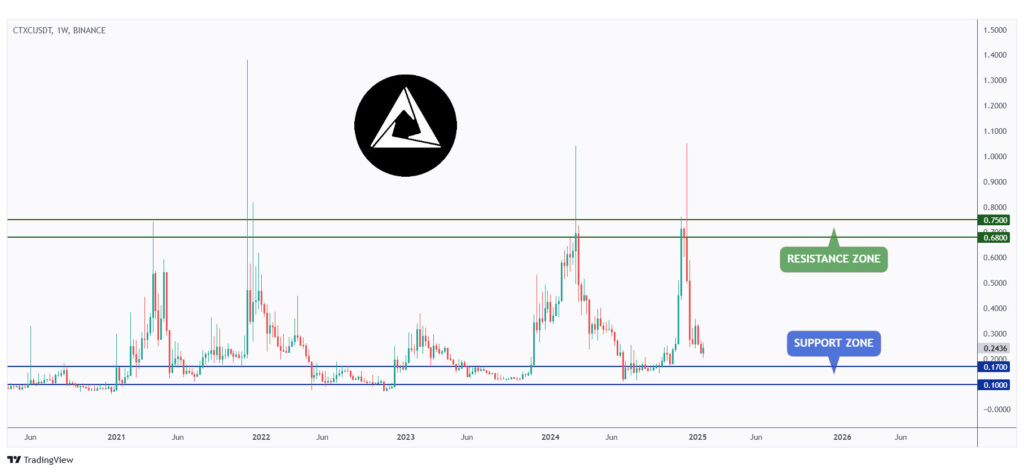
CTXC has been trading within a wide range, with support at $0.10 and resistance at $0.75.
Currently, CTXC is retesting the lower boundary of its range between $0.10 and $0.17. As a result, we will be monitoring for bullish reversal setups on lower timeframes.
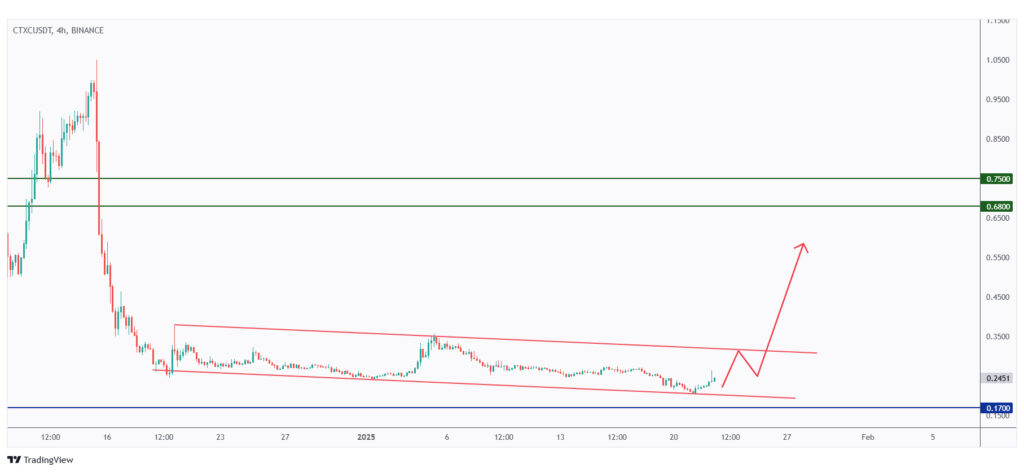
On the 4-hour chart, CTXC has been trading bearishly within a flat channel marked in red.
For the bulls to regain control and initiate the next bullish phase, a breakout above the upper red trendline is required.
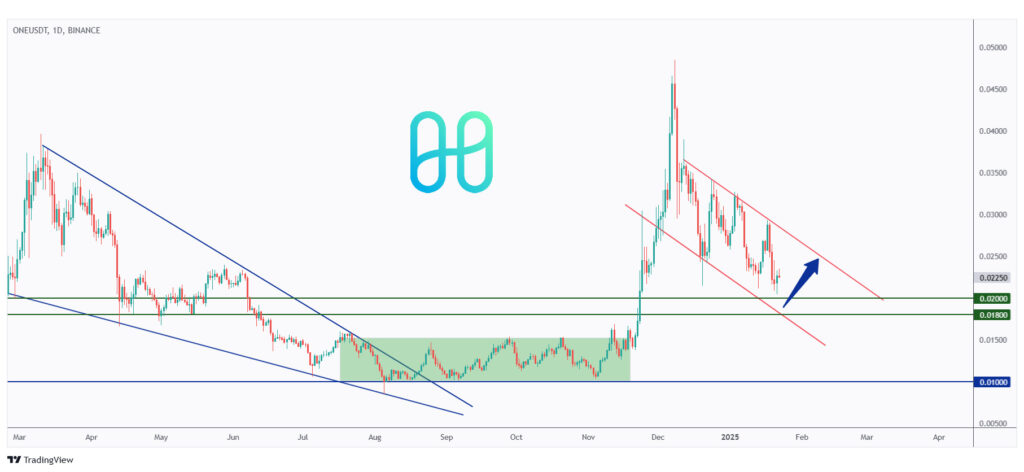
ONE has been bearish, trading within the falling channel marked in red.
It is currently approaching the lower boundary of the channel, which intersects with the $0.018–$0.02 support zone.
As long as this support zone holds, we will look for short-term long opportunities to capitalize on the next bullish correction phase within the channel.
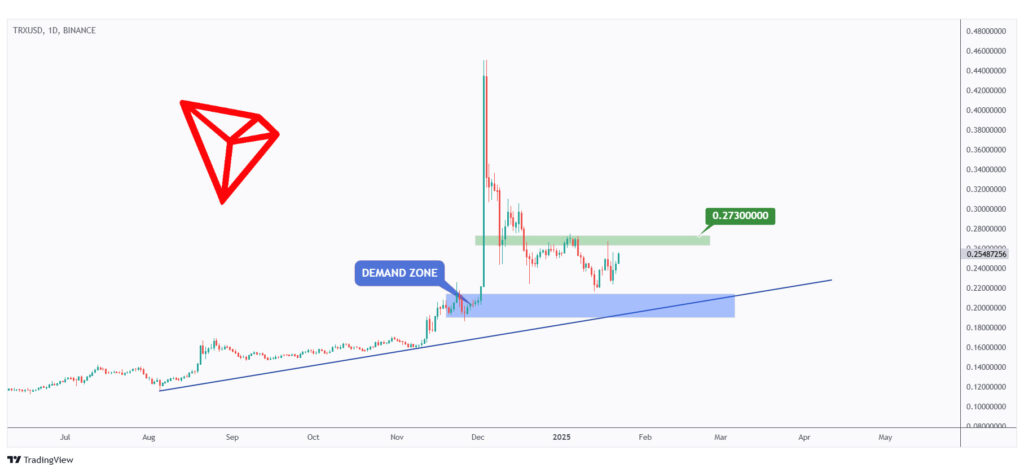
Next up is TRX. As mentioned in our previous market overview, TRX has been undergoing a deep correction phase.
For the bulls to regain long-term control, a breakout above the last major high at $0.273 is required.
In the meantime, as TRX approaches the demand zone marked in blue, we will be looking for short-term long opportunities.
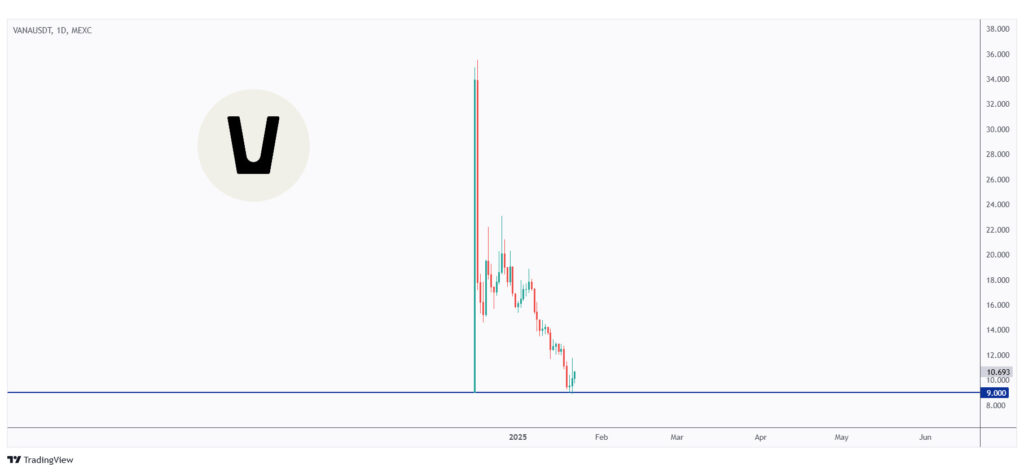
Analyzing VANA, it has been bearish since its listing.
Currently, it is approaching its all-time low around $9, presenting a significant opportunity to capture the next impulsive movement.
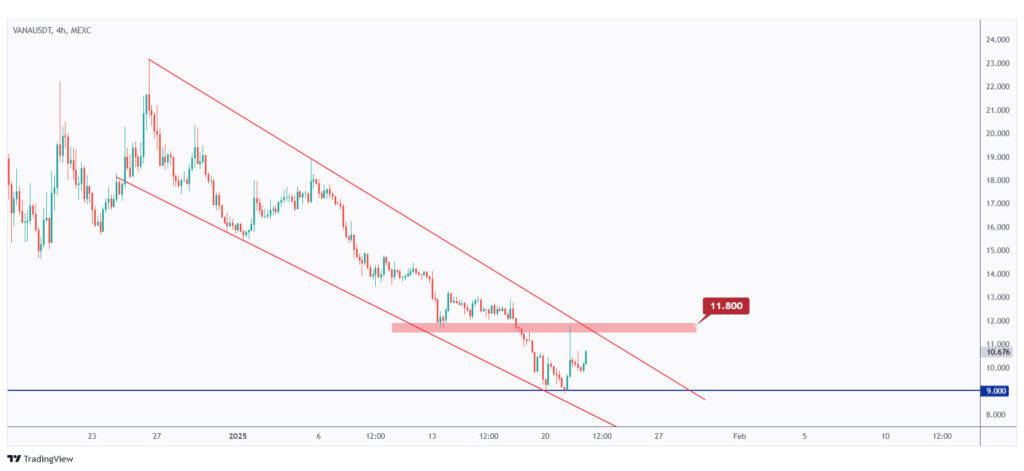
In the medium term, the bearish trend on VANA has been encapsulated within a falling wedge pattern marked in red.
For the bulls to regain control and shift the momentum in their favor, a breakout above the last major high at $11.8, marked in red, is required.
Last but not least, XVG is retesting a significant support level and key psychological round number at $0.01.
As long as the $0.01 support level holds, we anticipate the bulls to step in at any moment.

For the bulls to regain control, a breakout above the last major high at $0.012 is essential.
In the meantime, XVG will remain bearish, particularly if the $0.01 support level is broken to the downside.

Quotes / Advices
Hope is a bogus emotion that only costs you money.
~ Jim Cramer
Closing Remarks
In summary, USDT.D has rejected the upper boundary of its range and is trending downward, with key support at 3.75%.
CTXC is trading within a wide range and retesting support at $0.10–$0.17, offering potential bullish setups on lower timeframes.
ONE remains bearish within a falling channel, with the $0.018–$0.02 support zone providing an opportunity for short-term bullish corrections.
TRX continues its deep correction phase and requires a breakout above $0.273 to regain long-term bullish momentum, though short-term opportunities may arise near the demand zone.
VANA, which has been bearish since its listing, is nearing its all-time low at $9, presenting a potential impulsive movement. A breakout above $11.8 would confirm a bullish reversal.
Lastly, XVG is retesting a critical support level at $0.01, and while bearish momentum persists, a breakout above $0.012 is needed to shift the trend in favor of the bulls.