

Both the international and crypto markets appear to be breathing again after Trump announced a 90-day pause on tariffs, except for those on China. Could this be the catalyst for the next big bullish move? Let’s find out together.
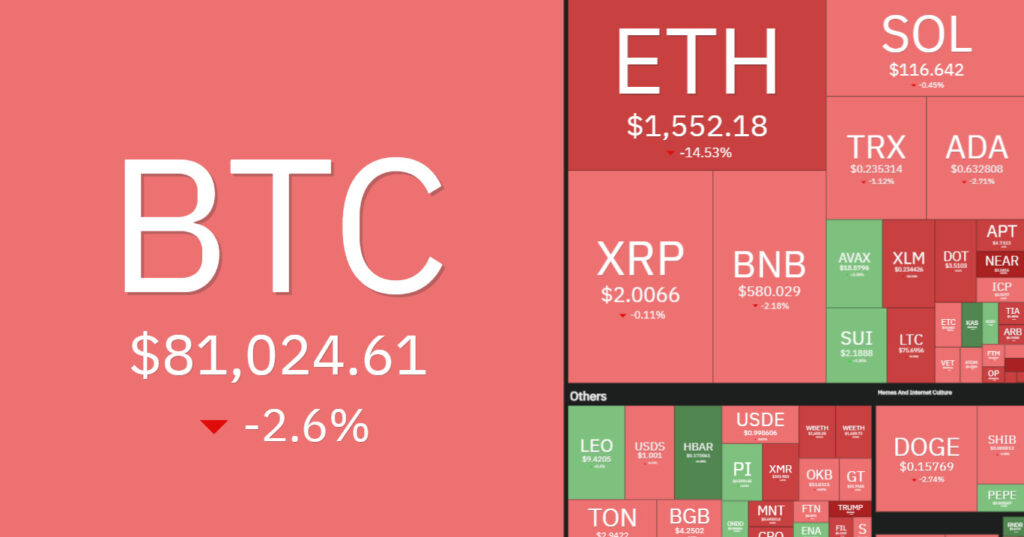
7 Days Heatmap
The overall sentiment remains bearish, as reflected in the 7-day heatmap. However, following Trump’s tariff pause, this week could still end on a bullish note if optimism continues. Two days remain until the weekly candle closes.
BTC Analysis
As per our latest BTC analysis, the overall bias remains bearish, as it continues to trade within the falling wedge pattern marked in orange.
Currently, BTC is hovering midway between the upper orange trendline and the $70,000 support zone.
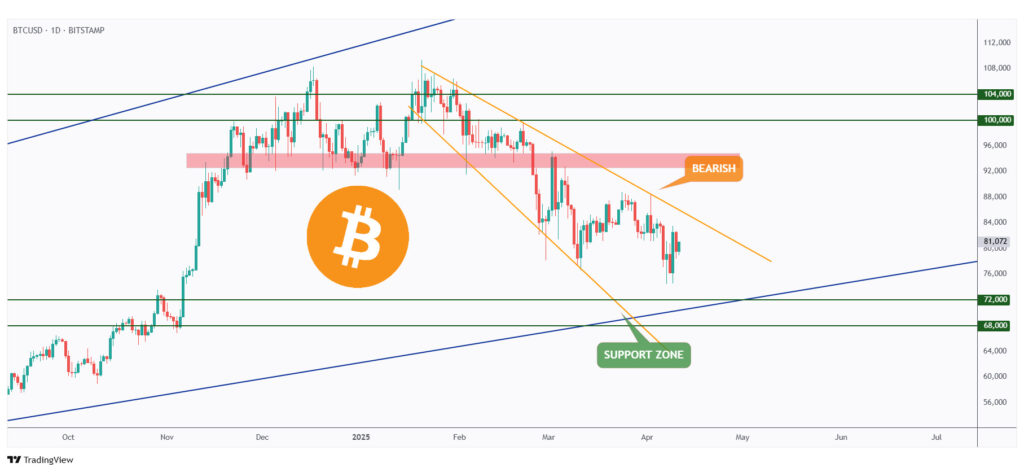
For the bulls to take control and push toward the $95,000 structure marked in red, a break above the upper orange trendline is required.
Until then, the overall momentum remains bearish, and another leg down toward the $68,000–$72,000 zone is likely.
ETH Analysis
ETH is no different from BTC — the overall trend remains bearish in both the short and long term, trading within the orange and red channels respectively.
As long as the $1,500 support holds, the bulls could take over in the short term if the upper orange trendline is broken to the upside.
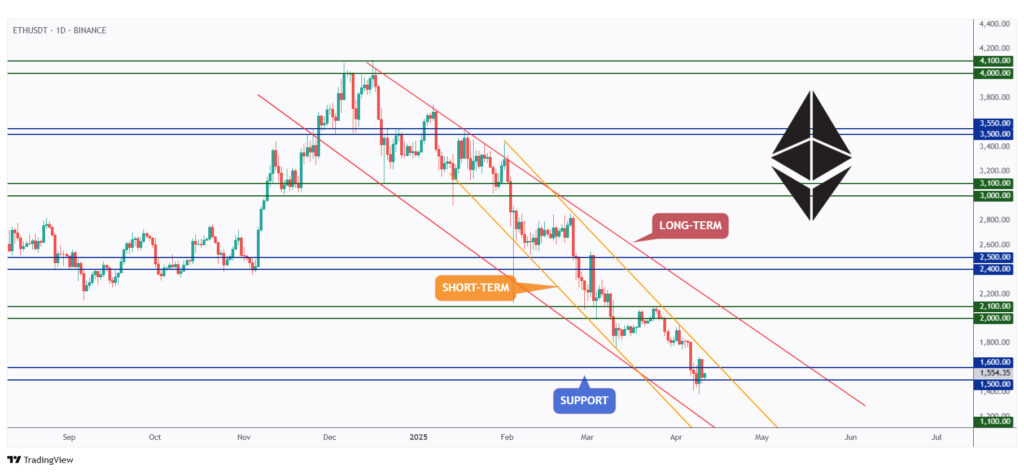
For the bulls to take over in the long term — and for the altseason to kick off, as mentioned in our latest roundup article — a break above the upper red trendline and the $2,100 resistance is required.
Quote of the week
An investor without investment objectives is like a traveler without a destination.
~ Ralph Seger
Closing Remarks
In summary, despite a bearish overall sentiment reflected in the 7-day crypto heatmap, markets are showing signs of recovery following Trump’s 90-day tariff pause, excluding China.
BTC remains within a falling wedge pattern, with a potential move toward $95,000 if it breaks above key resistance. Until then, a drop toward $68,000–$72,000 is likely.
ETH mirrors BTC’s structure, with both short- and long-term trends staying bearish unless key resistance levels at $1,500 and $2,100 are broken. With two days left for the weekly close, all eyes are on whether optimism can shift the tide.
Level up your trading game with real-time market signals, clear entry zones, and expert analysis to help you navigate every move with confidence.