Welcome to another crypto market outlook for the 31st of May!
The crypto market has been bleeding this past week, with many altcoins breaking below major daily lows. Meanwhile, ETH is holding strong above its last support. Two conflicting signals — which one will become the catalyst for the next move? Let’s find out together.
Today, we will cover the following topics:
– Market Heatmap and Fear and Greed Index
– US500 and DXY
– USDT.D, Bitcoin and Ethereum Analysis
– Quotes / Advices
– Closing Remarks
Market Heatmap and Fear and Greed Index
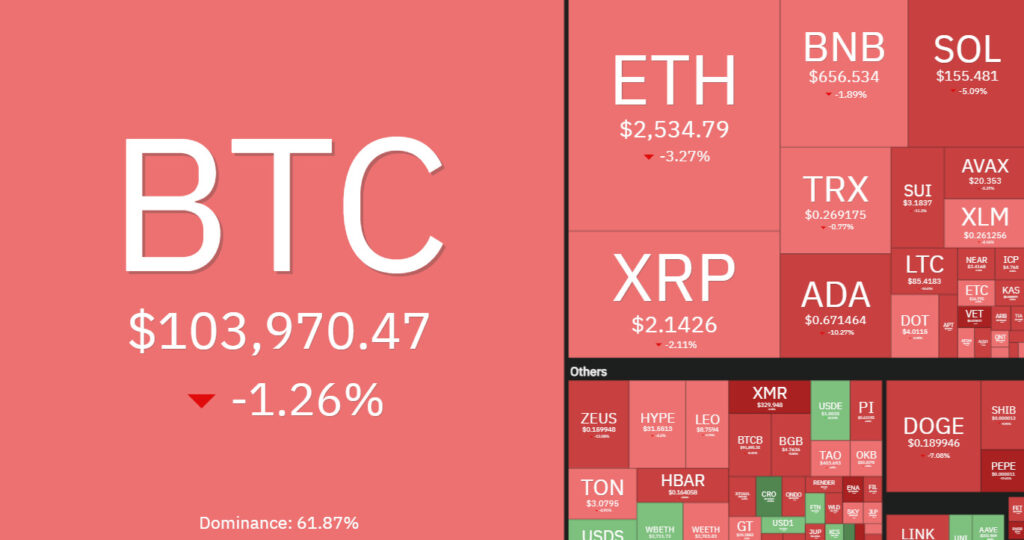
The crypto heatmap has remained red for two consecutive weeks, signaling a deep bearish correction phase, with BTC down over 1% and ETH down over 3%.
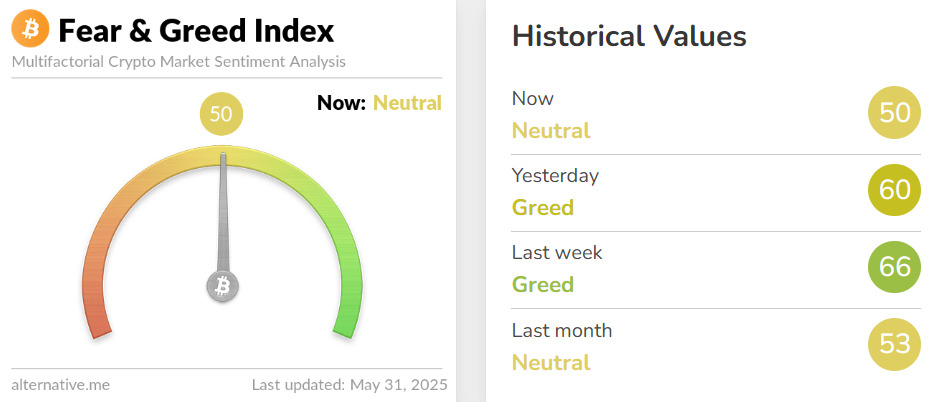
The Fear and Greed Index has shifted from Greed to Neutral this week, signaling that optimism is fading among traders.
US500 and DXY analysis
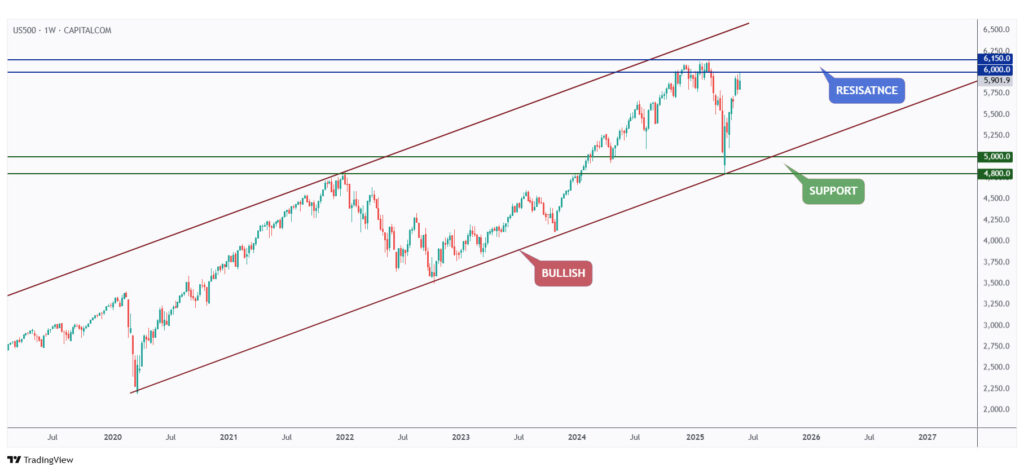
As per our last market outlook, the US500 is still hovering around the $6,000 round number, which continues to act as a resistance.
As long as this zone holds, the bears will maintain the upper hand and a correction remains highly likely.
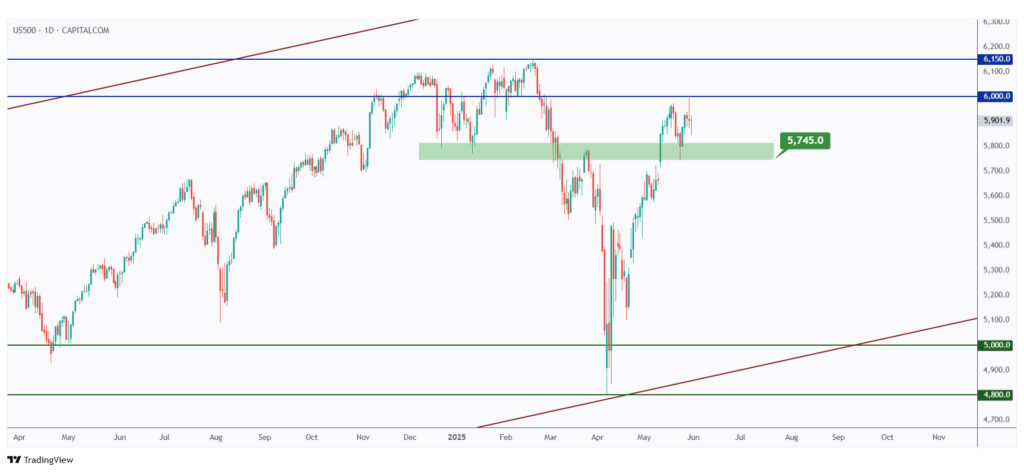
The bulls will remain in control as long as the $5,745 structure, marked in green, holds.
For a long-term bearish correction to begin, a break below $5,745 is needed.
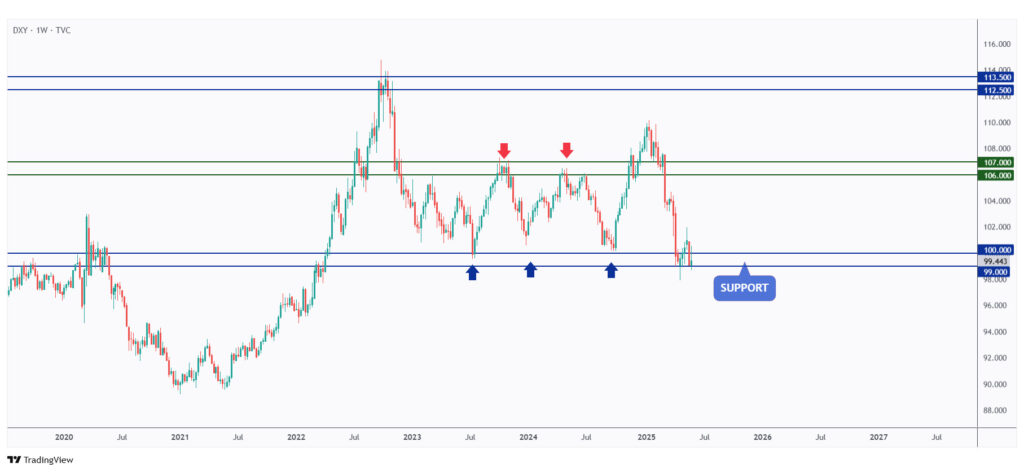
DXY is still holding strong above the $99 support level, making it difficult for the crypto market to gain momentum.
For optimism to return to the crypto market, a break below the $99 support on DXY is needed.

On the medium-term 4H timeframe, DXY has been trading within a range, forming an inverse head and shoulders pattern.
If the neckline at $100.6 is broken to the upside, it would signal a stronger DXY — which could negatively impact the crypto market.
USDT.D, Bitcoin, and Ethereum analysis
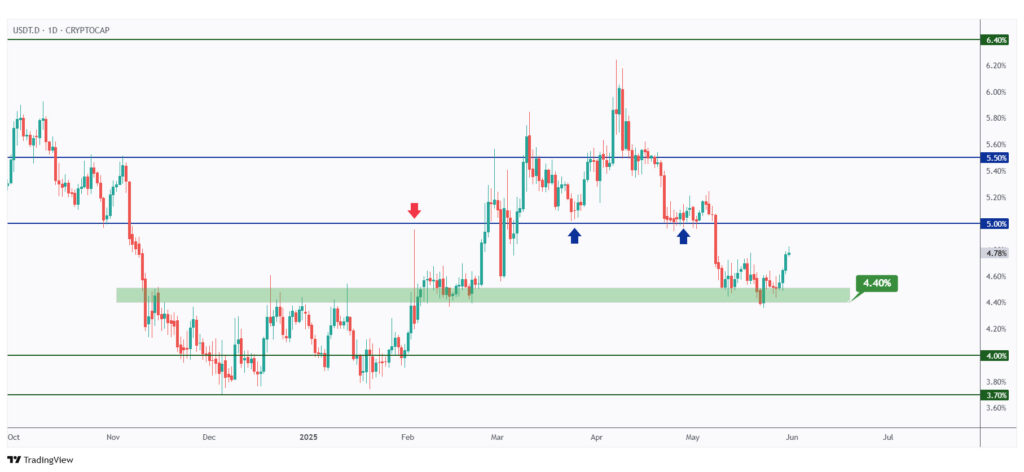
As per our latest USDT.D analysis, it rejected the 4.4% support level and moved higher, triggering a sharp bearish movement across the crypto market.
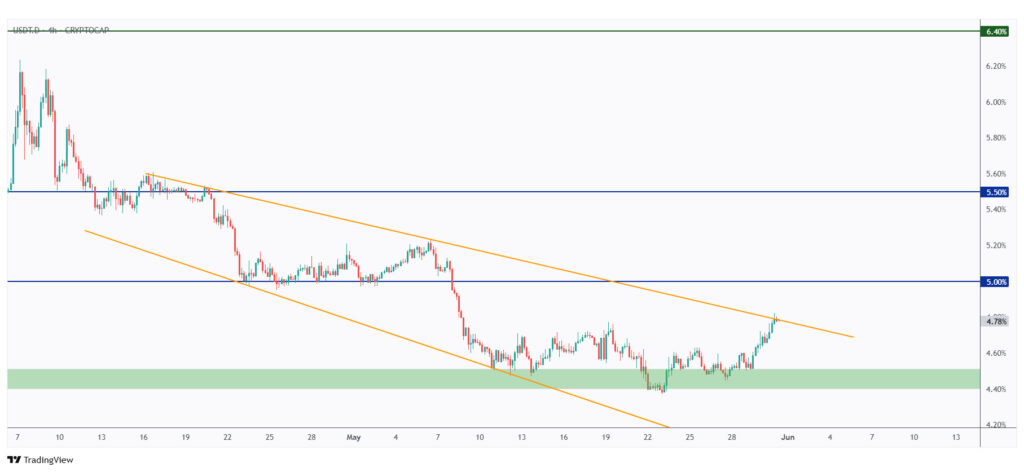
On the 4H timeframe, USDT.D is retesting the upper bound of its falling wedge pattern, marked in orange. As long as the upper orange trendline holds, a bearish move is expected for USDT.D, which would be bullish for crypto.
However, if the trendline is broken to the upside, further bullish movement toward the 5% mark would be expected.
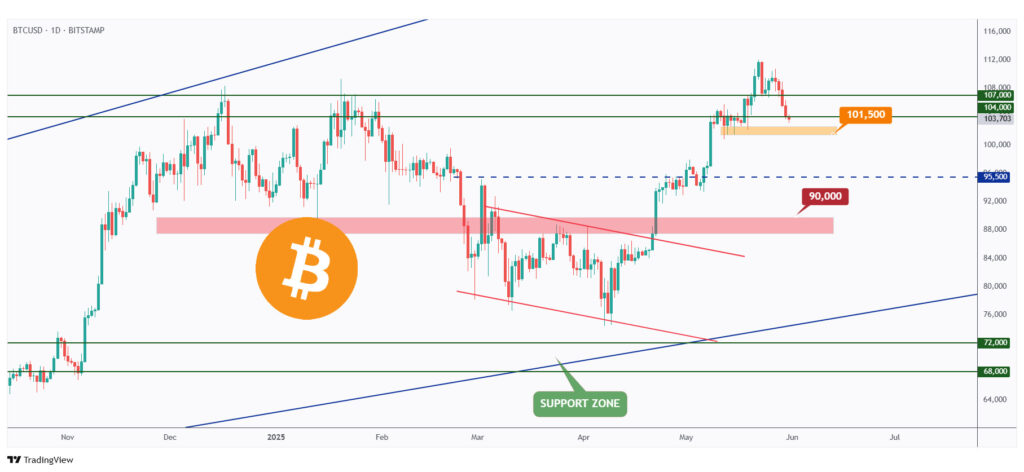
After reaching a new all-time high last week, BTC is currently retesting its previous support at $104,000.
As long as the $101,500 structure, marked in orange, holds, the overall bias remains bullish for BTC.
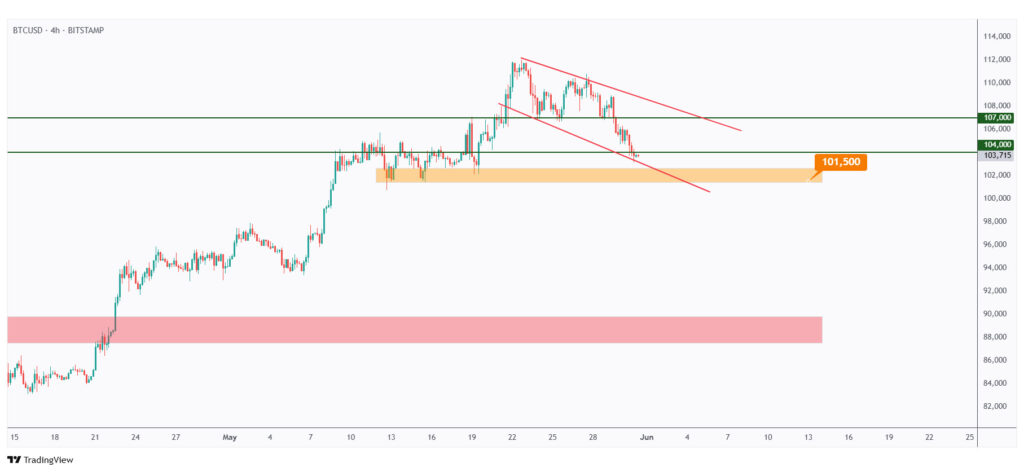
In the short term, BTC has been in a correction phase, trading within the falling channel marked in red. As it currently hovers near the lower bound of the channel, a short-term bullish movement toward the upper bound is expected.
For the bulls to regain long-term control and initiate a new bullish impulse, a break above the upper red trendline is needed.

As per our latest ETH update, it continues to reject the $2,400–$2,500 support zone.
As long as the $2,400 level holds, the bulls will maintain the upper hand.
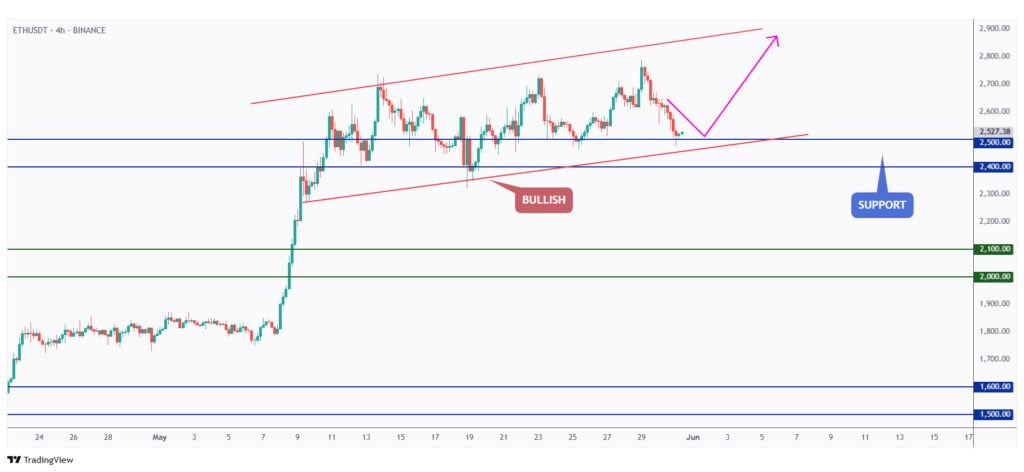
In the medium term, ETH has been hovering within a rising range, forming a rising channel.
It is currently retesting the lower bound of the channel and the $2,500 level, so we will be looking for trend-following long setups as long as the support holds.
Quotes / Advices
Discipline is the bridge between goals and accomplishment.
~ Jim Rohn
Closing Remarks
In summary, the crypto market faced continued pressure this week, with most altcoins breaking below key daily support levels, while ETH remains resilient.
The market heatmap stayed red, and sentiment shifted from Greed to Neutral. US500 is still capped by resistance at $6,000, and DXY’s strength is weighing on crypto momentum.
Meanwhile, USDT.D’s recent bounce has fueled bearish action, but BTC and ETH are both retesting critical support zones. A break in either direction could determine the next big move across the market.