
Welcome to another crypto market outlook for the 22th of November!
One week left in November, and the market is still bleeding like crazy. December is usually a bullish month, but this cycle has been so unpredictable. Will December be good to us? Let’s go over the possibilities together.
Today, we will cover the following topics:
– Market Heatmap and Fear and Greed Index
– US500 and DXY
– USDT.D, Bitcoin and Ethereum Analysis
– Quotes / Advices
– Closing Remarks
Market Heatmap and Fear and Greed Index
The 7-day crypto heatmap is still signaling all red, with both BTC and ETH down by over 11%, dragging altcoins down with them.

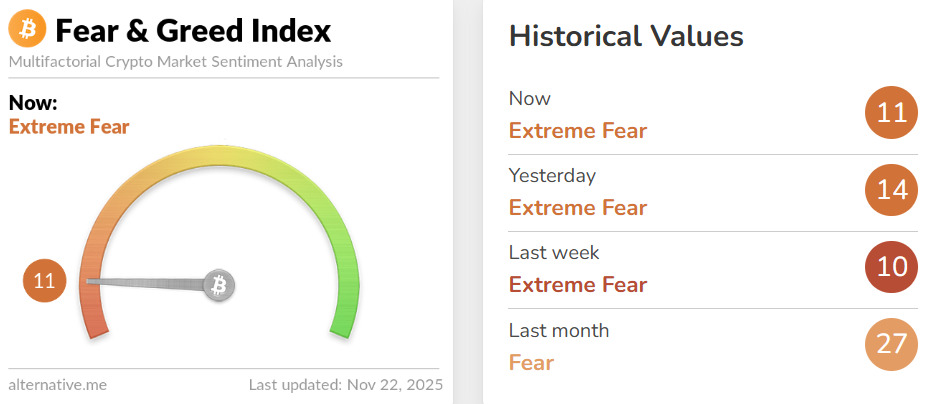
The Fear and Greed Index is still signaling “Extreme Fear,” with the meter dropping as low as 10, the lowest level in months.
US500 and DXY analysis
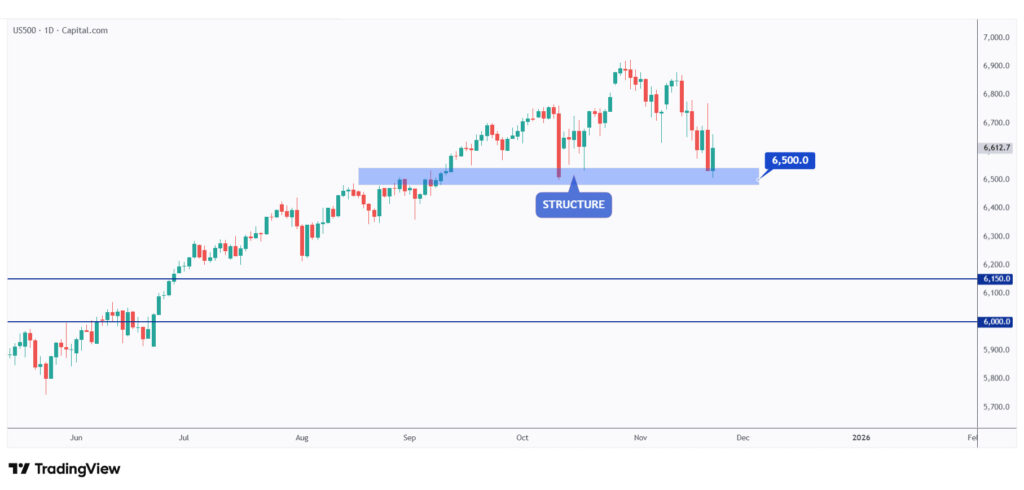
As mentioned in our last market outlook, US500 is still standing strong above the weekly structure marked in red at $6,500.
As long as the $6,500 level holds, the bulls still have the opportunity to take over again.

US500 is now oversold, trading around the lower bound of its falling broadening wedge pattern marked in red.
As long as the intersection of the structure and the lower red trendline holds, the upper hand will remain with the bulls.
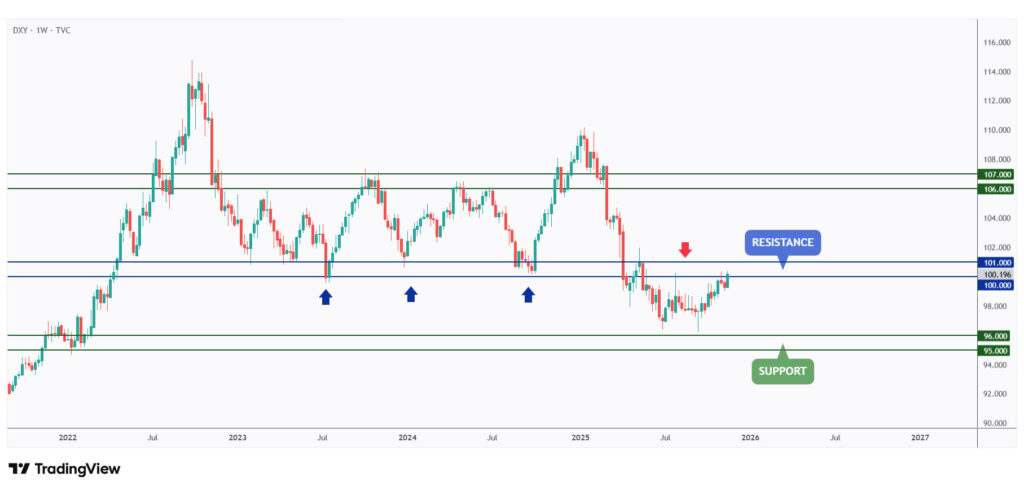
DXY is still holding strong below the $100 – $101 resistance zone, which remains bearish for the USD.
If and only if the $101 level is broken upward, DXY will take back its crown.

For the bears to take over short-term, a break below the $100 mark is needed.
Meanwhile, the bulls will remain in control in the short term.
USDT.D, Bitcoin, and Ethereum analysis

As per our latest USDT.D update, it is now rejecting a weekly resistance zone between 6.35% and 6.75%.
As long as this resistance holds, we will be expecting the bears to take over, which would be extremely bullish for crypto.

For the next bullish leg to start in crypto, a break below the 6.35% support on USDT.D is needed.
Meanwhile, more pain would be expected.
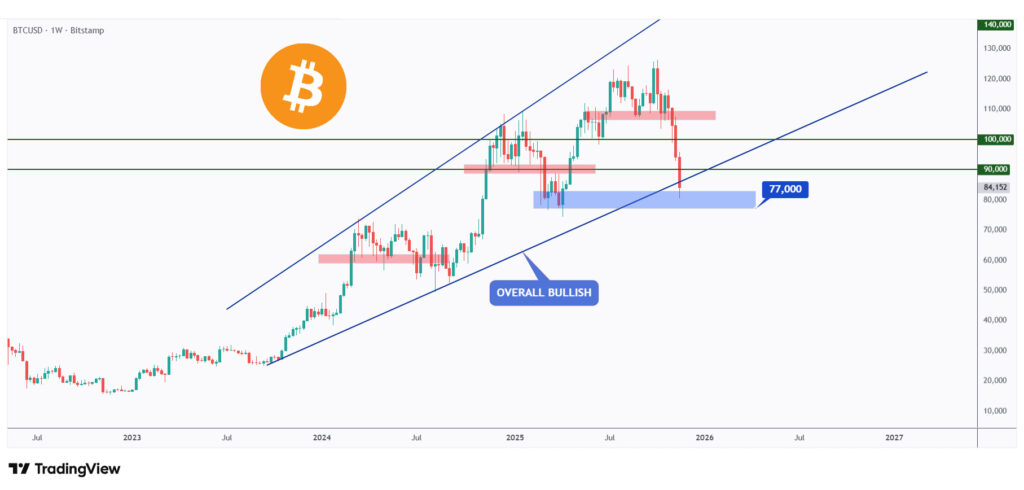
As per our latest BTC analysis, it is now retesting a major weekly low at $77,000.
As long as the $77,000 low holds, the bulls can still kick in for a correction toward the $100,000 mark.
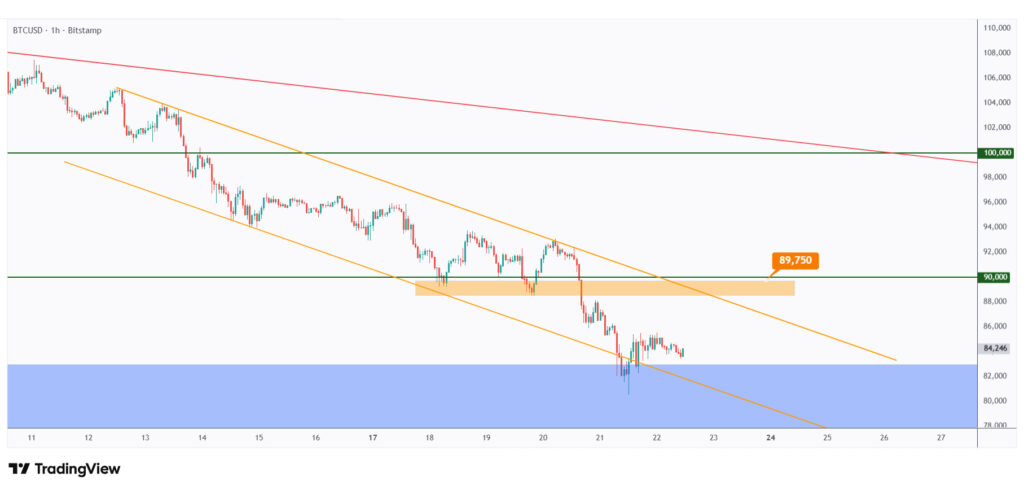
For the bulls to shift the momentum in their favor, a break above the last major high at $89,750 is needed.
Meanwhile, a move lower toward the $80,000 support level is still possible.
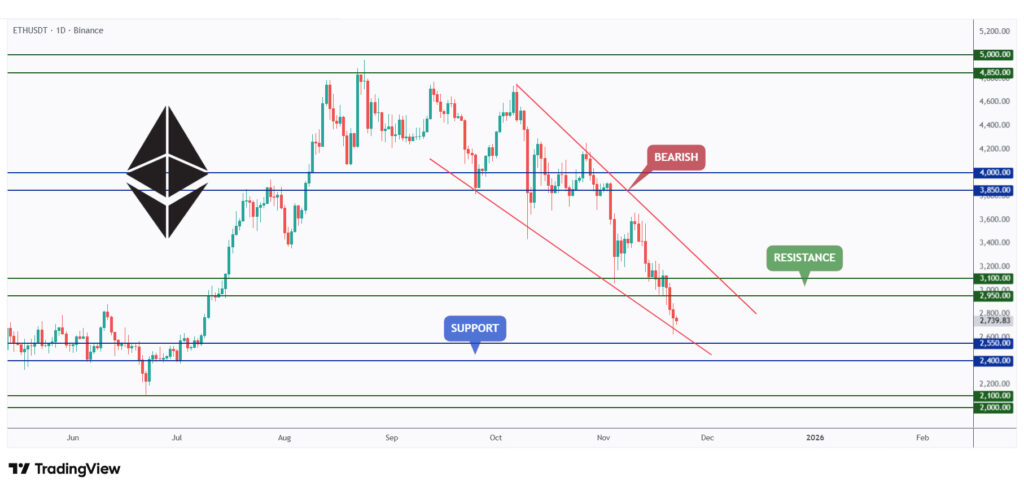
As per our latest ETH update, it is still bearish, trading within the falling wedge pattern marked in red.
However, it is currently retesting the lower bound of the wedge, which intersects with the $2,500 support level and the round number.

For the bulls to take over in the short term and push toward the $3,500 resistance, a break above the last major high in orange at $2,822 is needed.
Then, for the bulls to take over in the long term, a break above the $3,500 mark is required.
Quotes / Advices
Every trader has strengths and weaknesses. Some are great forecasters, others are good at execution. Learn what your strengths are and build on them.
~ Michael Marcus
Closing Remarks
In summary, The crypto market remains under heavy pressure, with fear dominating sentiment and major assets like BTC and ETH continuing to print new lows.
US500 is hovering around strong support, DXY is capped below major resistance, and USDT.D is rejecting a key weekly zone, all conditions that could support a potential relief rally if confirmed.
BTC and ETH are both retesting important support levels, and bullish scenarios remain possible as long as these zones hold. However, without key breaks on higher timeframes, downside risk remains.
December is historically bullish, but this cycle demands patience, discipline, and clear technical confirmation before positioning.