

Welcome to another crypto market outlook for the 1st of November!
The crypto market is slowly recovering this week as we step into a new month. After a bloody October, traders are feeling optimistic with the start of November, anticipating the next big bullish wave before the year ends. Will crypto treat us well this month? Let’s explore the possibilities together.
Today, we will cover the following topics:
– Market Heatmap and Fear and Greed Index
– US500 and DXY
– USDT.D, Bitcoin and Ethereum Analysis
– Quotes / Advices
– Closing Remarks
Market Heatmap and Fear and Greed Index
The 7-day crypto heatmap is still showing a mixture of red and green as the market sets up for the next wave. There’s no clear direction this week, as most crypto assets, including BTC and ETH, are closing the week around breakeven, which usually signals an accumulation phase.
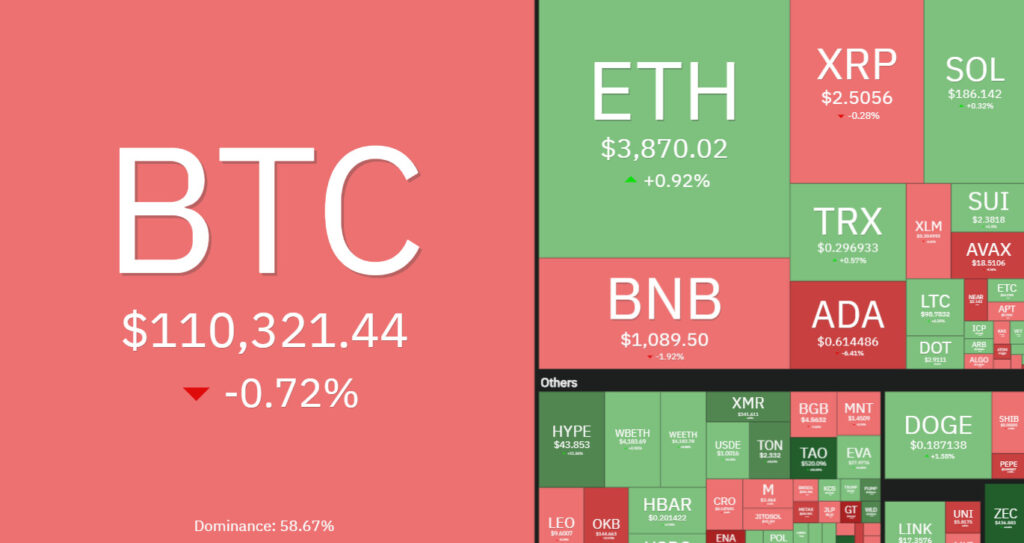
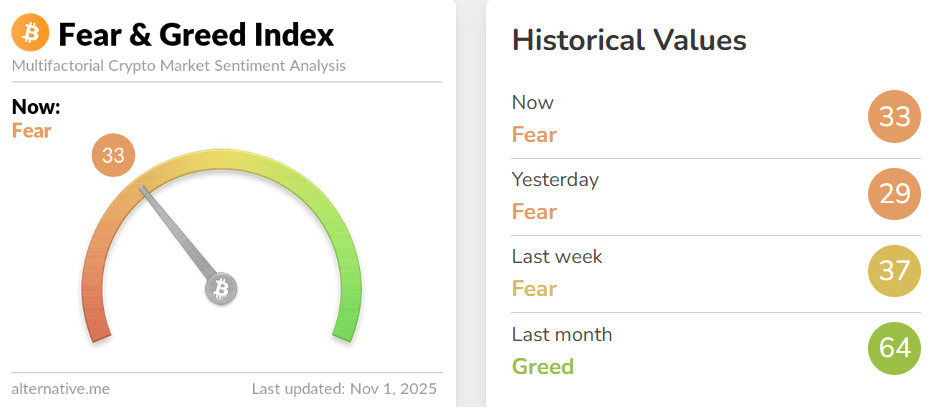
The Fear and Greed Index has shifted from Extreme Fear to Fear this week, indicating that traders are becoming less fearful and more optimistic.
US500 and DXY analysis
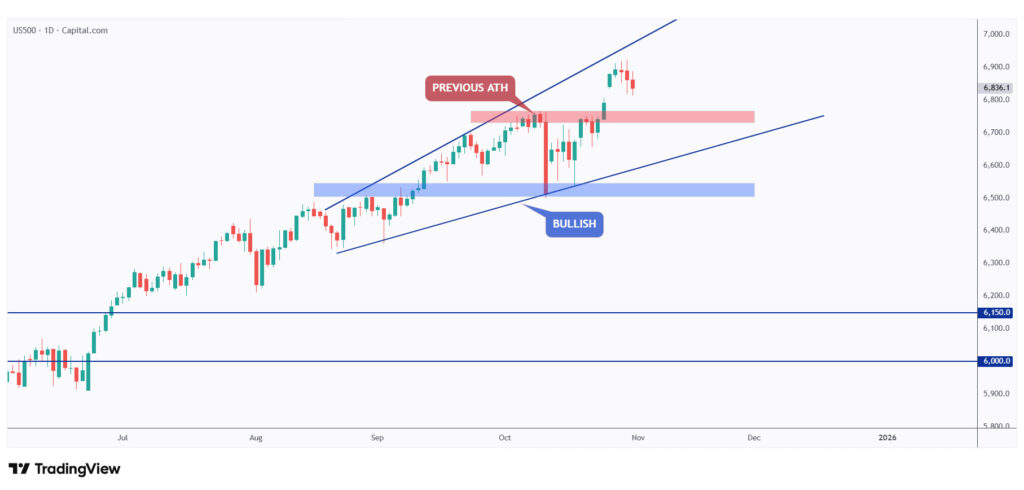
US500 has been overall bullish, trading within the rising broadening wedge pattern marked in blue.
This week, US500 reached a new all-time high and is now approaching the upper boundary of its wedge.

In the short term, US500 has been in a correction phase, trading within a falling channel marked in red.
As long as US500 remains above its previous all-time high at $6,750, the overall sentiment will stay bullish, especially once it breaks above the falling channel.

DXY is retesting the upper boundary of its range this week, around the $100 round number.
As long as $100 holds as resistance, we can expect a weaker USD in the upcoming week.

As DXY approaches the upper boundary of its rising channel and the $100 round number, we’ll be watching for bearish reversal setups on lower timeframes to confirm the beginning of a bearish correction phase.
USDT.D, Bitcoin, and Ethereum analysis

As per our latest USDT.D update, it is still consolidating around the upper boundary of its range, near the 5% resistance and round number.
As long as the 5.15% resistance level holds, the overall bias remains bearish for USDT.D, which is bullish for crypto.
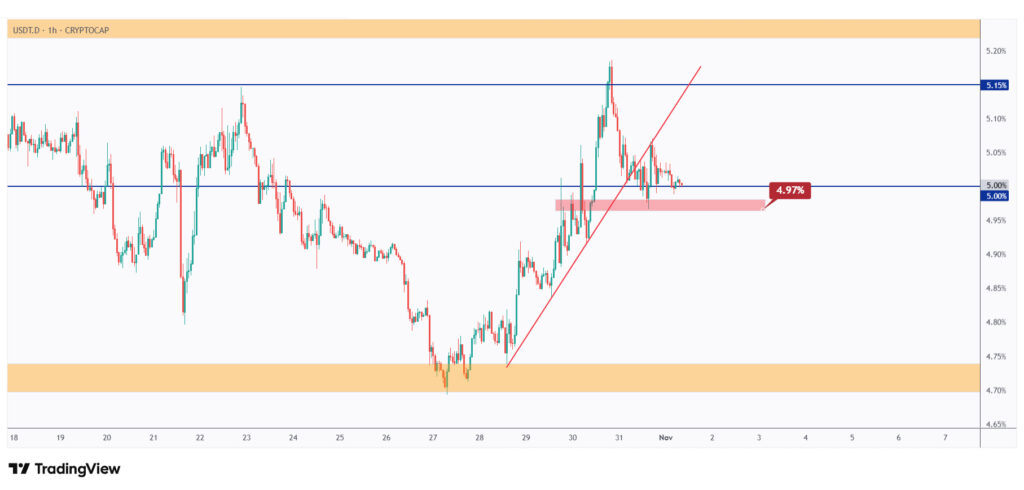
For the bears to take control of USDT.D and trigger the next major move toward the lower boundary of its range at 4.7%, a break below the last low marked in red at 4.97% is required.
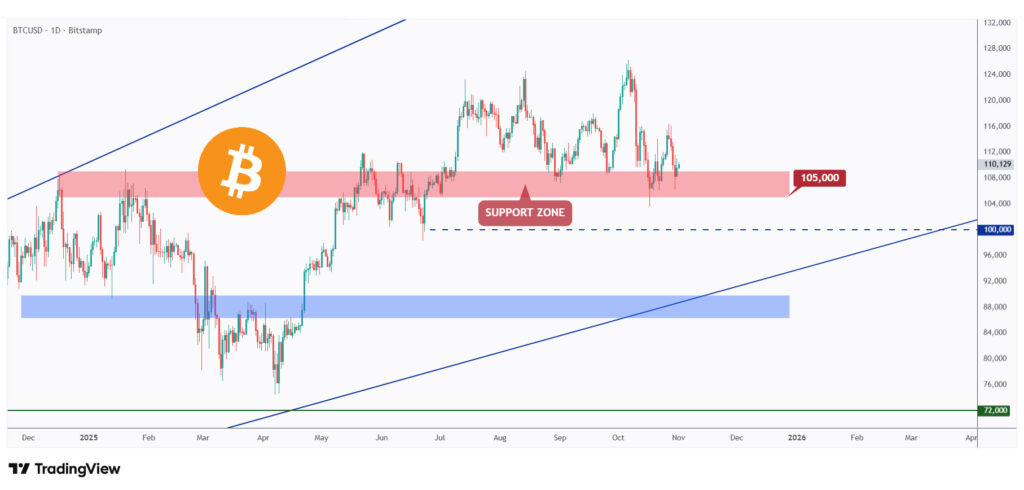
As per our latest BTC analysis, it is still battling the $105,000 level, a crucial support maintaining the overall bullish trend.
Even if BTC breaks below $105,000, the $100,000 round number is expected to provide strong support and keep the price afloat.
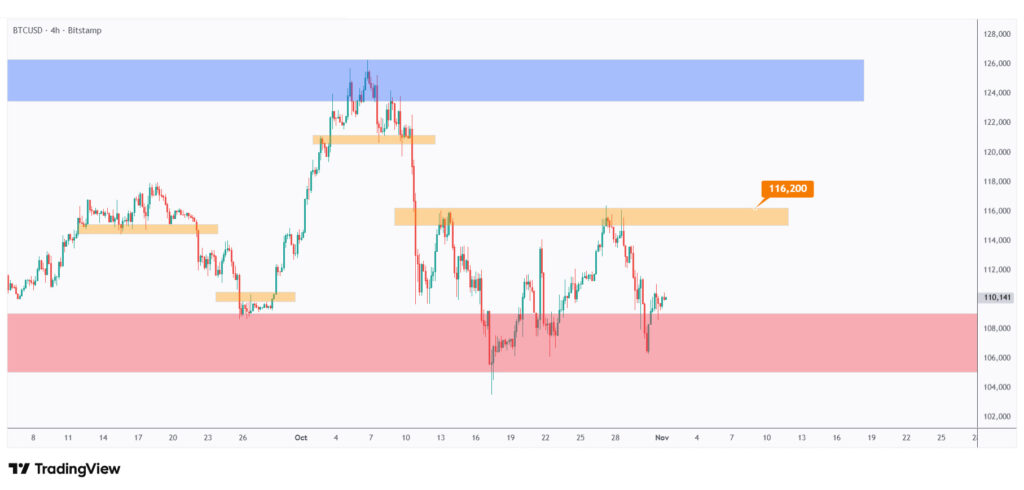
As long as the support holds, we’ll be looking for short-term long opportunities targeting the $116,000 structure.
For the bulls to maintain control in the medium term, a break above $116,200 is required.
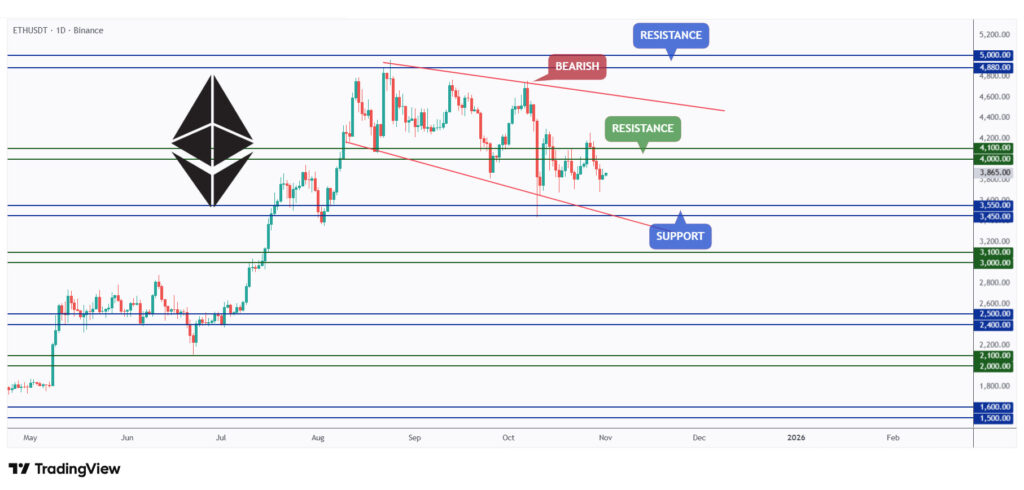
As per our latest ETH update, it is still hovering within a wide range below the $4,100 resistance level.
For the bulls to finally take full control and initiate the next major upward move we’ve been anticipating, a daily candle close above $4,100 is needed.
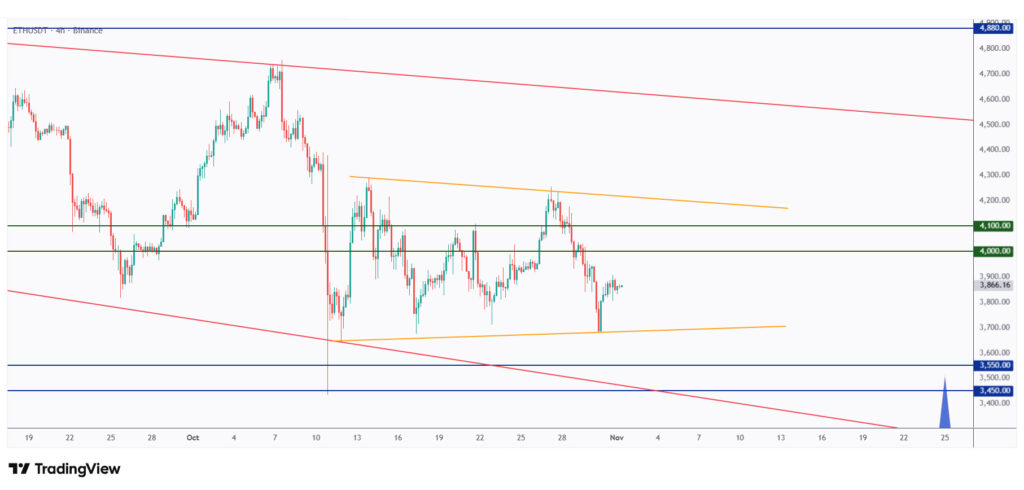
In the medium term, the large range ETH has been trading within has formed a symmetrical triangle marked in orange.
As long as the lower orange trendline holds, we can expect a short-term move toward the $4,000 resistance level.
Quotes / Advices
You never know what kind of setup the market will present to you. Your objective should be to find an opportunity where risk-reward ratio is best.
~ Jaymin Shah
Closing Remarks
In summary, as we enter November, the crypto market shows early signs of recovery following a difficult October. While the overall direction remains unclear, sentiment is improving as the Fear and Greed Index shifts from Extreme Fear to Fear, hinting at renewed optimism.
Traditional markets remain supportive, with US500 holding its bullish structure despite a short-term correction, and DXY facing resistance around the $100 level, suggesting potential weakness in the USD ahead.
USDT.D continues to consolidate near resistance, a bearish sign for dominance and bullish for the overall market.
BTC remains steady above key support at $105,000, with potential for upside toward $116,000 if buyers sustain momentum. ETH also trades within a tightening triangle, with a breakout above $4,100 likely to confirm the next bullish leg.