
Welcome to our latest crypto market outlook for July 8th!
July and August are typically bullish months. However, this cycle has been heavily influenced by fundamentals, preventing the price from following the projections of previous cycles. Will the fundamentals shift in favor of the bulls? I believe so — and here are the 5 tokens on my watchlist this week: QTUM, TON, ETHFI, LDO, and VANA.
Today, we will cover the following topics:
– BTC Analysis
– 5 Altcoins Analysis
– Quotes / Advices
– Closing Remarks
BTC analysis
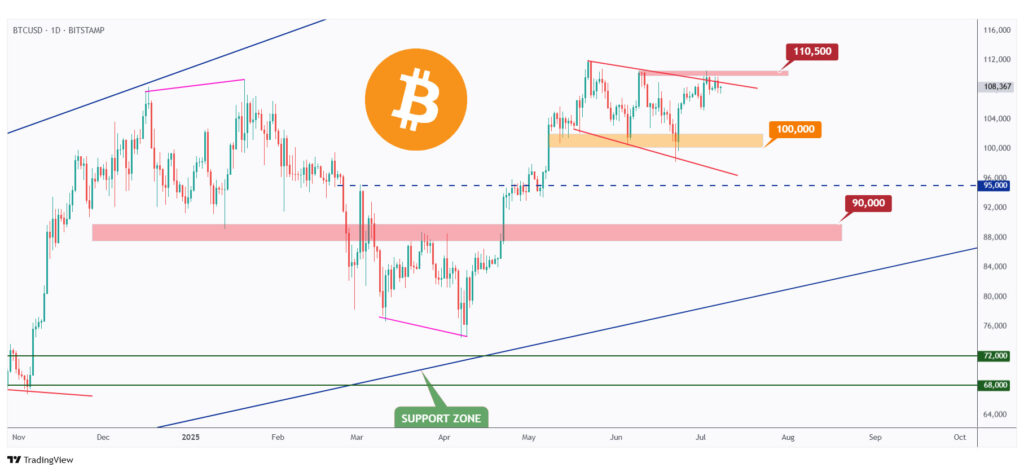
As per our last roundup article, BTC has been setting up for a major continuation pattern in the form of a falling channel marked in red.
For the bulls to finally take over and confirm the continuation, a daily candle close above the $110,500 mark is needed.
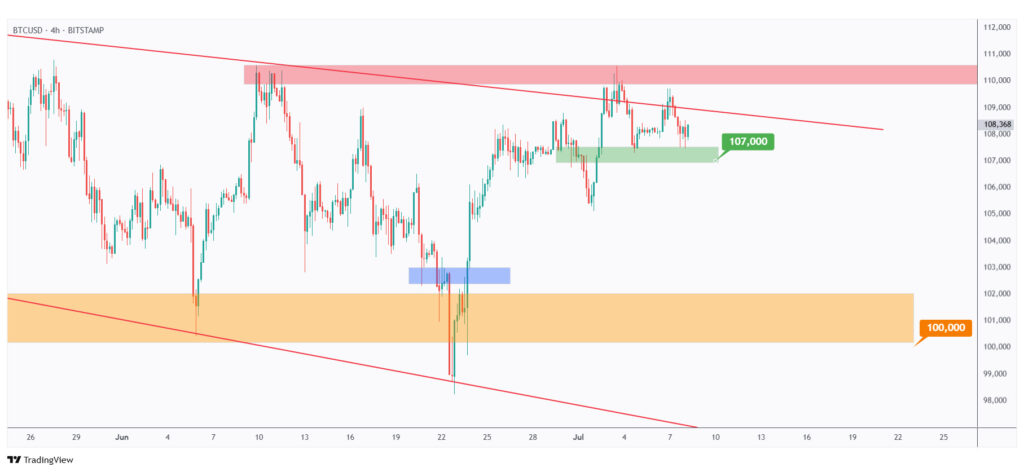
In parallel, the bears can still take over in the short term for one more correction phase, which would be confirmed by a break below the last low marked in green at $107,000.
5 Altcoins Analysis
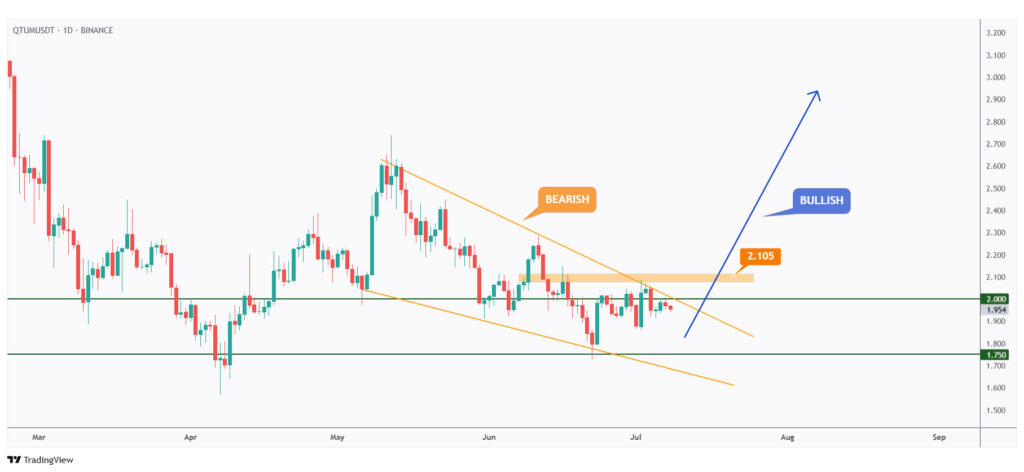
QTUM has been holding strong around the $1.75–$2 support zone.
The last time it rejected this area, it rallied by over 150%.
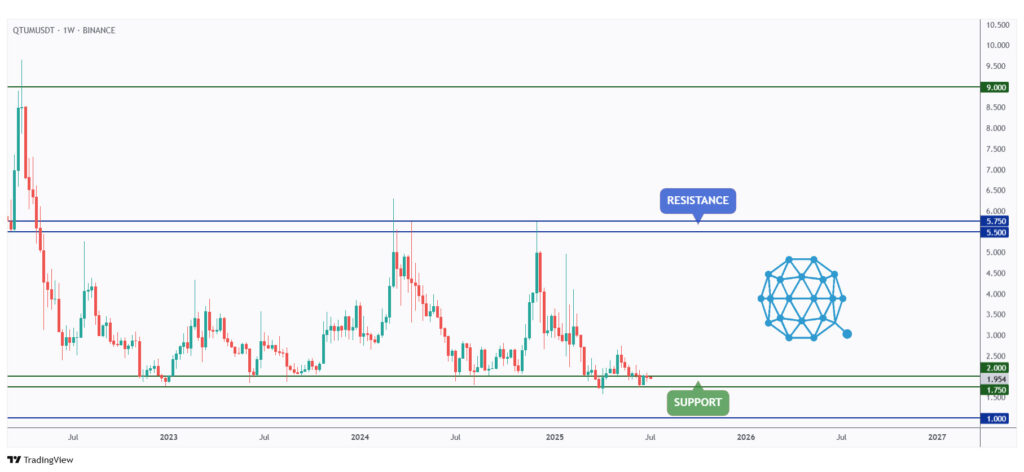
For the bulls to finally kick in and push towards the $3 round number, a break above the falling wedge and the last major high at $2.1 is needed.
Meanwhile, QTUM would remain bearish in the medium term and could still trade lower, especially if the $1.75 support is broken.
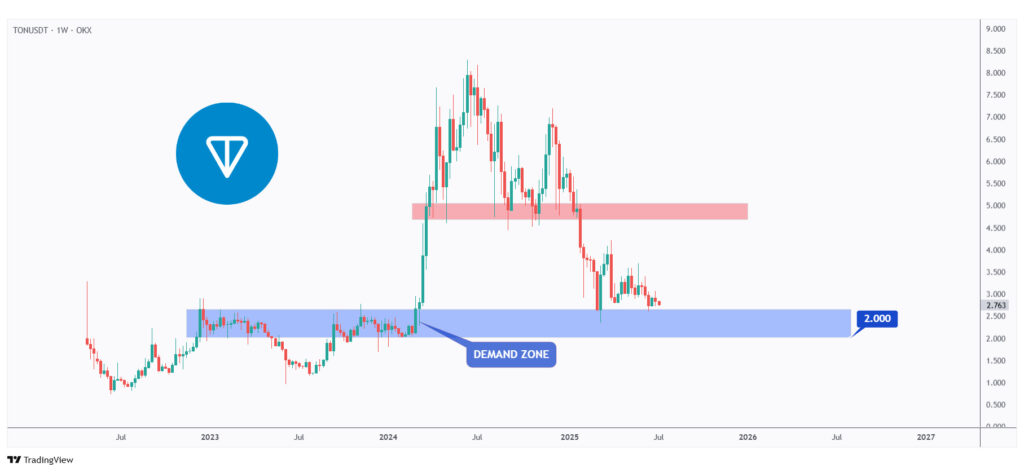
As per our last market overview, TON is still rejecting the $2 round number and the demand zone marked in blue.
TON’s fundamentals also look very bullish, and we believe this will soon be reflected in the price.
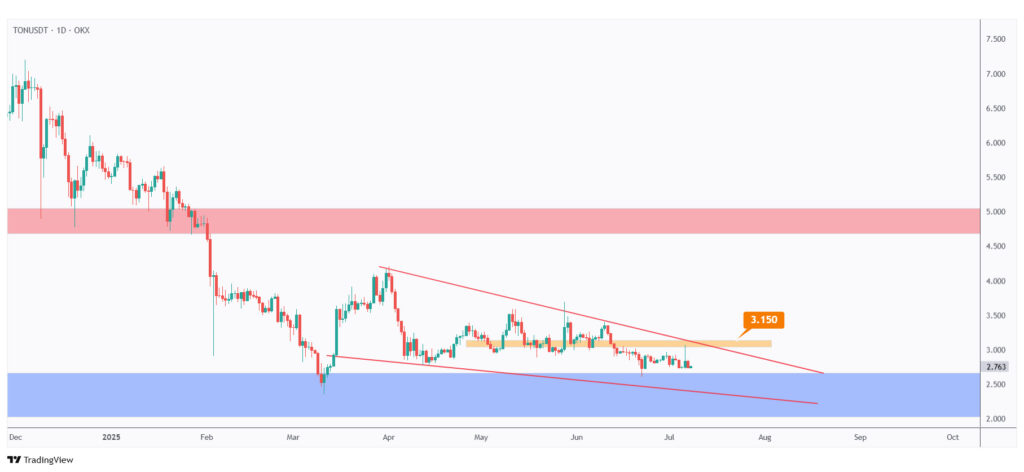
The bears will remain in control, trading within the falling wedge pattern marked in red, unless the bulls regain momentum by breaking above the $3.15 level.
Once the bulls take over, an explosive move toward the $5 round number and resistance zone would be expected.
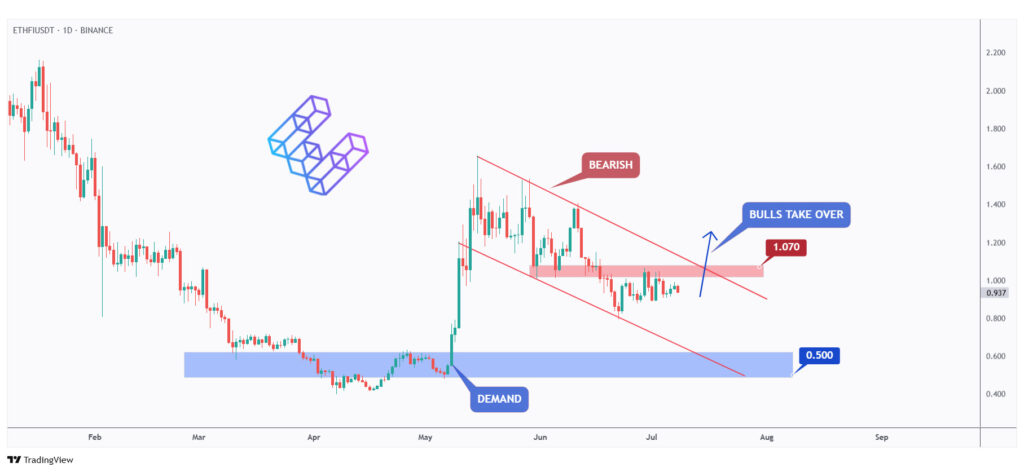
As per our previous altcoins article, ETHFI is still trading within the red channel correction phase.
As long as the bears remain in control, a further decline toward the $0.5 round number and demand zone is expected.
In parallel, for the bulls to take over and initiate the next impulsive move upward, a break above the last major high at $1.07 is required.
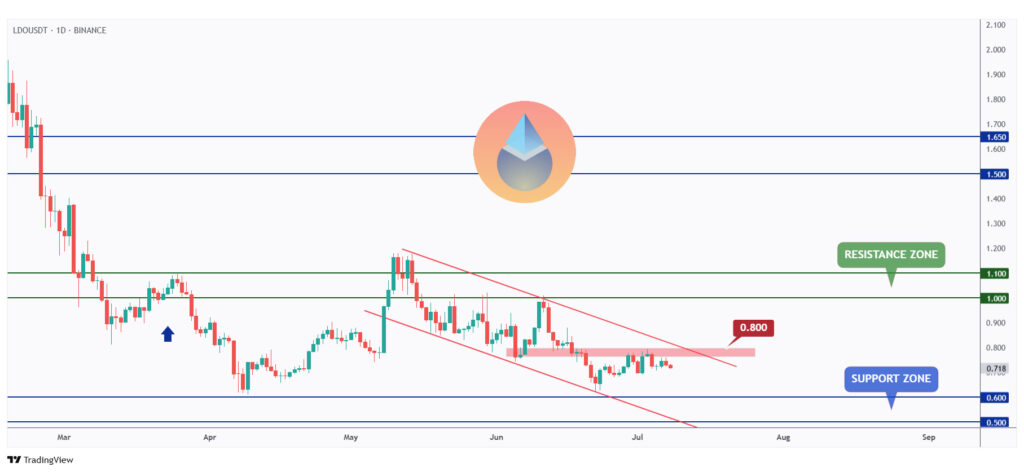
After rejecting the $1 round number, LDO has been bearish, trading within the falling channel marked in red.
Currently, LDO is approaching a weekly support zone between $0.5 and $0.6, where we will be looking for both short-term and long-term long opportunities.
For the bulls to take over and push back toward the $1 resistance level, a break above the last high at $0.8 is needed.
Last but not least, VANA has been overall bearish, trading within the large wedge pattern marked in red.
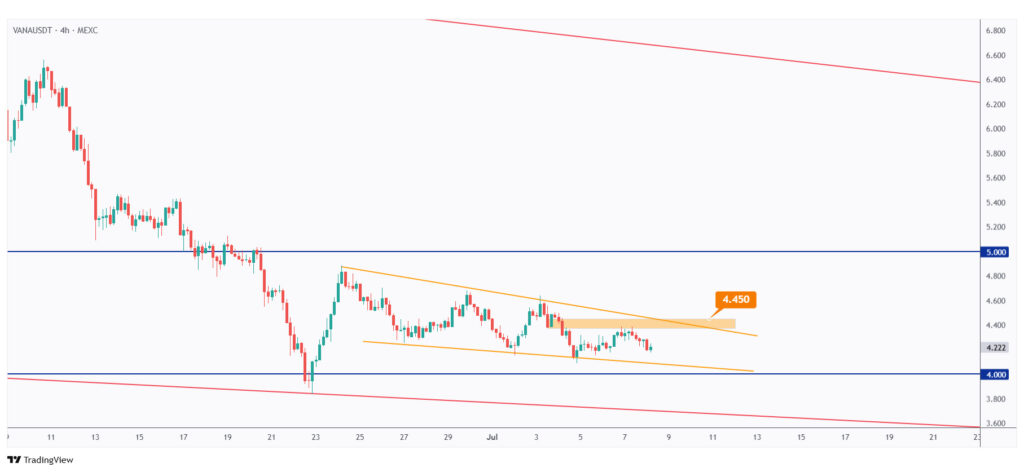
However, it is currently rejecting the lower bound of the wedge and the support at $4.
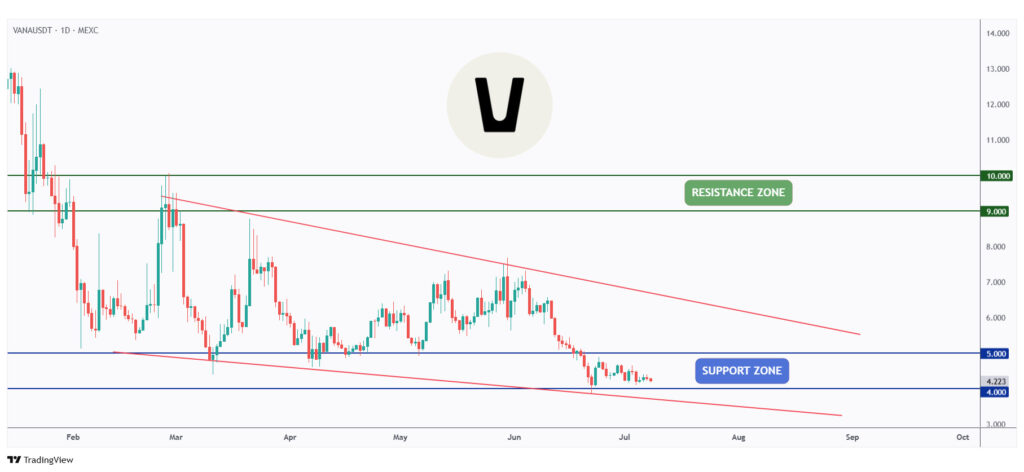
For the bulls to take control and start the next correction phase within the daily wedge pattern, a break above the last 4H high at $4.45 is needed.
Meanwhile, VANA can still trade lower and potentially form new lows.
Quotes / Advices
An investor without investment objectives is like a traveler without a destination.
~ Ralph Seger
Closing Remarks
In summary, BTC is forming a continuation setup, with $110,500 as the breakout level for bulls and $107,000 as key support.
We also highlighted five altcoins:
QTUM is holding the $1.75–$2 support zone. A break above $2.1 could trigger a push toward $3.
TON is rejecting the $2 demand zone. A breakout above $3.15 may lead to an explosive move toward $5.
ETHFI is still in a correction. Bulls need to break above $1.07, or it may dip to the $0.5 demand zone.
LDO is approaching a strong weekly support at $0.5–$0.6. A break above $0.8 could revive bullish momentum.
VANA is reacting to the $4 support. A push above $4.45 could start a short-term correction; otherwise, lower lows may follow.