

Welcome to another crypto market outlook for the 25th of May!
After being bullish for almost three weeks, the crypto market has entered a correction phase this week. But don’t worry — nothing moves straight up. It’s normal to experience such corrections during a bullish cycle. The question is: how much lower can we go before the bulls step in again? Let’s find out together.
Today, we will cover the following topics:
– Market Heatmap and Fear and Greed Index
– US500 and DXY
– USDT.D, Bitcoin and Ethereum Analysis
– Quotes / Advices
– Closing Remarks
Market Heatmap and Fear and Greed Index
The crypto heatmap has shifted from green to red this week due to sharp correction movements across altcoins. BTC remained relatively stable, dipping by only 0.56%.

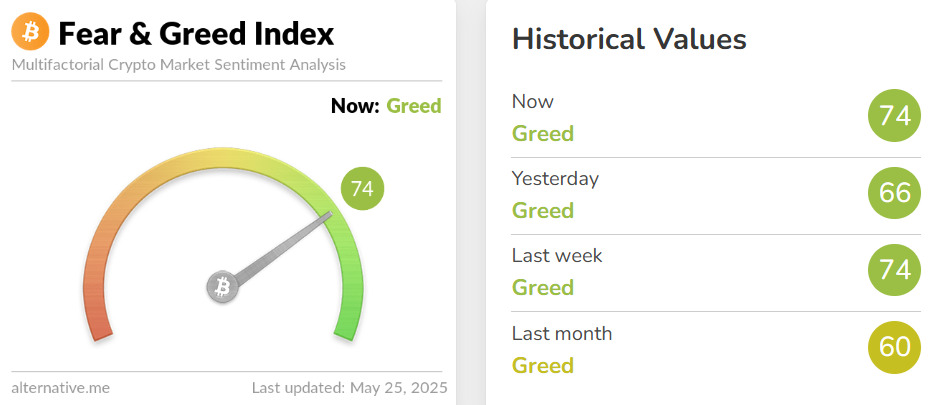
The Fear and Greed Index is still signaling greed despite this week’s dip, indicating that optimism persists among traders.
US500 and DXY analysis

As per our last market outlook, the US500 is rejecting the $6,000 level and all-time high (ATH) zone.
For the bulls to take control from a macro perspective and signal a massive bullish wave across international markets, a break above $6,150 is needed.
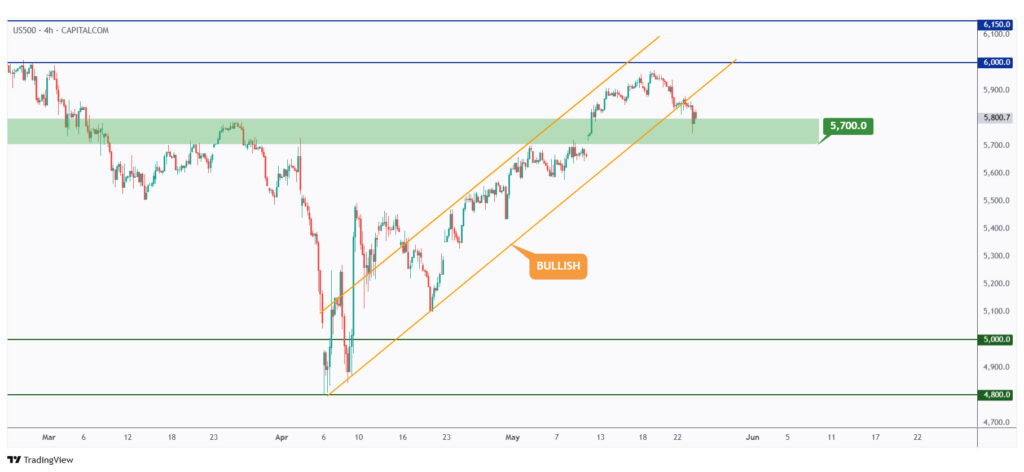
The bullish channel marked in orange has been broken to the downside, signaling a potential bearish correction ahead.
For this correction to be confirmed, a break below the $5,700 structure marked in green is needed. Meanwhile, the US500 still has room to push higher from the current level.
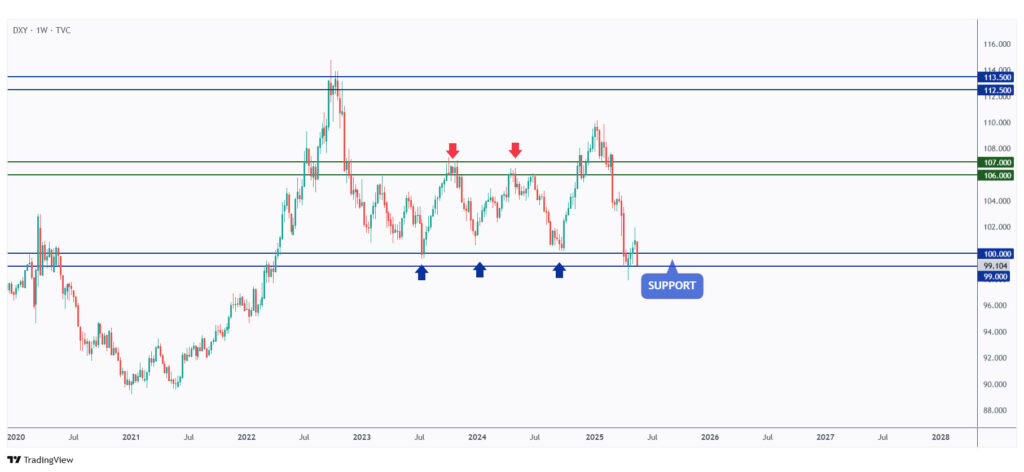
DXY is still hovering within a support zone, which will remain valid as long as the $99 level holds.
If the $99 support is broken to the downside, further decline toward the $95 level would be expected.

In the medium term, DXY has been bearish, trading within the falling channel marked in orange.
For the bulls to take over, a break above the last major high at $100 is needed.
USDT.D, Bitcoin, and Ethereum analysis

As per our latest USDT.D update, it rejected the 4.40% support level and has been trading higher since, which has been bearish for the crypto market.
If the 4.40% level is broken to the downside, a bullish trend would be expected across the crypto market.

If the last high at 4.63% is broken to the upside, a deeper bearish correction phase in the crypto market would be expected.

BTC made a new all-time high this week — congrats, HODLers!
It’s currently in a correction phase, retesting the previous all-time high zone between $104,000 and $107,000. As long as this zone holds, a new major bullish wave is expected.

The medium-term trend has been overall bullish, with BTC trading within the rising channel marked in orange.
As long as the lower orange trendline and the $104,000 level hold, a new bullish wave is expected to begin soon, targeting the $115,000 mark.

As per our last roundup article, ETH is retesting a major support zone between $2,400 and $2,500.
As long as this zone holds, a bullish continuation toward the $3,000 round number and resistance level would be expected.

For the bulls to take over and ignite the next bullish wave, a break above the last major high at $2,545 is needed.
Meanwhile, as long as ETH continues trading within the falling channel marked in red, further bearish movement toward the $2,400 level would be expected.
Quotes / Advices
Sheer will and determination is no substitute for something that actually works.
~ Jason Klatt
Closing Remarks
In summary, while altcoins experienced sharp pullbacks, Bitcoin remained relatively stable, and the Fear and Greed Index still reflects market optimism.
The US500 faces potential resistance near its ATH, with a key breakout above $6,150 needed to confirm a bullish macro shift. DXY continues to hover at critical support, with a break below $99 likely triggering further decline.
USDT.D is climbing, hinting at continued bearish pressure unless it reverses below 4.40%. BTC is retesting the $104,000–$107,000 zone, and as long as this structure holds, a bullish continuation toward $115,000 is expected.
ETH must break $2,545 to resume its bullish trend; otherwise, further downside toward $2,400 remains on the table.