

Welcome to our latest crypto market outlook for December 11th!
Alt season isn’t over yet, and this one might last longer than you expect. Which altcoins are you keeping an eye on? Here are my picks for this week: NEO, APT, COMP, OP, and SKL.
Today, we will cover the following topics:
– USDT.D and BTC Analysis
– 5 Altcoins Analysis
– Quotes / Advices
– Closing Remarks
USDT.D and BTC analysis
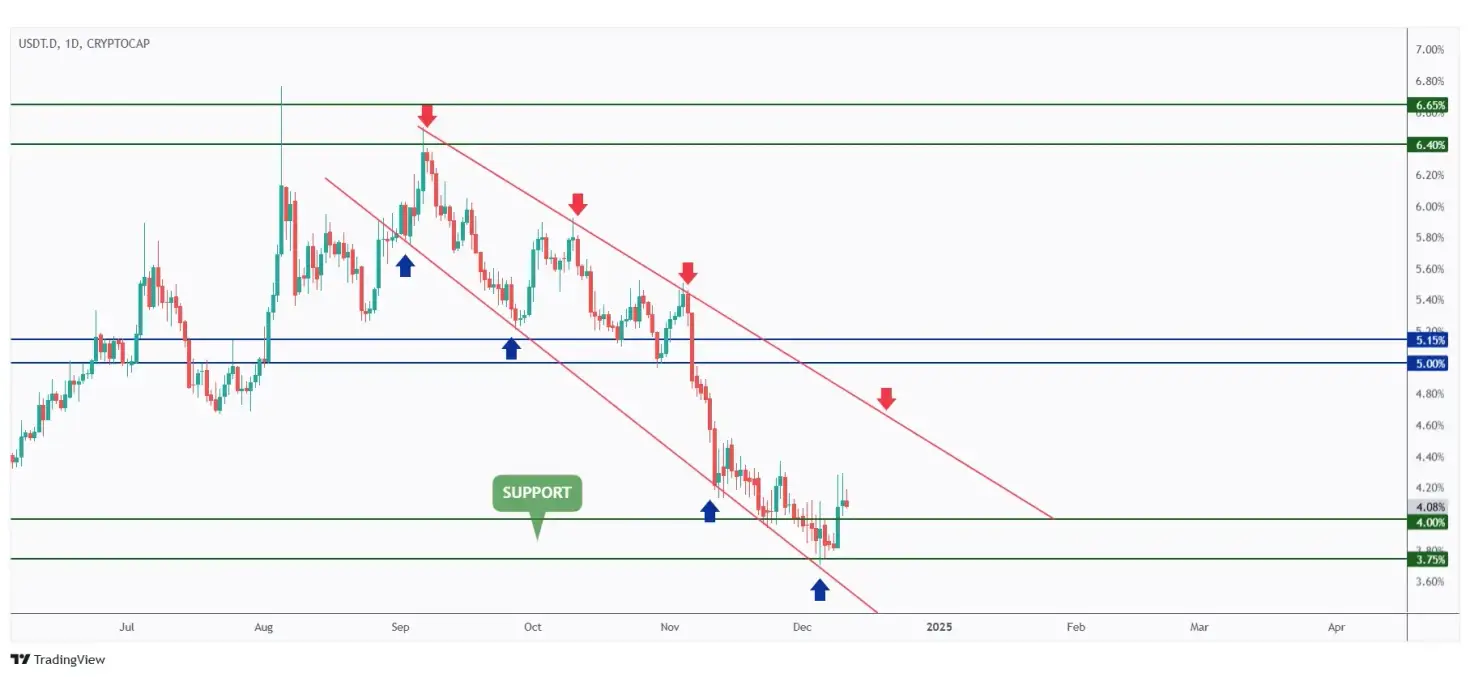
USDT.D remains consistent this week, hovering within the 3.75%–4% support zone, as highlighted in our latest market outlook.
As long as this support level holds, a bullish correction for USDT.D is expected, which would likely result in bearish sentiment for the cryptocurrency market.
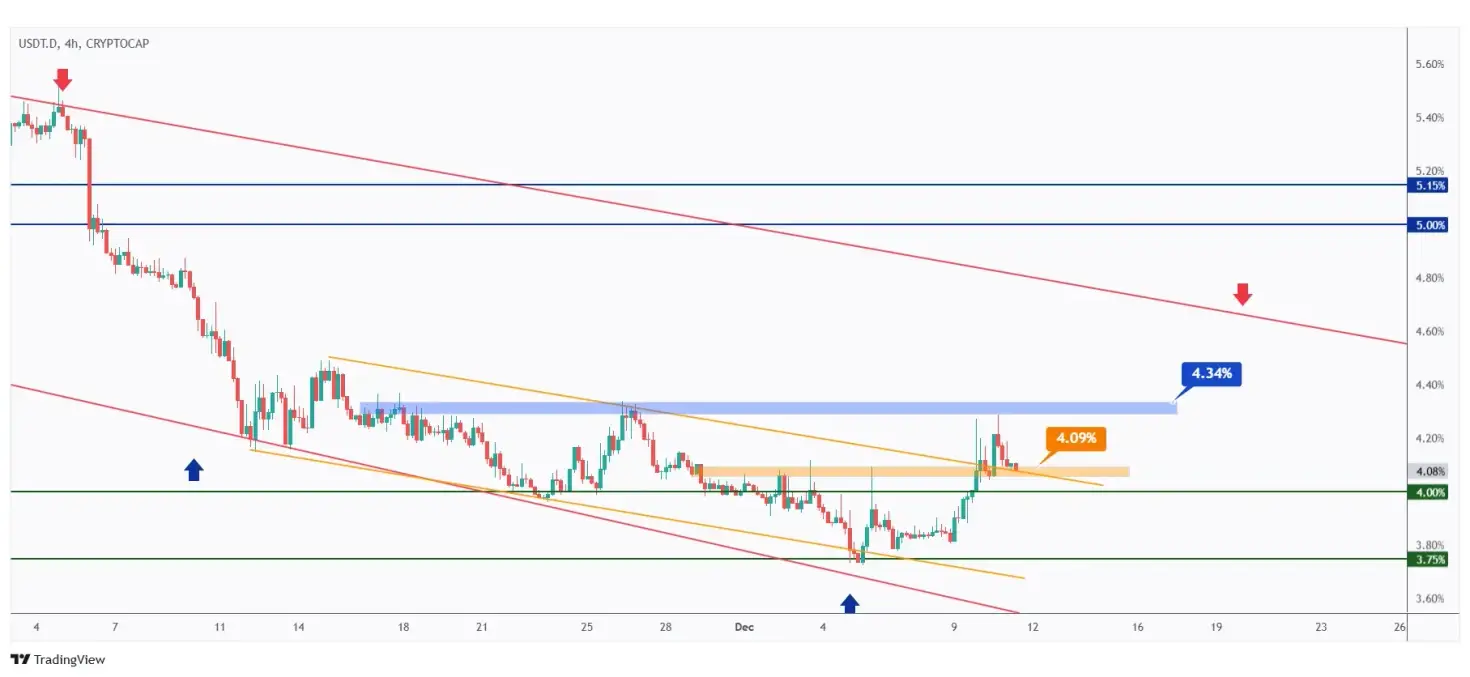
The bulls are clearly gaining momentum, as the 4.09% level has been broken to the upside.
For bullish control to persist, a break above the 4.34% structure is essential.
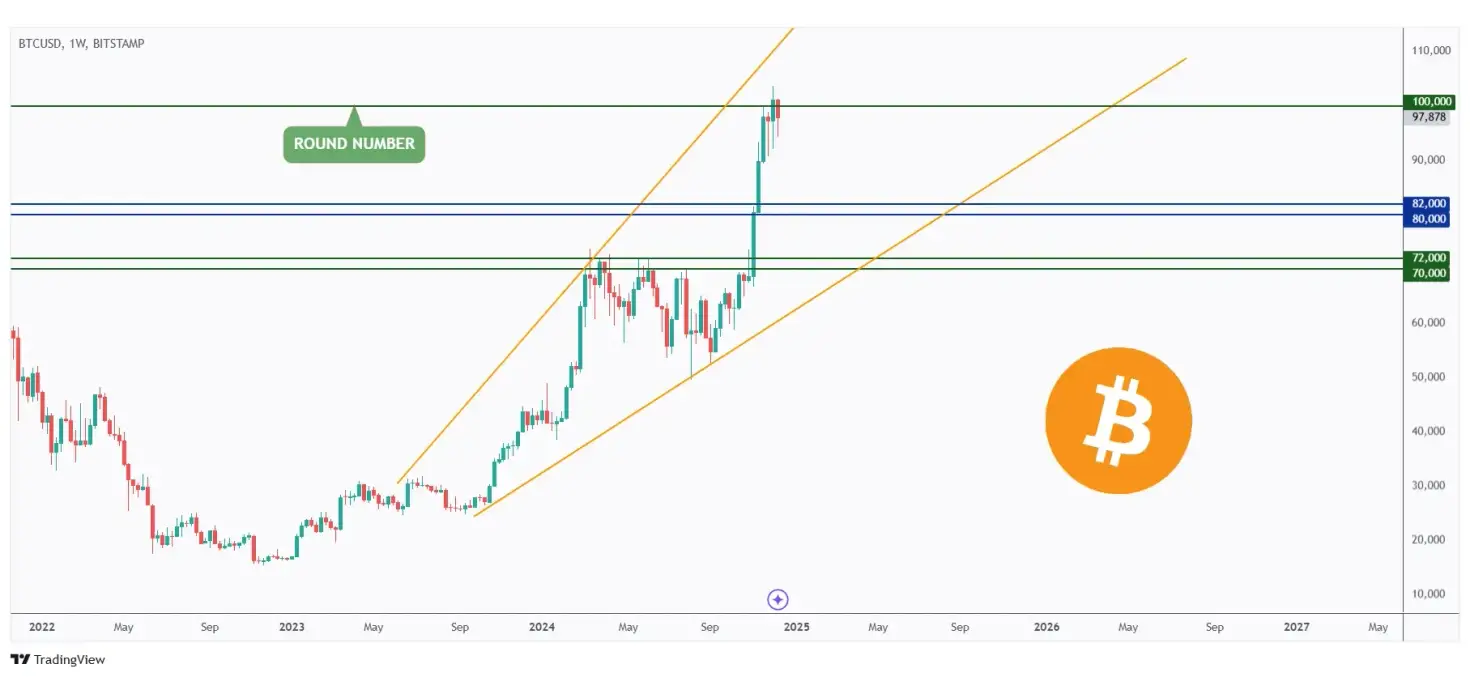
Following a parabolic bullish impulse, BTC has been consolidating within a narrow range around the $100,000 mark.
For the bulls to push higher, a weekly candle close above the $100,000 level is required.
Meanwhile, a bearish correction remains a strong possibility.
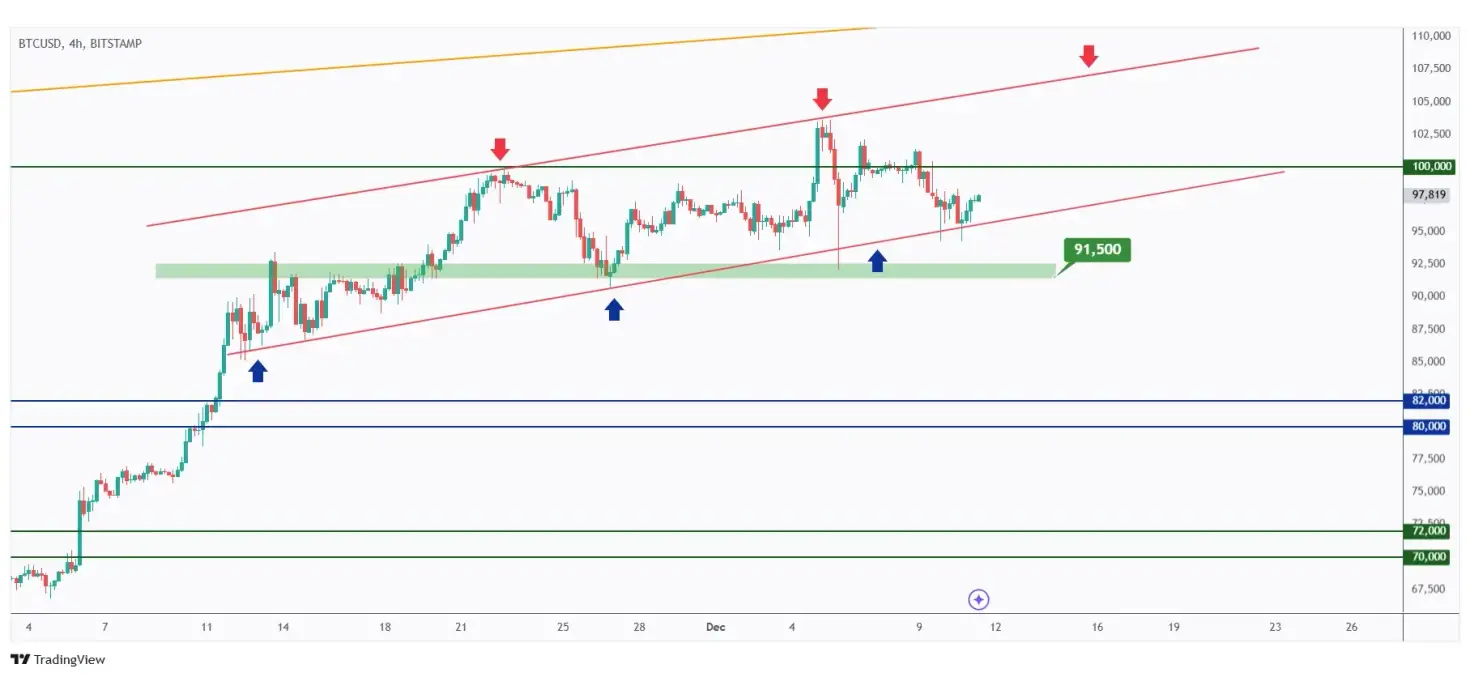
As outlined in our previous BTC analysis, it continues to hold strong within the rising channel highlighted in blue.
This bullish momentum is expected to remain dominant unless the $91,500 structure is broken to the downside.
5 Altcoins Analysis
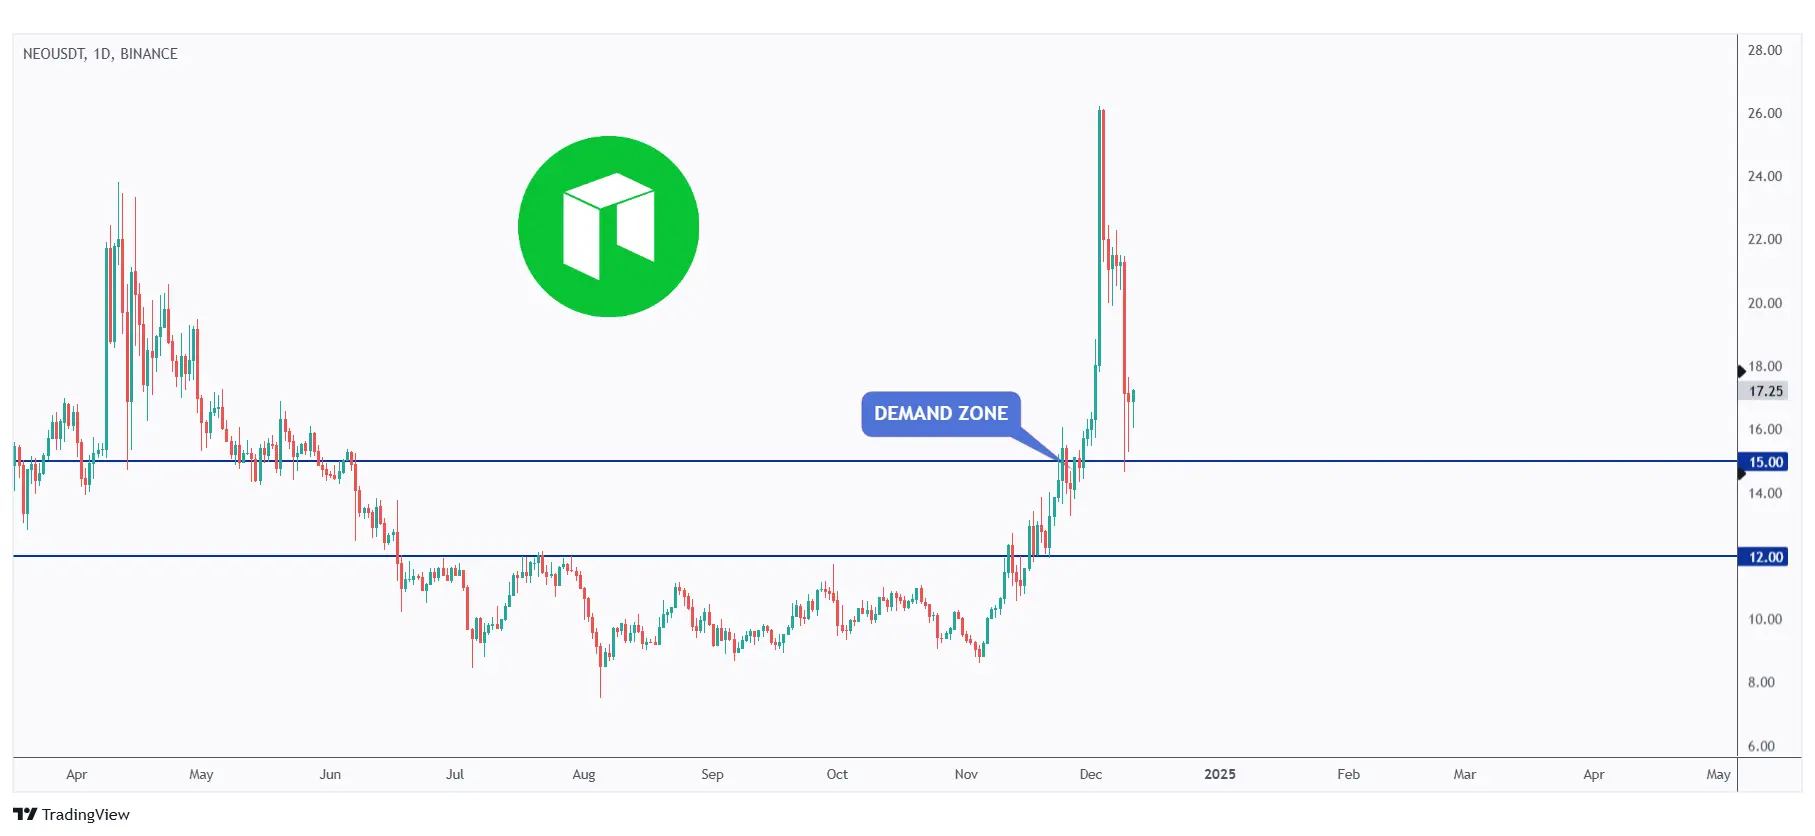
After surpassing the $15 resistance level, NEO surged by over 70%.
Currently, NEO has retraced to around $15, which is now acting as support. We will be watching for trend-following long opportunities to catch the next upward impulse.
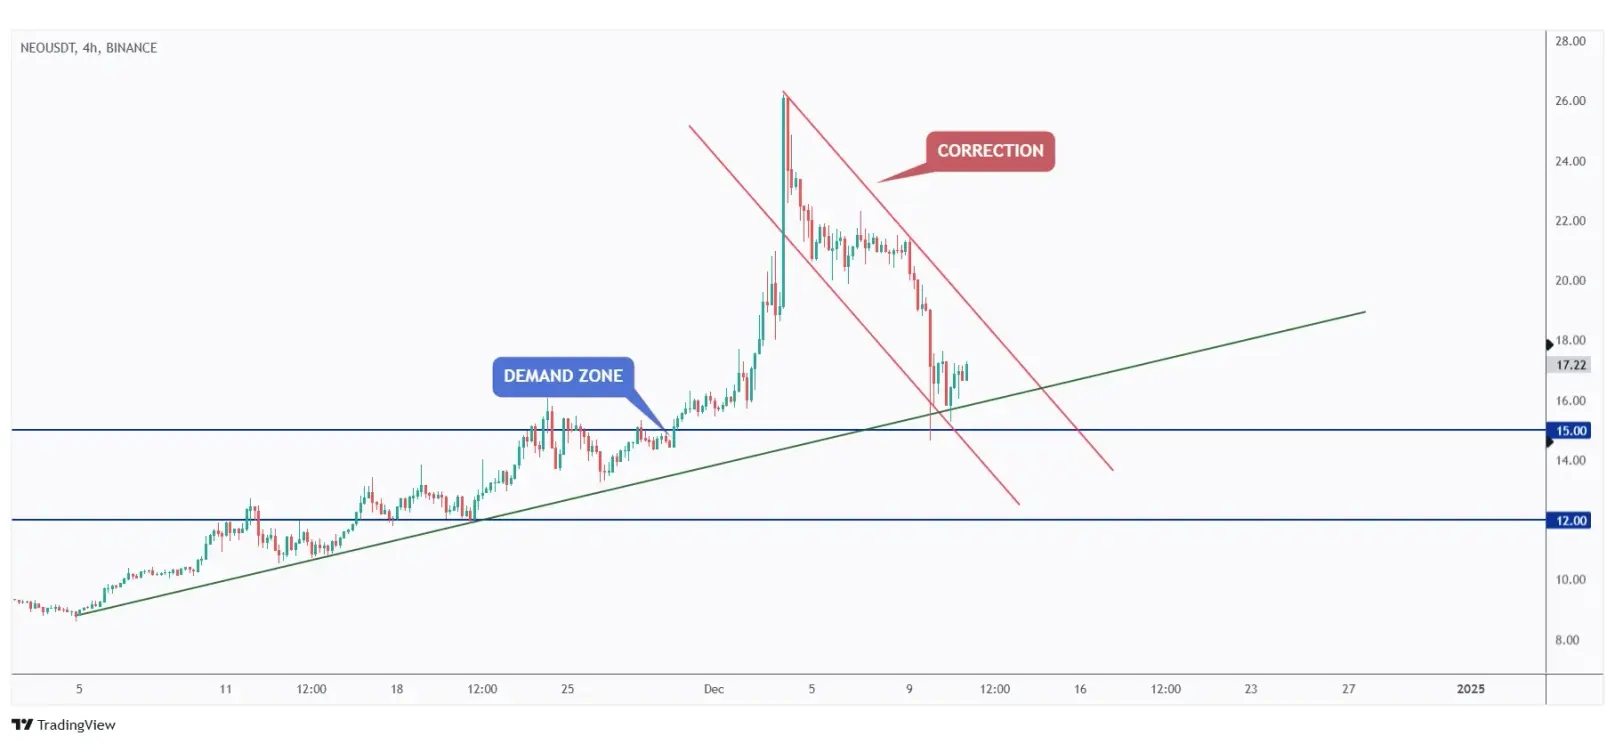
NEO has entered a correction phase, trading within the falling channel highlighted in red.
For the bulls to trigger the next impulse move, a breakout above the channel is required.
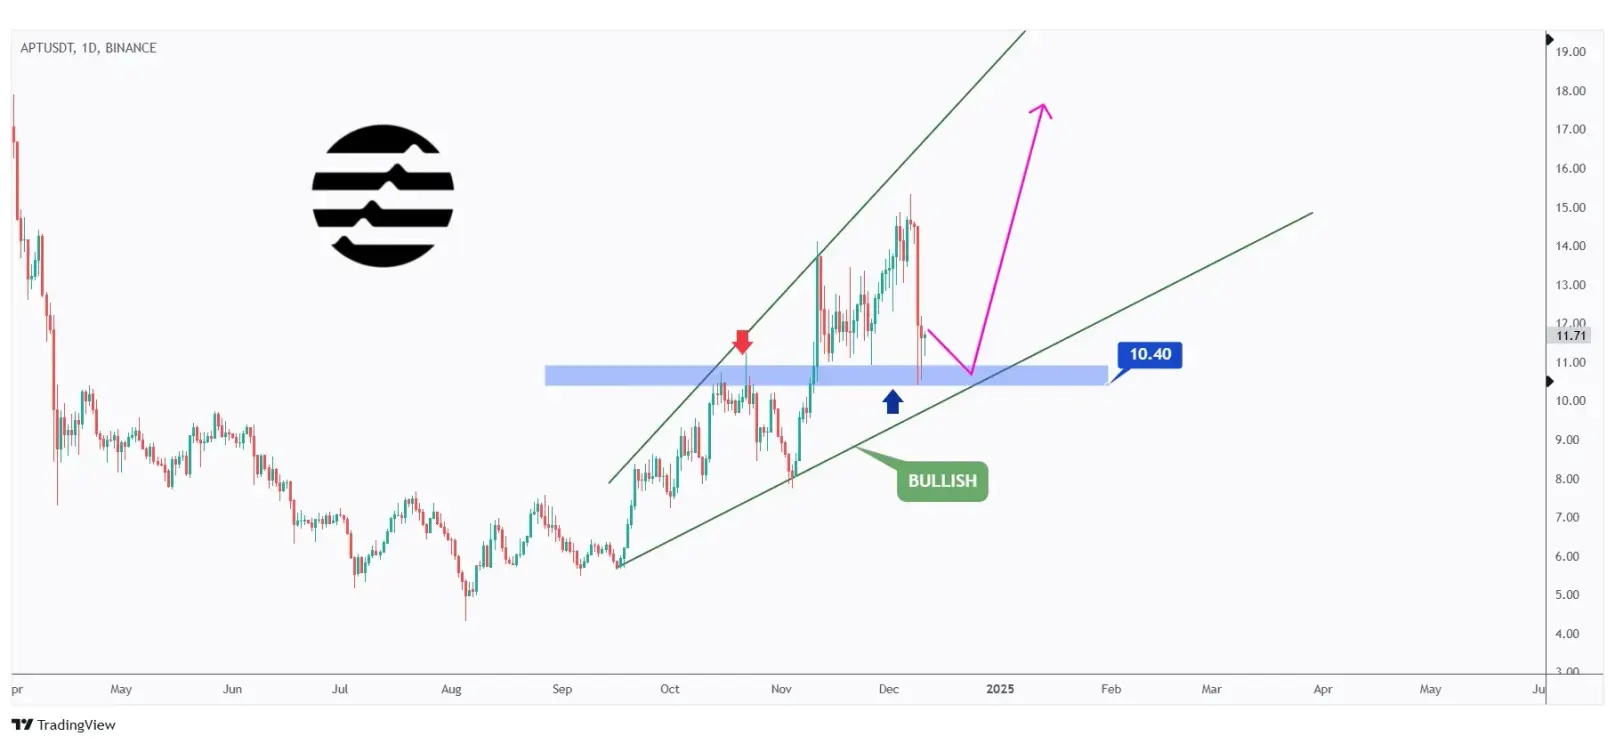
APT has been bullish, trading within a well-defined rising broadening wedge highlighted in green.
Currently, it is in a correction phase, retesting the lower boundary of the wedge, which also intersects with the blue structure.
We will look for long opportunities on lower timeframes, provided the $10.4 level holds as support.
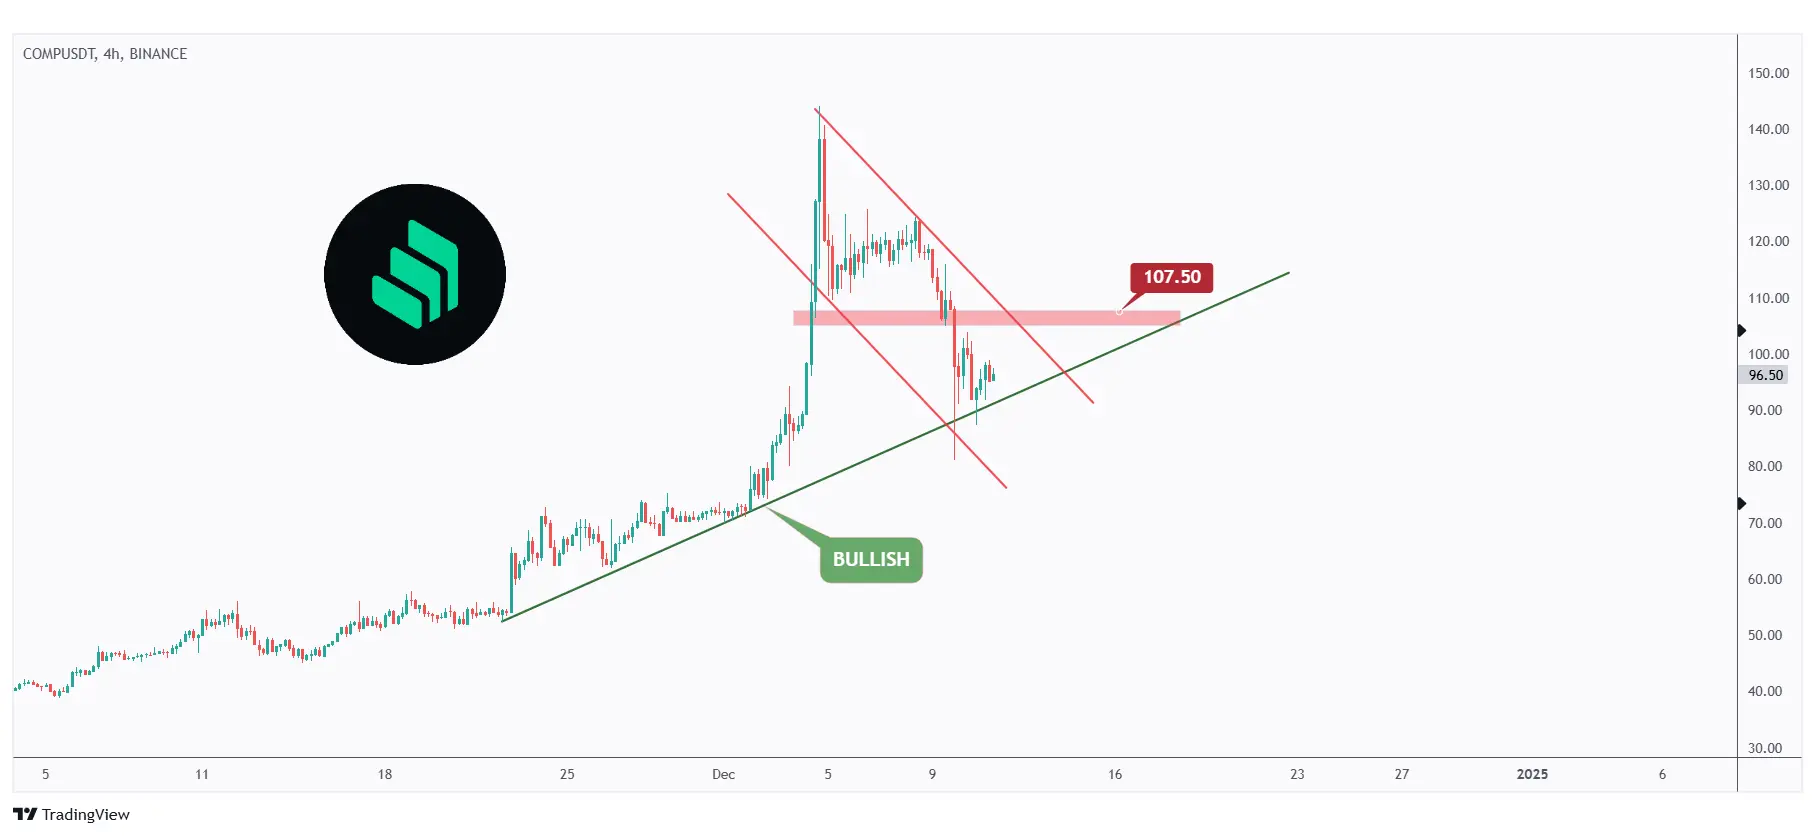
Next up is COMP, which has been one of the top performers this month.
Currently, it is hovering around the lower boundary of the falling red channel, intersecting with the rising trendline. We will be watching for long opportunities.
Our confirmation to enter a long position would be a break above the $107.5 level, marked in red.
Analyzing OP, as highlighted in our latest altcoins article, it is currently hovering around the key rejection zone we identified.
This zone is significant as it represents the intersection of the $2 support level and the red trendline, which acts as a non-horizontal support.
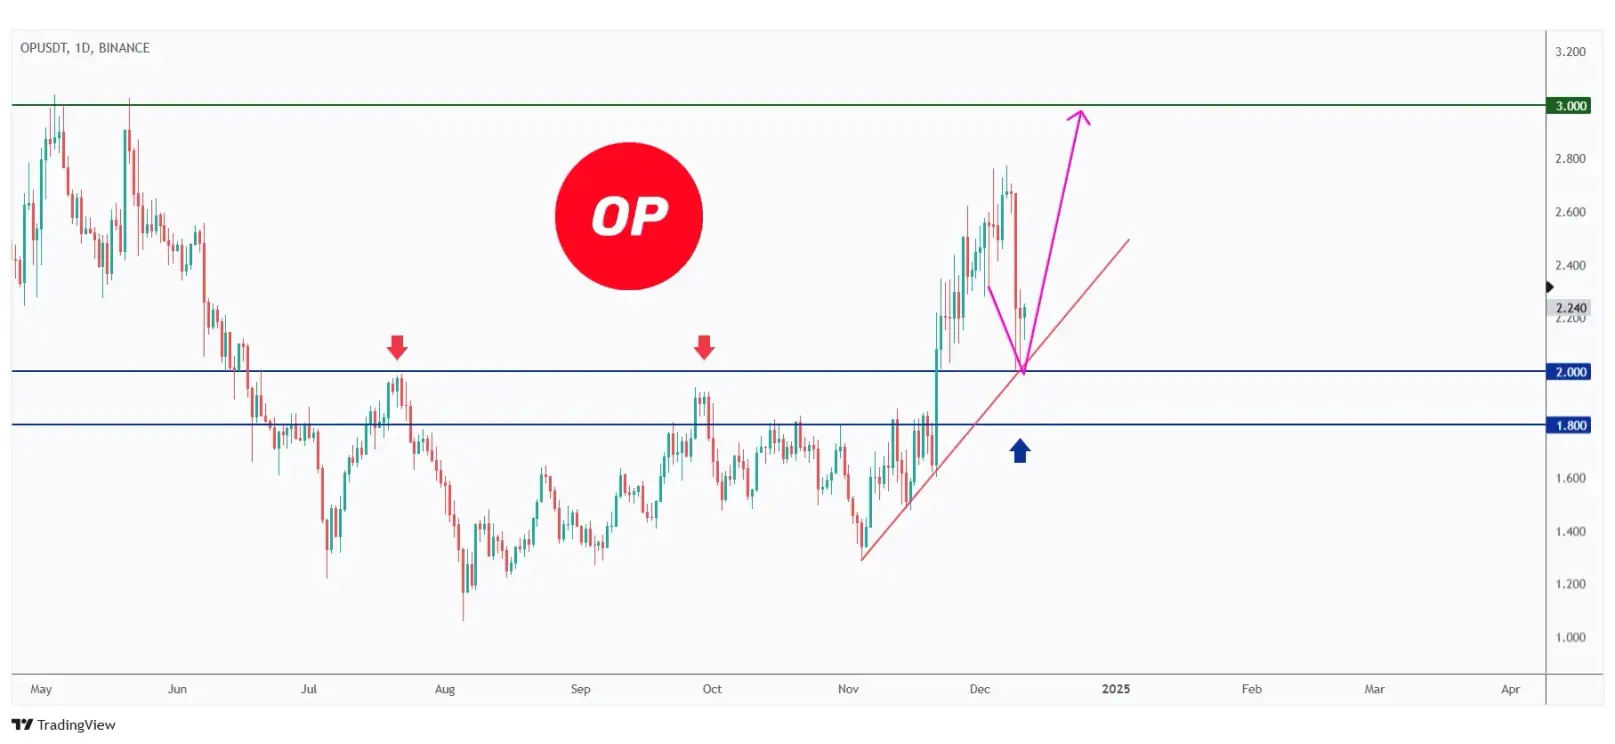
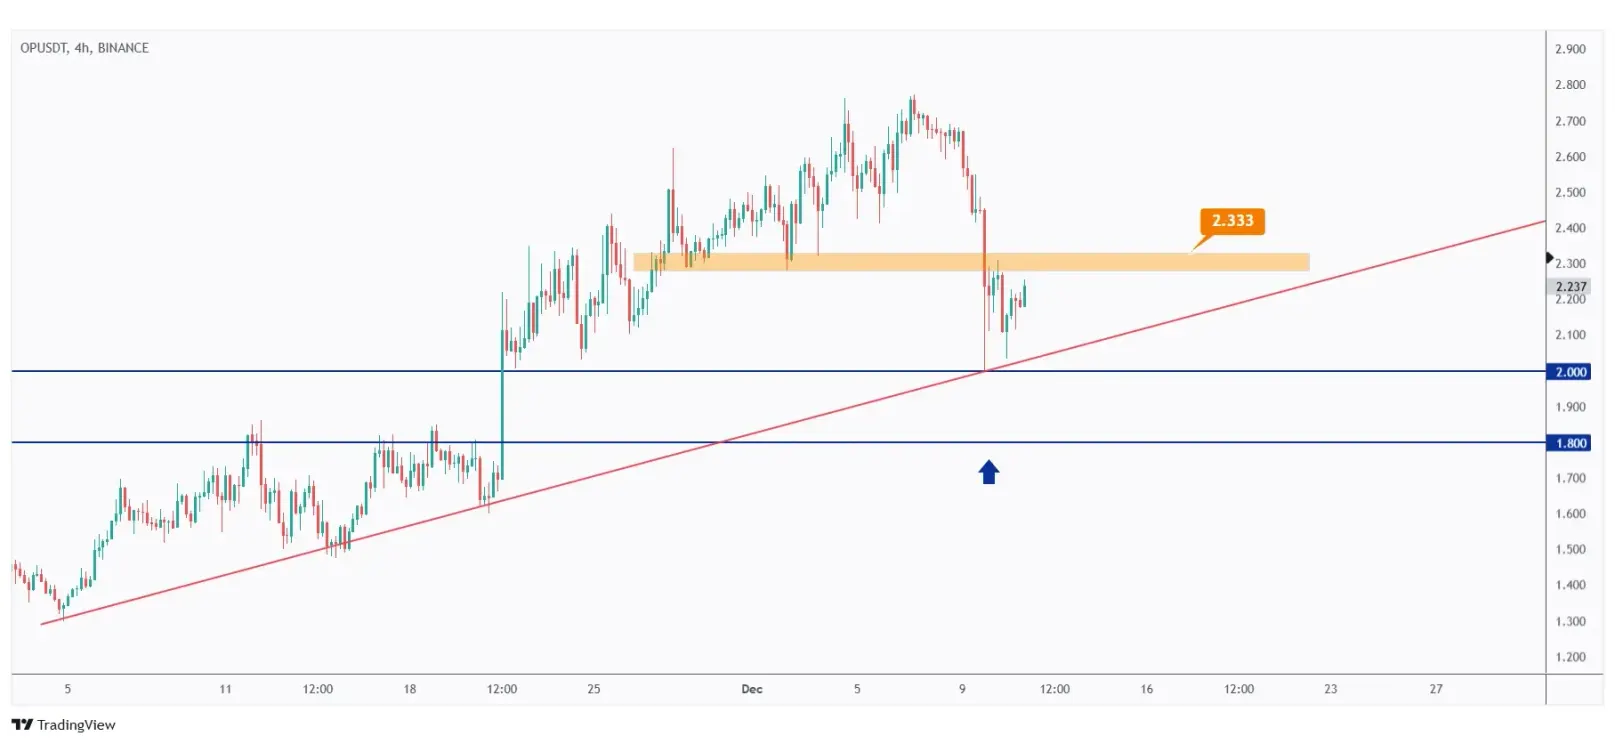
In the short term, for the bulls to gain momentum and initiate the next impulse phase, a break above the previous major high, marked in orange at $2.333, is required.
Until then, OP is likely to remain range-bound between the $2 support level and the $2.333 resistance.
Last but not least, SKL appears intriguing as it is currently retesting a major structure at the round number of $0.05.
As long as the $0.0535 support level holds, we anticipate the bulls to gain momentum at any moment.
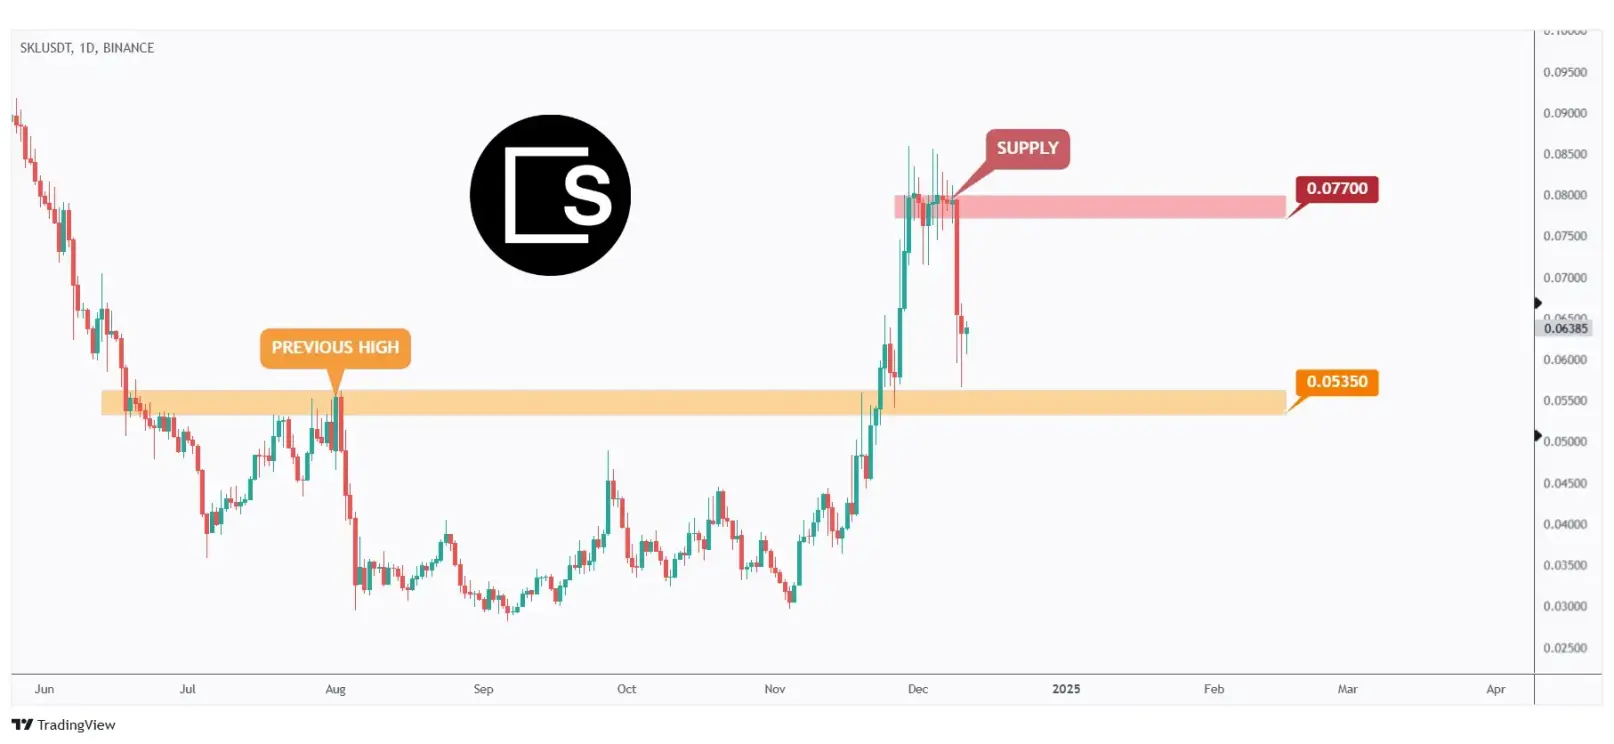
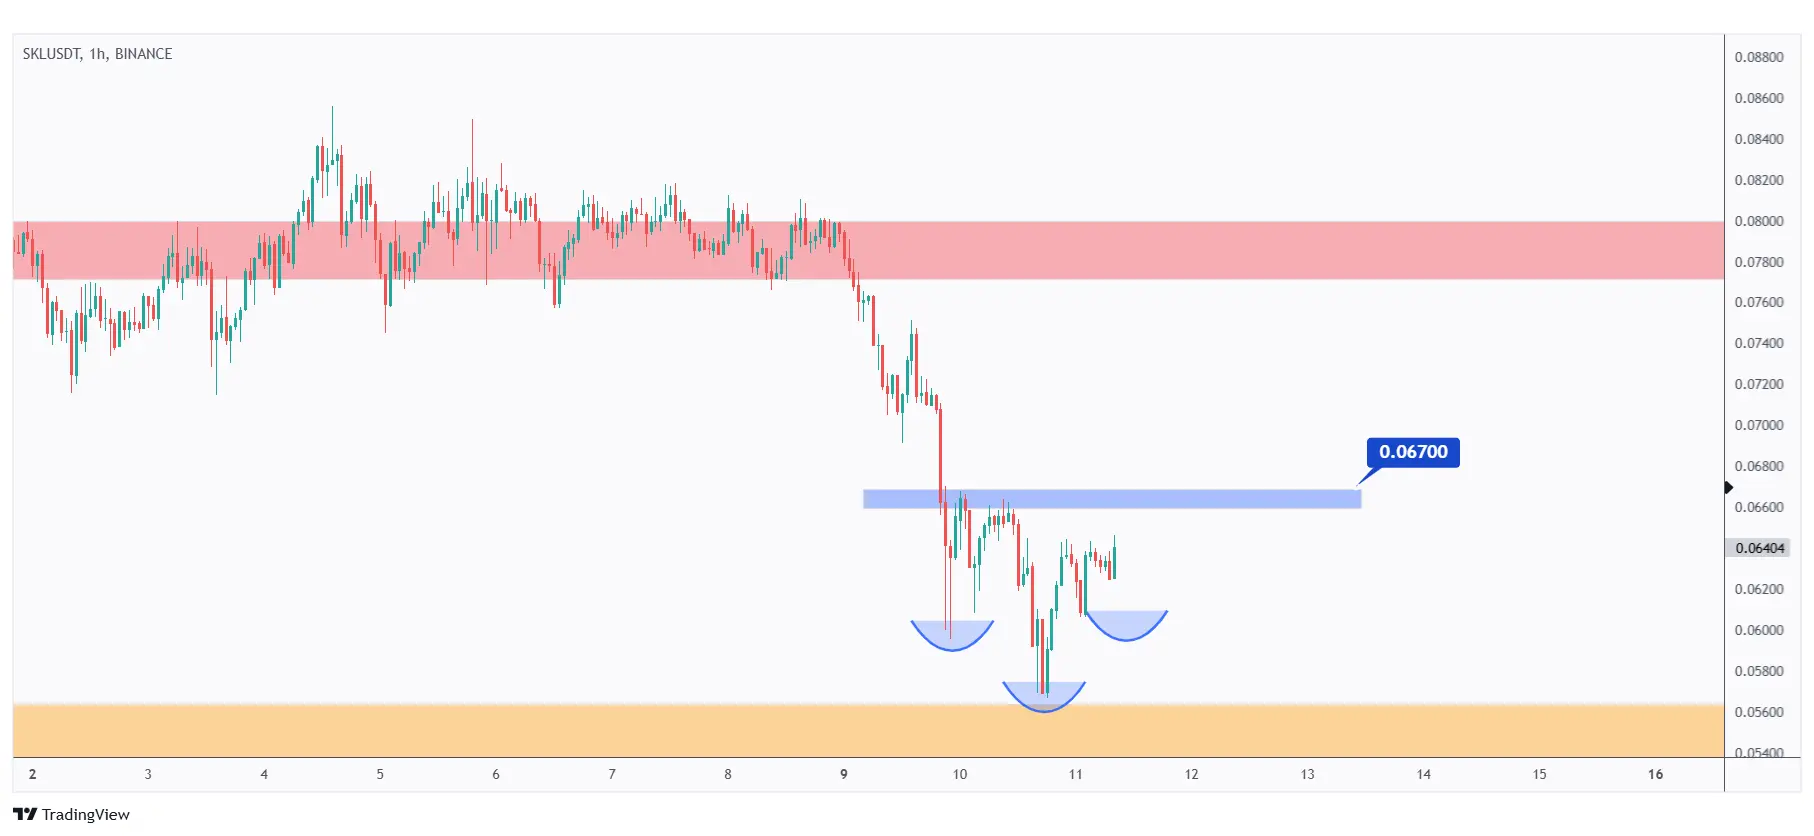
After rebounding from the support zone, SKL has been forming an inverse head and shoulders pattern, indicating a short-term accumulation phase.
According to textbook patterns, for this setup to be confirmed and to consider going long, a breakout above the neckline, marked in blue at $0.067, is required.
Quotes / Advices
When you genuinely accept the risks, you will be at peace with any outcome.
~Mark Douglas
Closing Remarks
In summary, USDT.D remains steady within the 3.75%–4% support zone, with bullish momentum evident after breaking the 4.09% level.
BTC is consolidating around $100,000. Bulls need a weekly candle close above this level for further upside, while a bearish correction remains a possibility.
After a 70% surge, NEO has retraced to $15, which now acts as support. A breakout above the falling channel is needed to trigger the next impulse.
Trading within a rising broadening wedge, APT is retesting key support levels at $10.4, where long opportunities are being monitored.
One of this month’s top performers, COMP is testing the lower boundary of a falling channel. A break above $107.5 is needed for bullish confirmation.
Currently range-bound between $2 support and $2.333 resistance, OP requires a break above $2.333 to initiate its next bullish phase.
Retesting a significant structure at $0.05, SKL is forming an inverse head and shoulders pattern. A breakout above the $0.067 neckline is needed to validate this bullish setup.


