

Welcome to another crypto market outlook for the 22nd of December!
Following the FOMC meeting and Powell’s speech, the crypto market took a hit just before Christmas. However, the good news is that, based on previous cycles, the week between Christmas and New Year is typically bullish. So, are we gearing up for an end-of-year rally?
Today, we will cover the following topics:
– Market Heatmap and Fear and Greed Index
– US500, DXY and Gold Analysis
– USDT.D, Bitcoin and Ethereum Analysis
– Quotes / Advices
– Closing Remarks
Market Heatmap and Fear and Greed Index
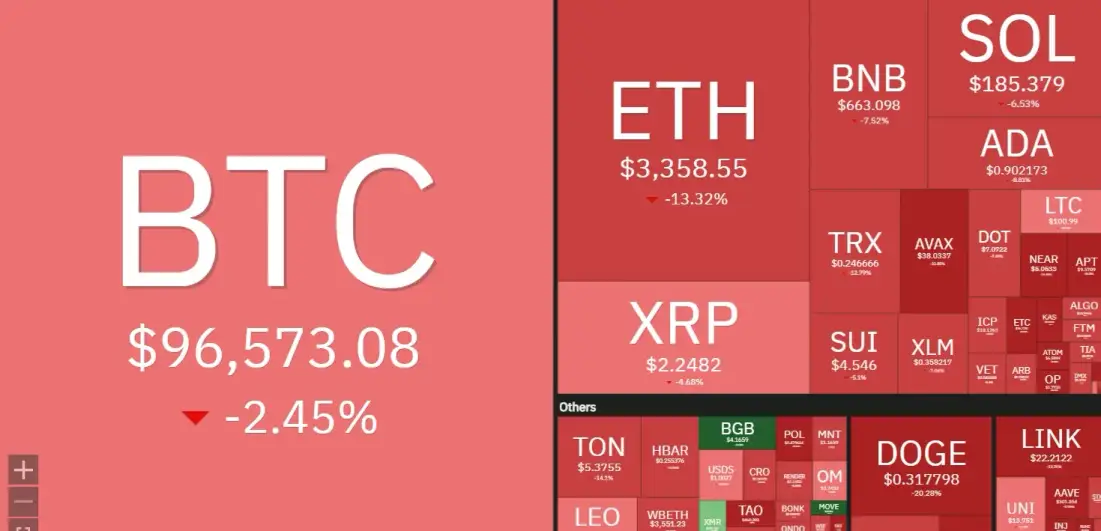
BTC and ETH took a significant dip this week, pulling the entire crypto market down with them. However, many altcoins are nearing strong support or demand zones, signaling that the storm might soon end and brighter days could be ahead.
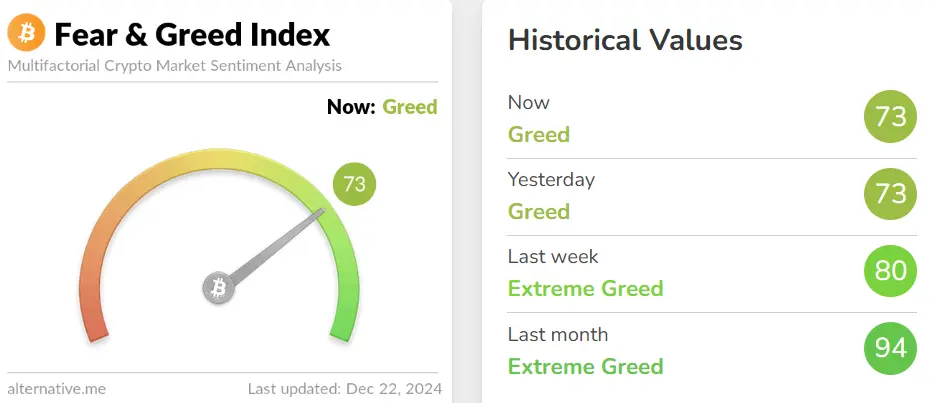
This week, the Fear and Greed Index shifted from “Extreme Greed” to “Greed.” Despite the aggressive dip, the meter has not fallen into the “Fear” zone, indicating that traders remain optimistic about the year ahead.
US500, DXY and Gold analysis
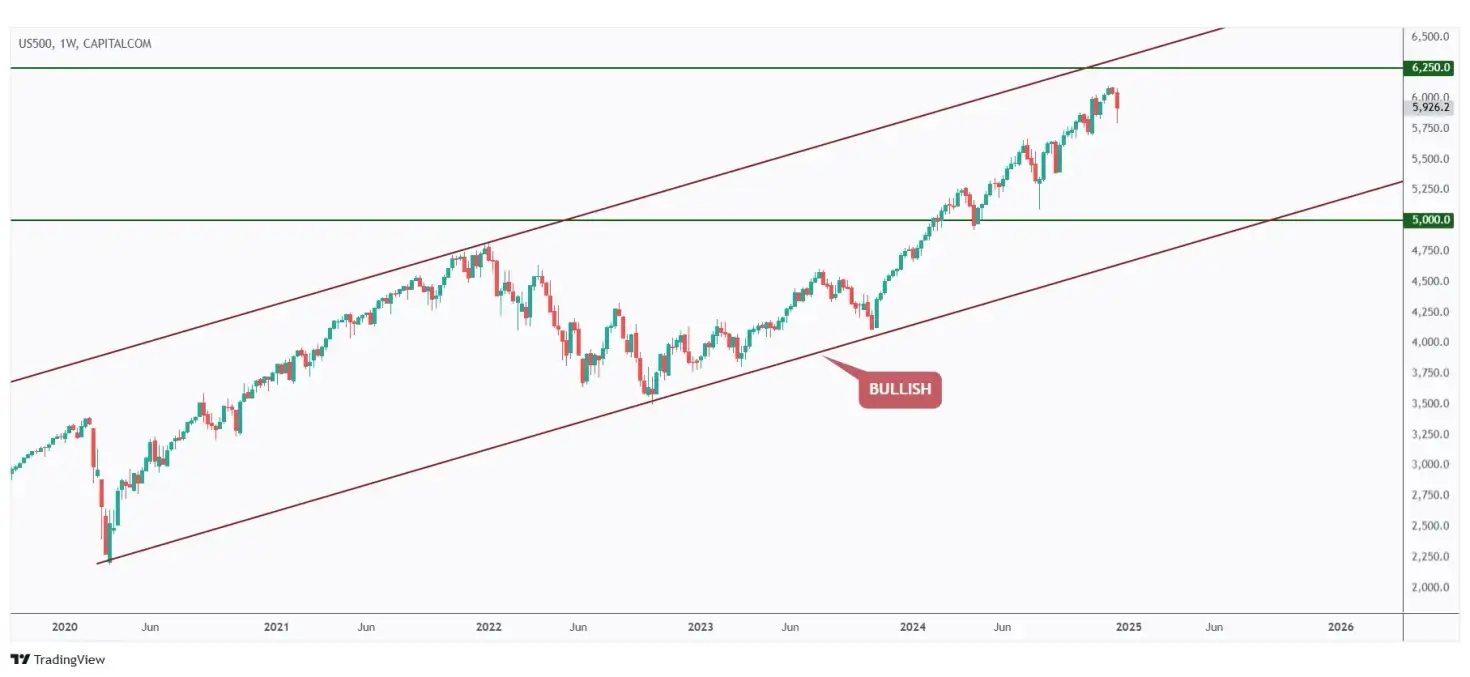
As highlighted in our previous market outlooks, the US500 remains bullish from a macro perspective as long as it continues to trade within the rising channel.
However, when it approaches the upper boundary of the channel, it enters overbought territory.
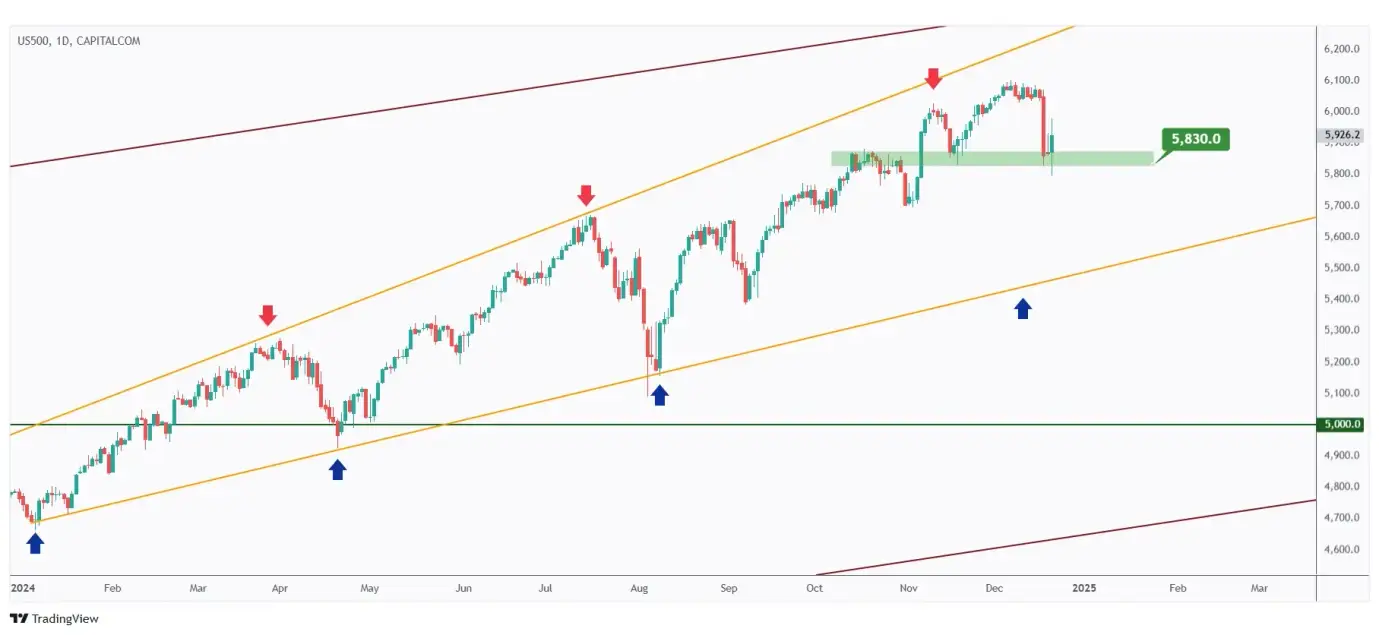
As long as the most recent low at $5,830 holds, the bulls will maintain control in the medium term.
However, if the low marked in green is broken to the downside, a significant correction toward the lower orange trendline and the $5,500 level is likely.
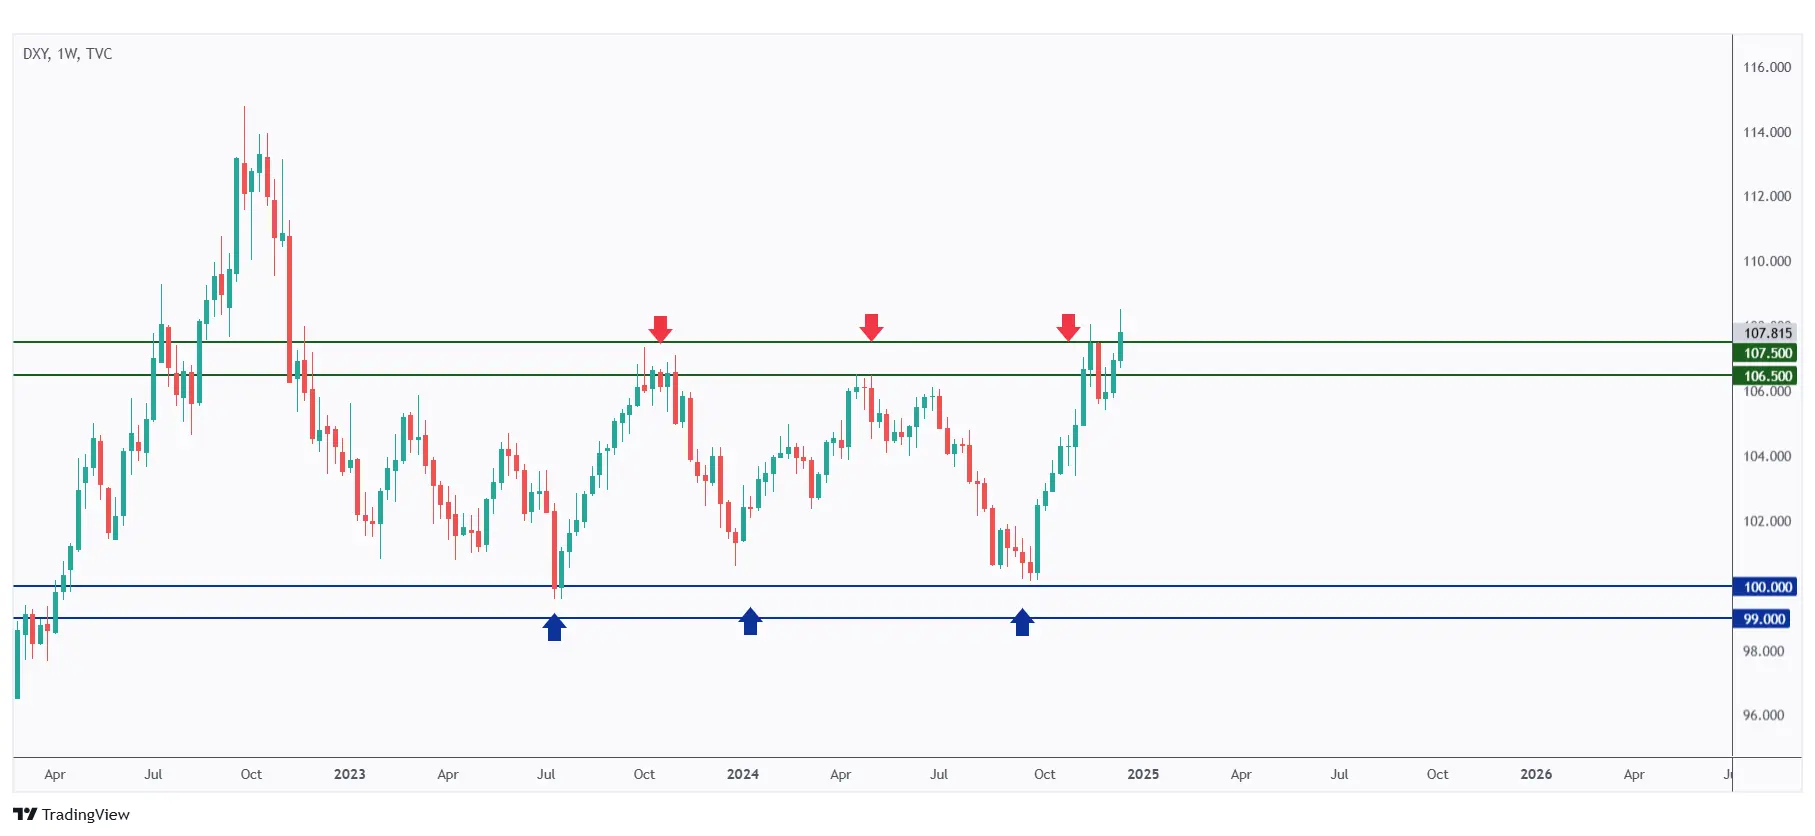
Following the Fed’s interest rate decision, the DXY has been strengthening over the past couple of days.
It is currently breaking above its weekly resistance, indicating that further upside potential is expected.
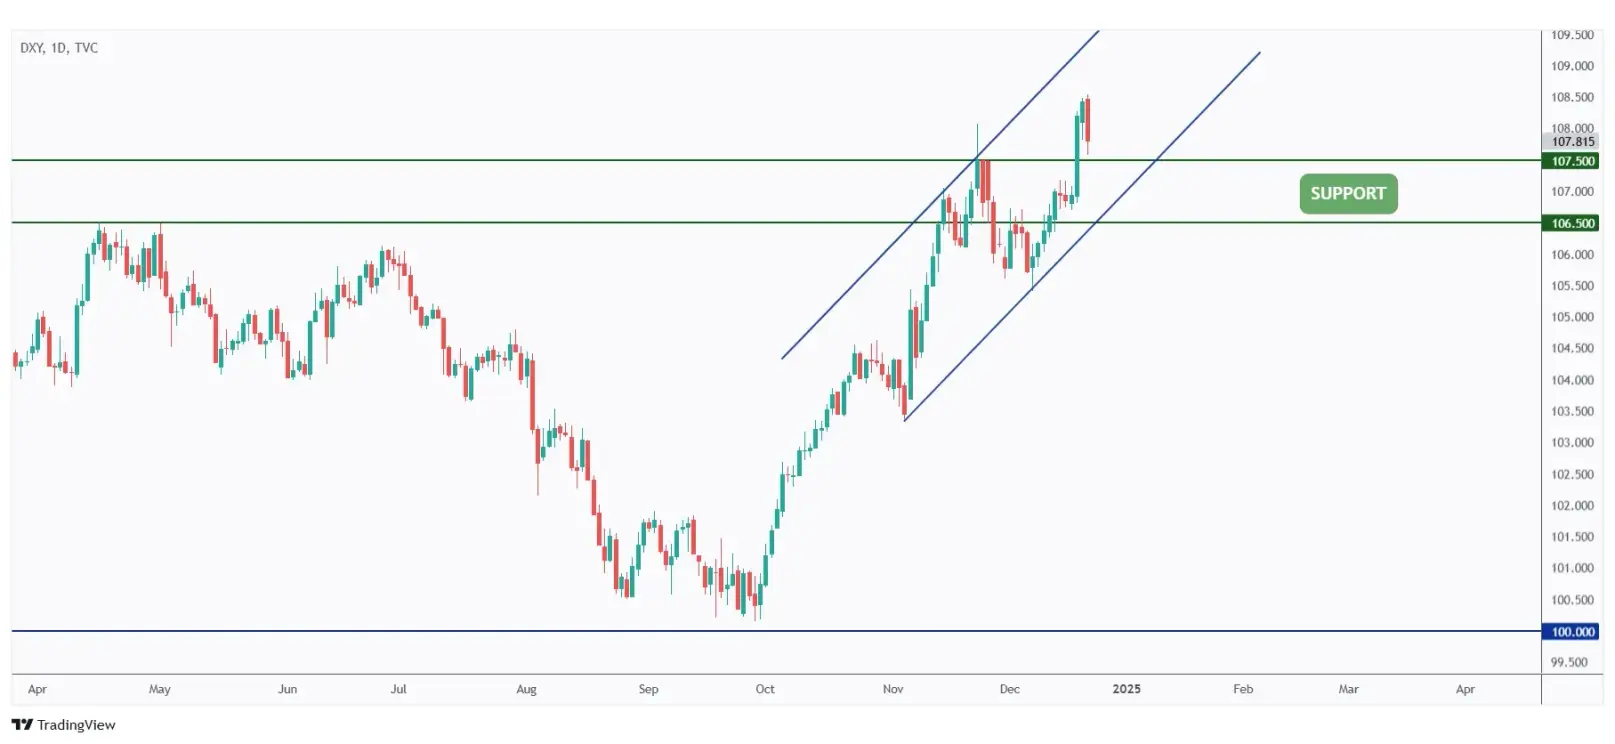
As long as the DXY continues trading within the rising channel marked in blue, the momentum will remain bullish.
The bears are likely to take control only if the $106.5 support level is broken to the downside.
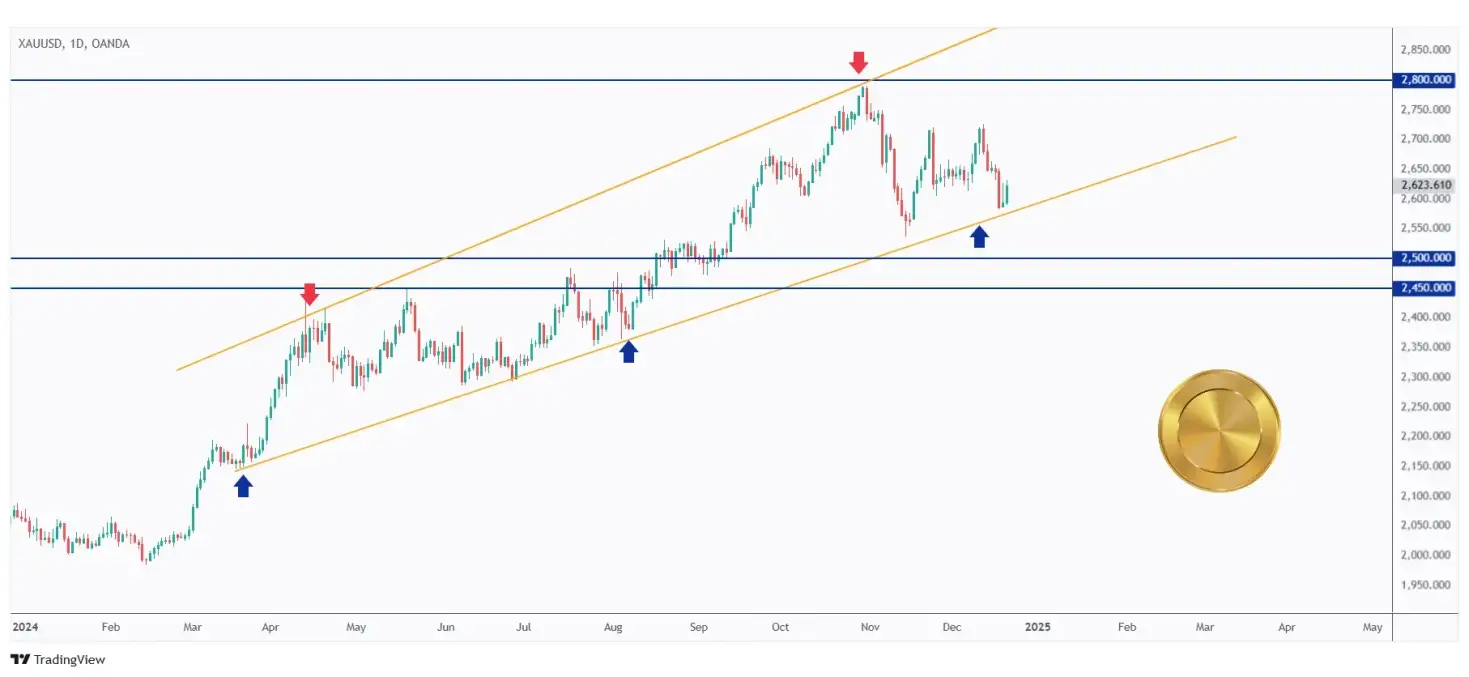
As the DXY gained strength this week, Gold has been losing momentum, as it typically shares a negative correlation with the USD Index.
However, it is currently hovering near the lower bound of its channel, suggesting that bulls might step in as the market opens next week.

For the bulls to confirm the start of the next medium-term impulse move, a break above the last high marked in red at $2,650 is required.
Until then, Gold is likely to remain bearish.
USDT.D, Bitcoin and Ethereum analysis
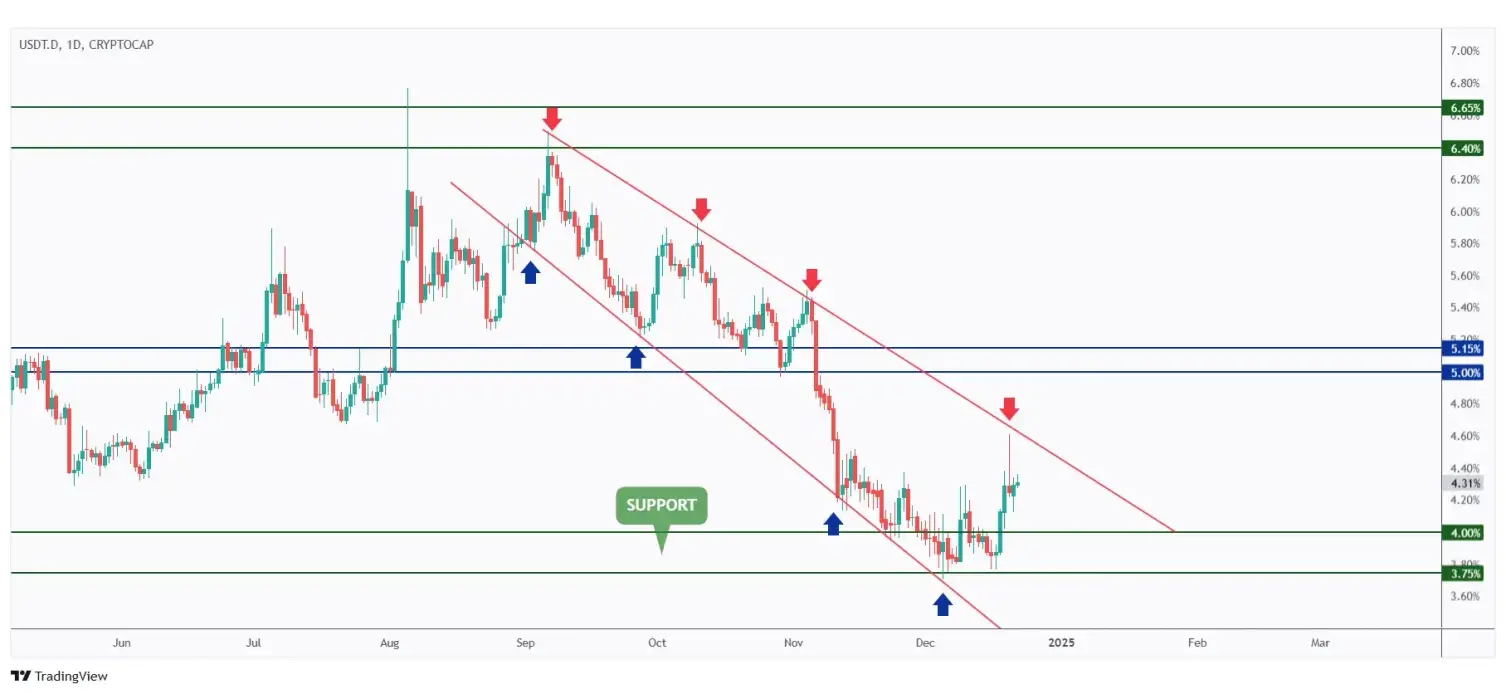
As anticipated in our previous market outlook, USDT.D perfectly bounced off the 3.75% support level and moved higher to test the upper boundary of the descending red channel.
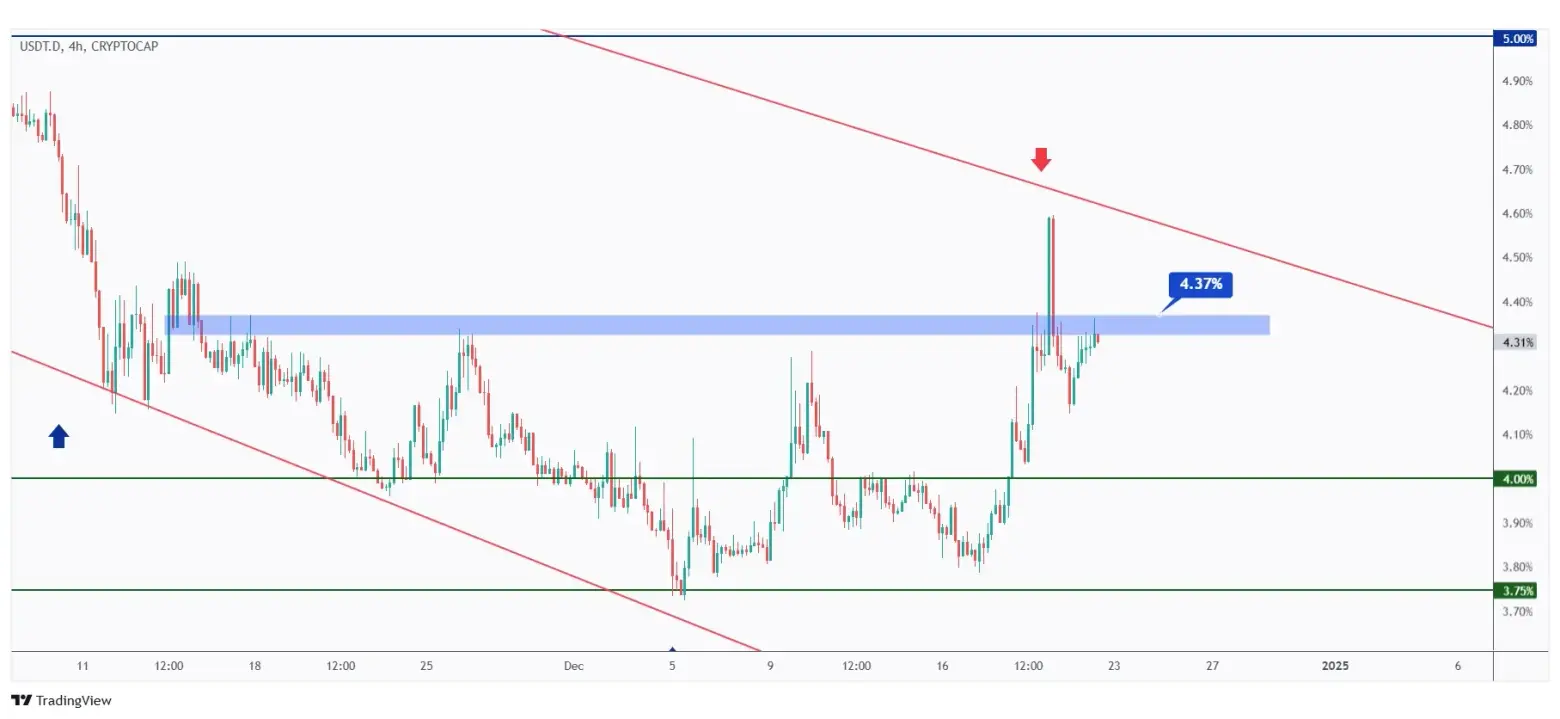
After rejecting the upper boundary of the daily falling channel, which serves as resistance, USDT.D has entered a short-term correction phase.
If the 4.37% level marked in blue is breached to the upside, a deeper bullish correction toward the upper red trendline is likely.
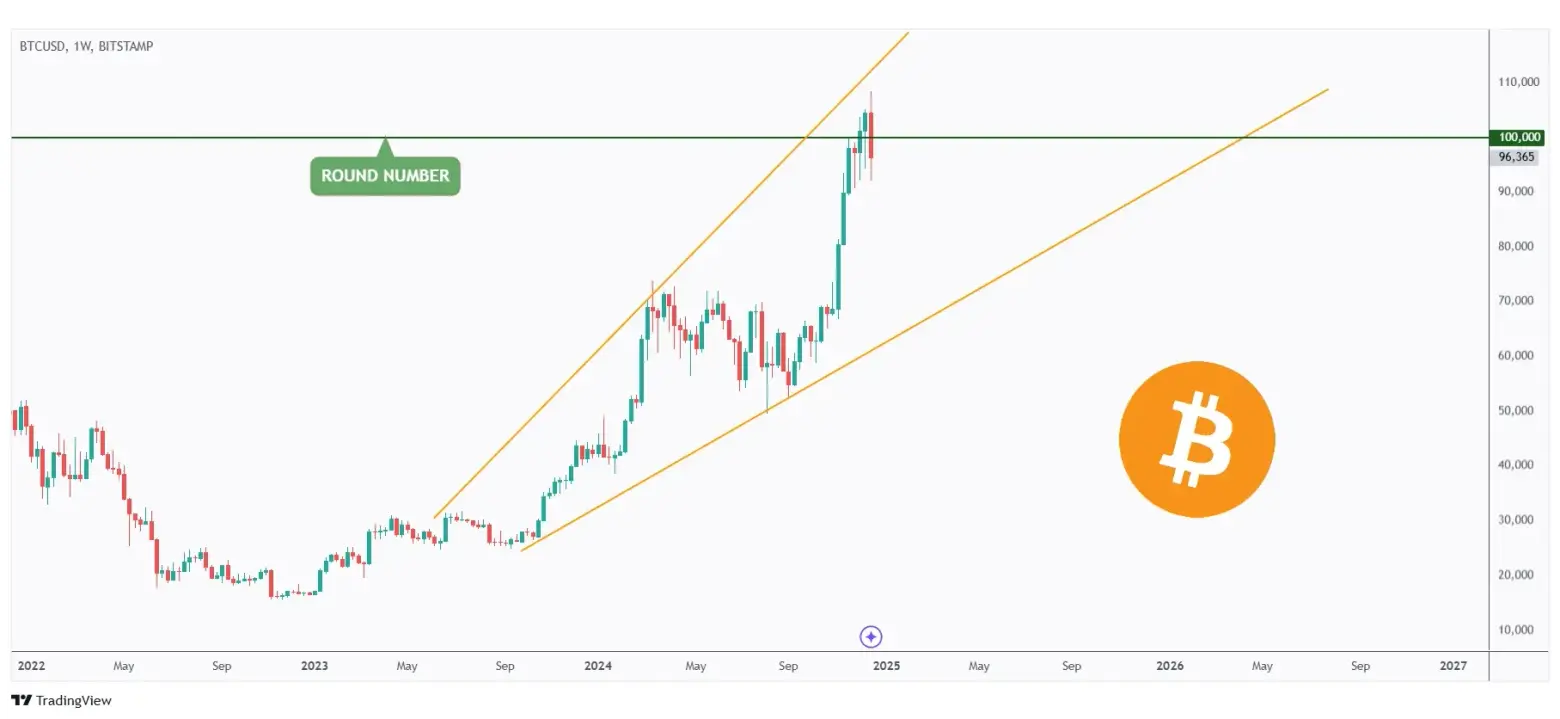
As mentioned in the previous BTC update, it continues to hover around the $100,000 level. This consolidation is expected following its parabolic rise from $60,000.
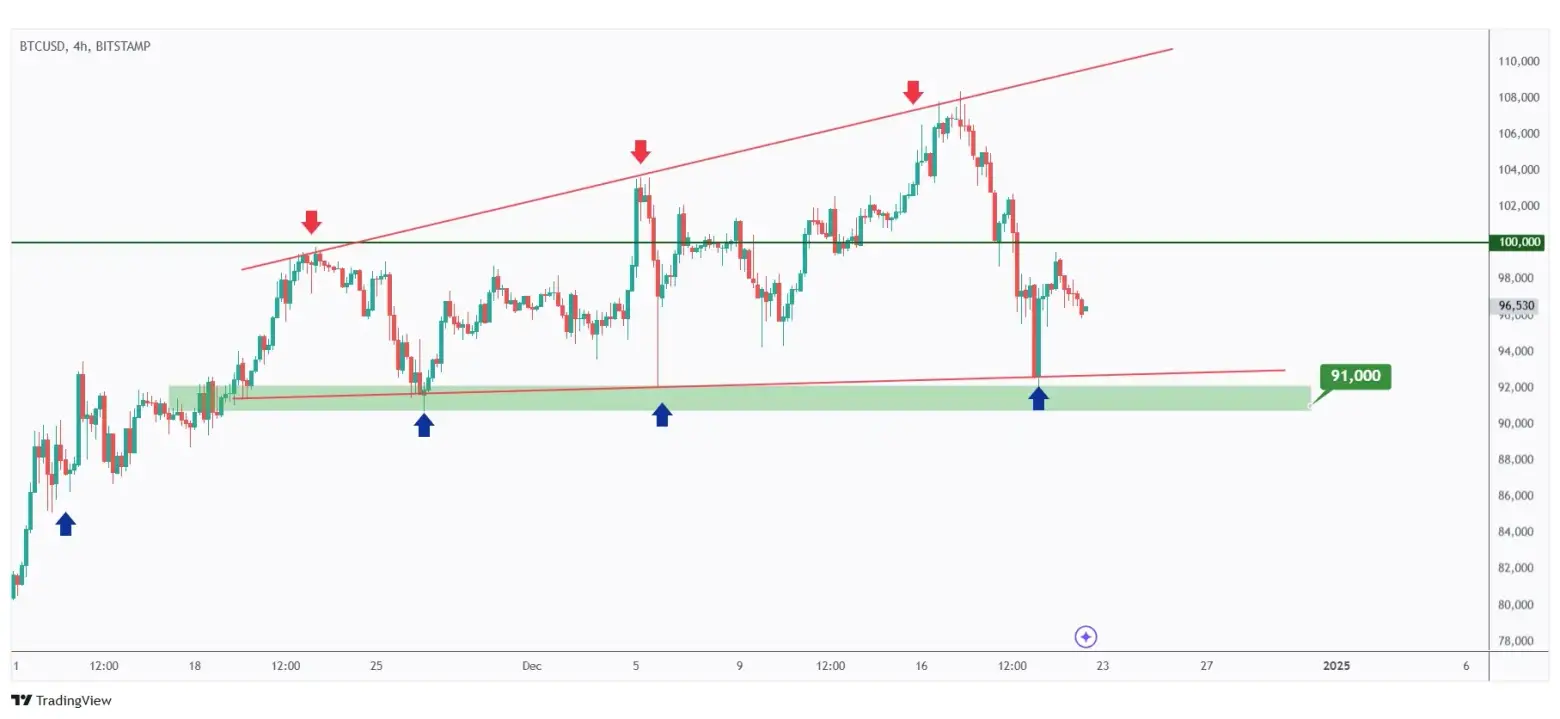
This week, BTC rebounded off the lower boundary of the flat rising wedge marked in red.
As long as the $91,000 support level holds, the bulls will maintain control, particularly if BTC breaks above the $100,000 level once again.

After breaking below the red channel and the $3,500 resistance, ETH’s momentum has shifted from bullish to bearish.
As long as the $3,500 resistance level remains intact, a bearish continuation toward the $3,000 round number is likely.
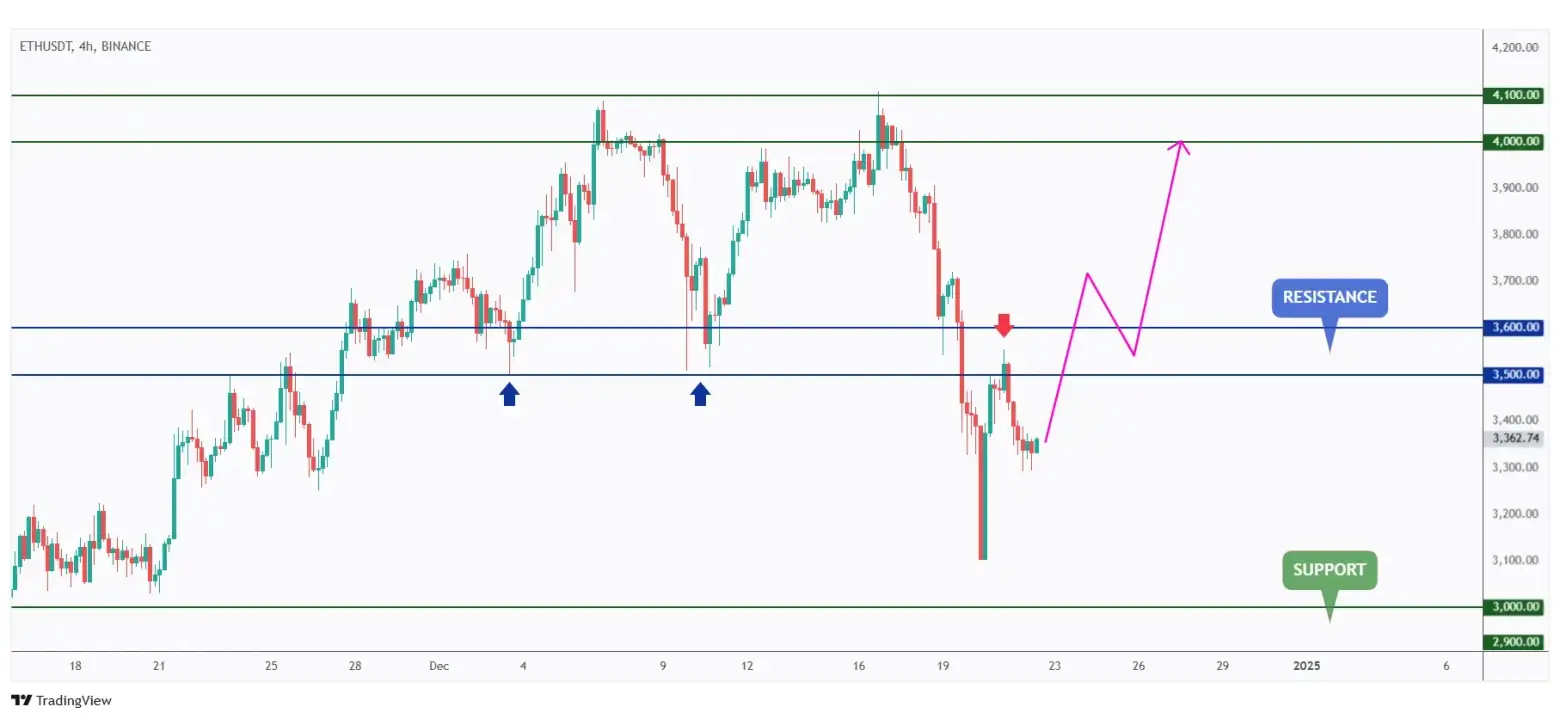
Conversely, if the $3,600 level is broken to the upside, a bullish surge toward $4,000 can be anticipated.
Quotes / Advices
I think investment psychology is by far the more important element, followed by risk control, with the least important consideration being the question of where you buy and sell.
~ Tom Basso
Closing Remarks
In summary, the Fear and Greed Index reflects “Greed,” indicating optimism remains for the year ahead.
Key insights include the US500 maintaining bullish momentum as long as critical support levels hold, while DXY strength weighs on Gold.
BTC consolidation around $100,000 continues, with a bullish breakout contingent on key resistance levels. Similarly, ETH faces bearish momentum below $3,500, with a potential bullish reversal above $3,600.
As we approach the week between Christmas and New Year—historically bullish for crypto markets—traders remain optimistic for an end-of-year rally.


