

I am not surprised to see January ending on a bullish note. Traders are already welcoming the new month with optimism, aiming to make the most of this 2025 bull run. Here’s where BTC and ETH stand this week.
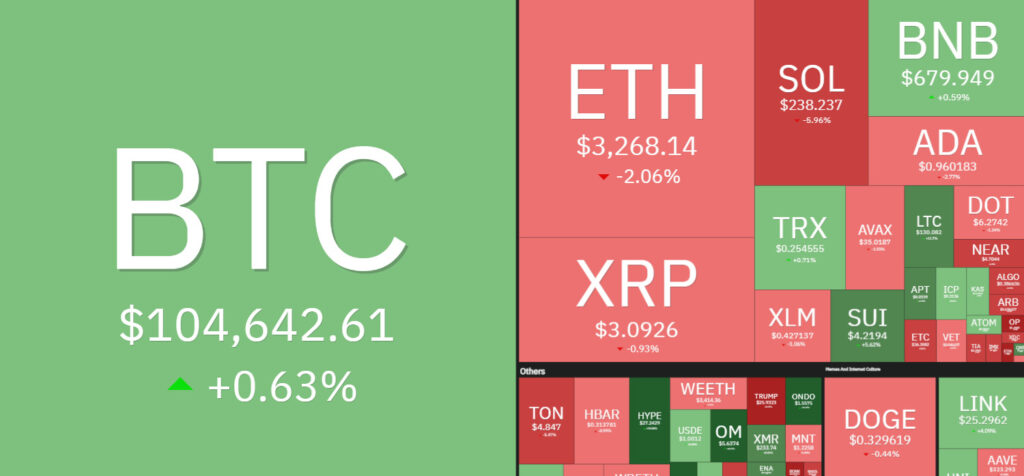
7 Days Heatmap
BTC is still undecided, hovering within a range between $100,000 and $110,000. This range has caused some altcoins to surge by over 10%, while others have melted and formed a lower lows.
BTC Analysis
In our latest market outlook two days ago, BTC was still hovering near the upper bound of its range, unable to break above its all-time high.
If $110,000 is broken to the upside, a new bullish phase is expected to begin for the entire crypto market.
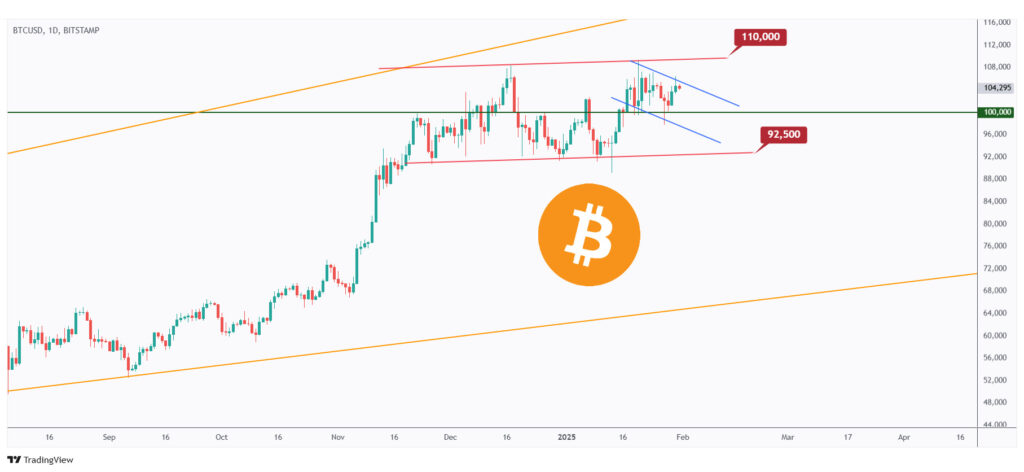
In parallel, if $100,000 is broken to the downside, another deep bearish impulse could be on the horizon for altcoins.
ETH Analysis
ETH is still hovering around the upper bound of its falling wedge pattern, marked in red.
As mentioned in our last market roundup, if the upper trendline is broken to the upside, a move toward the $3,500 resistance is expected.
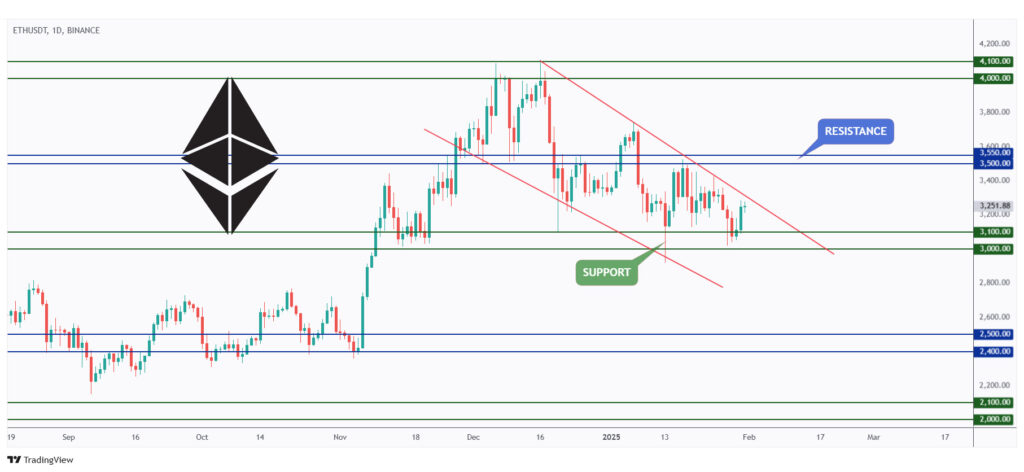
Meanwhile, ETH would remain bearish and stuck within a range between the $3,000 support and the upper red trendline, which acts as a non-horizontal resistance.
Quote of the week
In investing, what is comfortable is rarely profitable.
~ Robert Arnott
Closing Remarks
In summary, January is closing on a bullish note, with traders embracing the new month optimistically as the 2025 bull run unfolds.
BTC remains indecisive, ranging between $100,000 and $110,000, causing mixed reactions in the altcoin market. A breakout above $110,000 could trigger a new bullish phase, while a drop below $100,000 may signal deeper bearish pressure for altcoins.
ETH is testing the upper bound of its falling wedge pattern. A breakout above the upper trendline could push ETH toward the $3,500 resistance, but until then, it remains bearish within a range between $3,000 support and non-horizontal resistance.
Enjoying these market roundups? Dive deeper into our analysis for key trends, breakout signals, and strategic trading opportunities.