

Welcome to another crypto market outlook for the 17th of August!
After two weeks of pure optimism, the crypto market has started to cool down, especially after ETH was rejected at its all-time high. But don’t be fooled by this calm; it’s just the pause before the storm. In this article, we’ll go over the possible scenarios for the upcoming week.
Today, we will cover the following topics:
– Market Heatmap and Fear and Greed Index
– US500 and DXY
– USDT.D, Bitcoin and Ethereum Analysis
– Quotes / Advices
– Closing Remarks
Market Heatmap and Fear and Greed Index
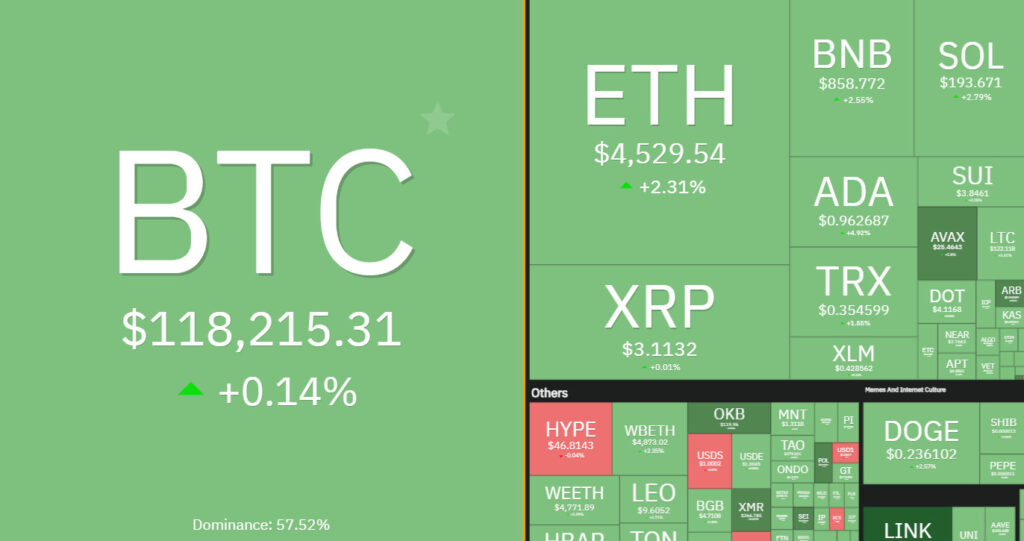
Even though the market has been cooling off, the 7-day crypto heatmap is still signaling optimism, as almost all altcoins closed the week on a bullish note.
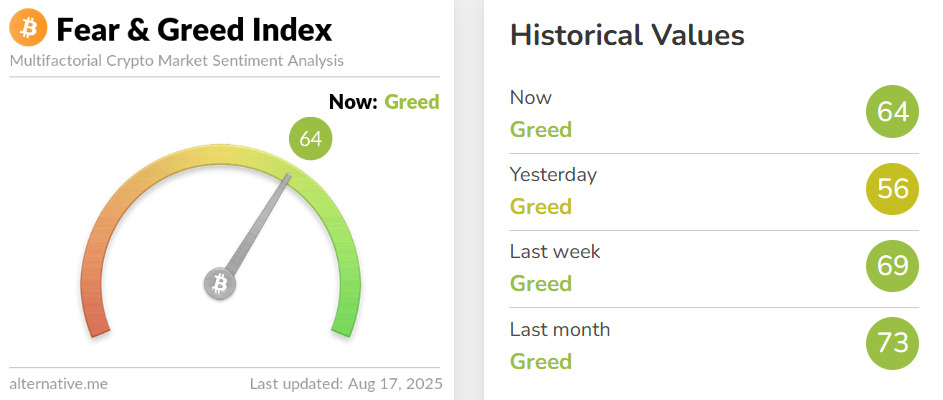
The Fear and Greed Index is still signaling “Greed,” with the meter climbing from 56 to 64 in just 24 hours.
US500 and DXY analysis
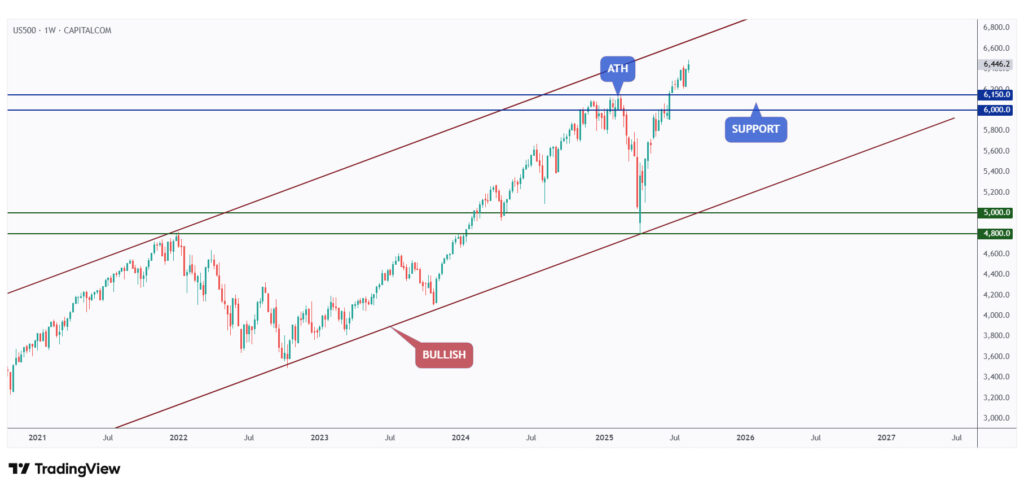
As per our last market outlook, the US500 is showing no signs of weakness, recording new all-time highs on a daily basis.
In the long term, as long as the previous major high at $6,150 holds, the overall bias will remain bullish.
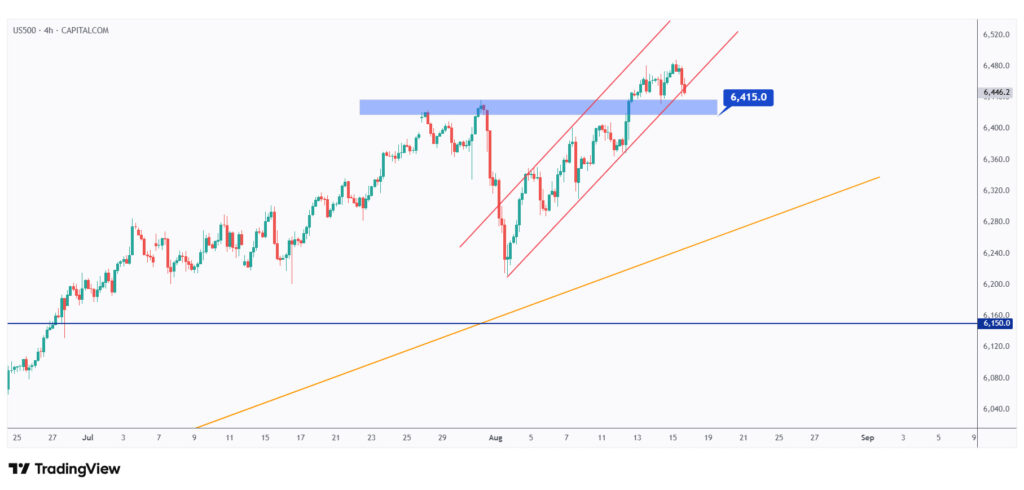
As long as the structure at $6,415 holds, the short-term bias will remain bullish.
If the $6,415 structure breaks to the downside, a bearish correction toward the lower orange trendline at $6,200 is likely.
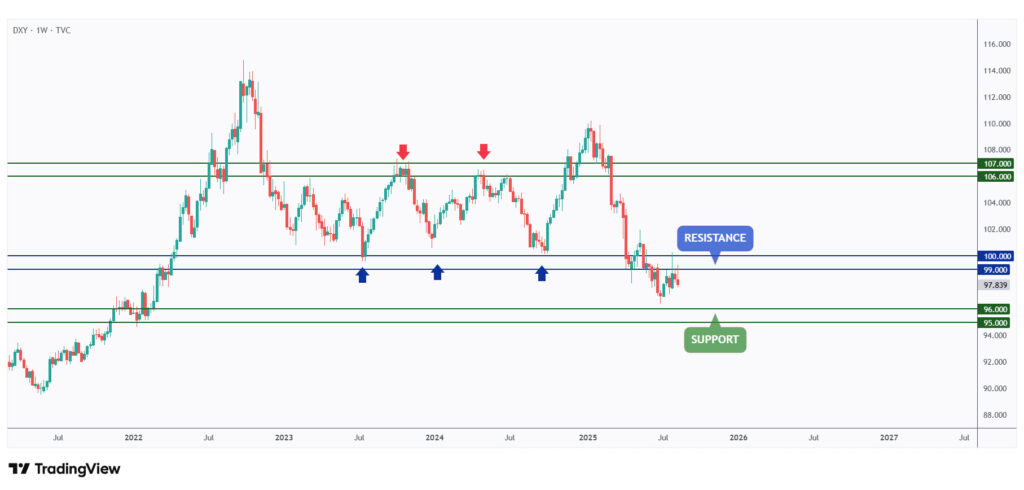
DXY maintained its bearish trend this week, which is naturally bullish for both stocks and crypto.
As long as the $100 resistance level holds, the bears will retain the upper hand in the long term.
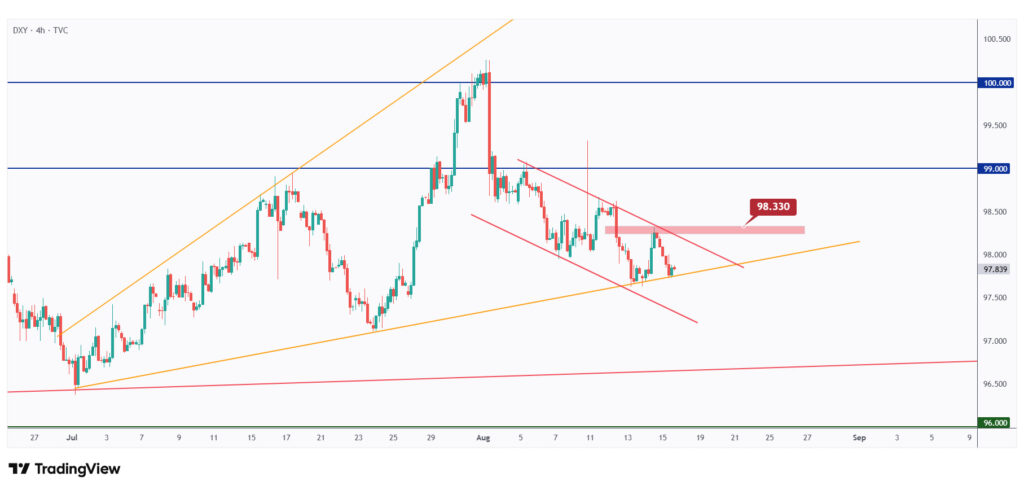
The bulls will only take control in the short term for a correction if the last major high at $98.33, marked in red, is broken to the upside.
USDT.D, Bitcoin, and Ethereum analysis
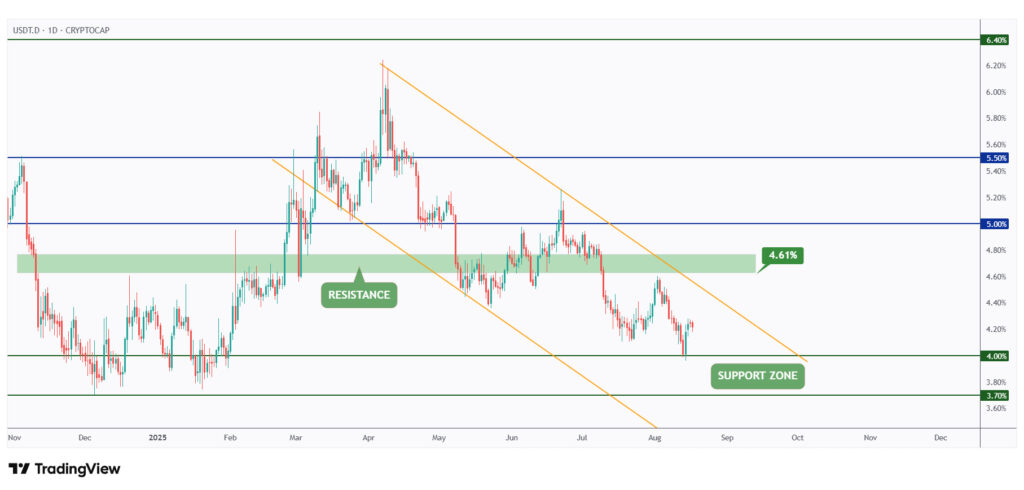
As per our last USDT.D update, it rejected the 4% support level and entered a bullish correction phase, which explains the bearish pullback in crypto.
However, the overall momentum remains bullish for crypto as long as USDT.D continues to trade within the falling orange channel.
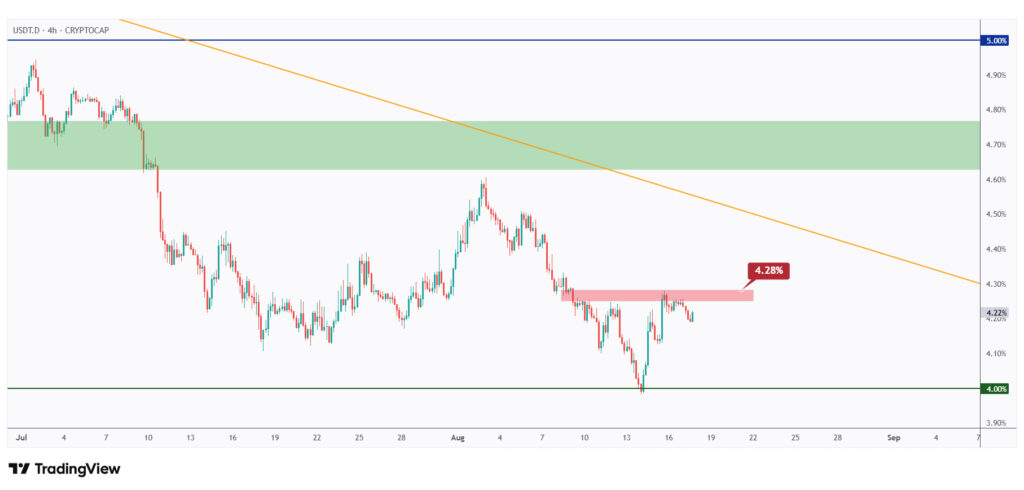
For the bulls to stay in control and trigger a larger correction phase on USDT.D, a break above the last major high at 4.28% is required.
In the meantime, further downside is expected on USDT.D, which remains bullish for crypto.
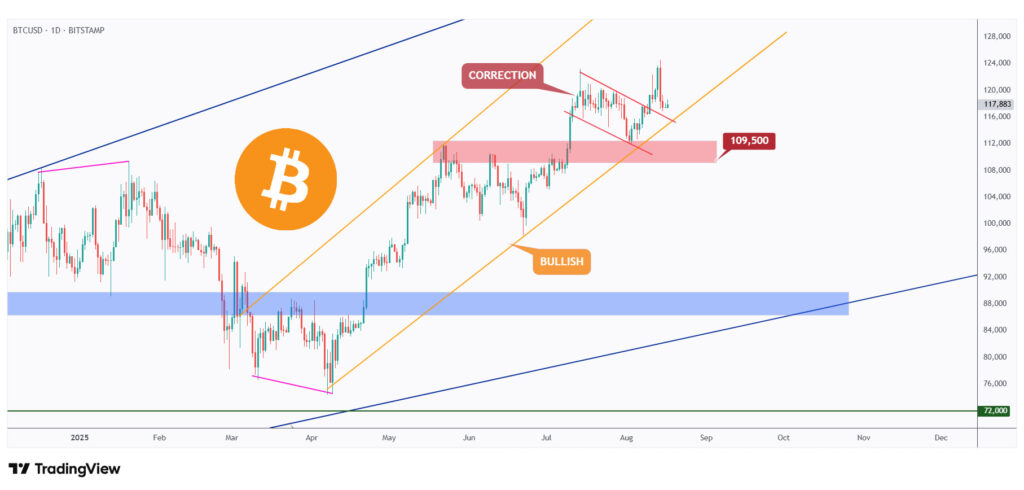
As per our last BTC update, the long-term outlook remains bullish, with price trading within the rising orange channel.
This week, after breaking above the falling red channel, BTC confirmed the start of its next bullish impulse movement.
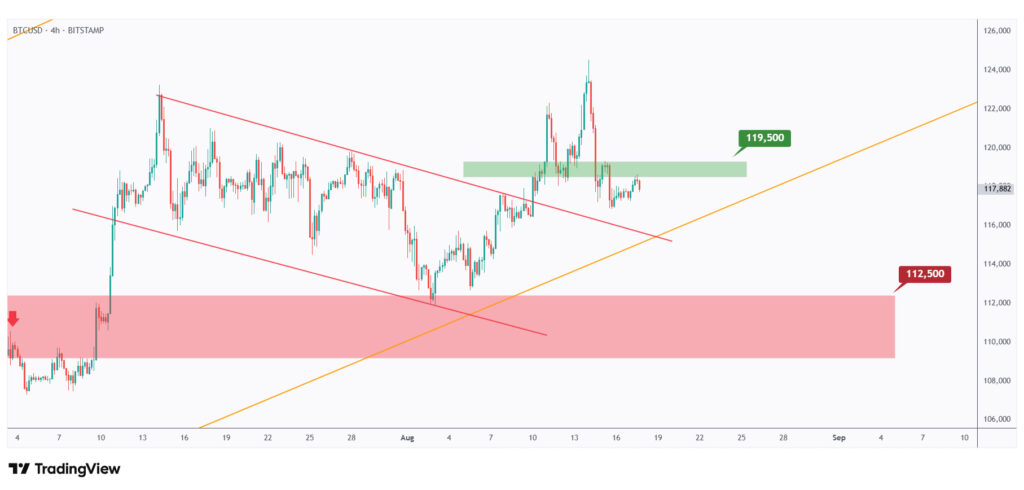
For the bulls to regain control and start the next impulse phase, a break above the last major high at $119,500, marked in green, is required.
In the meantime, BTC remains bearish in the short term and could still retest the previous daily low at $112,500.
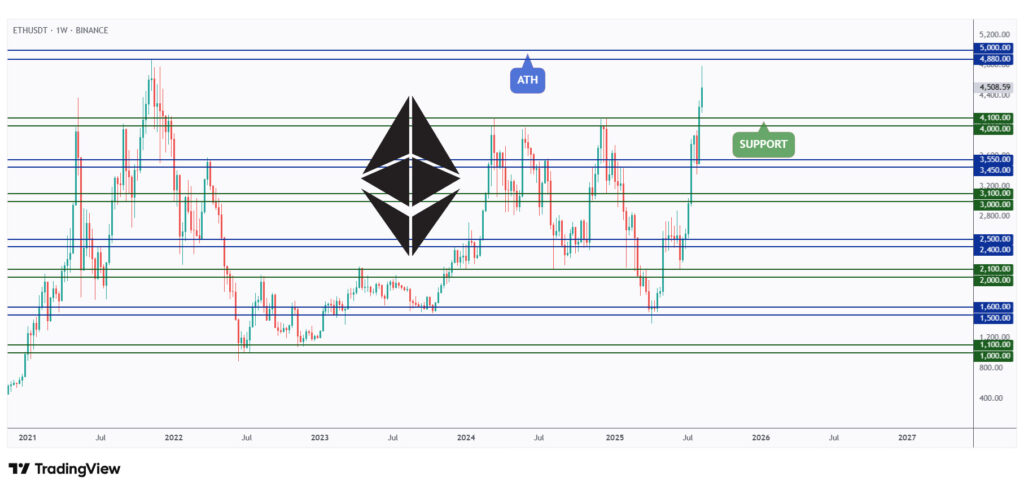
As per our last ETH analysis, after tapping the all-time high at around $4,800, the bears took control, triggering a short-term correction phase.
If bearish momentum continues, the next support zone lies around the $4,000 round number.
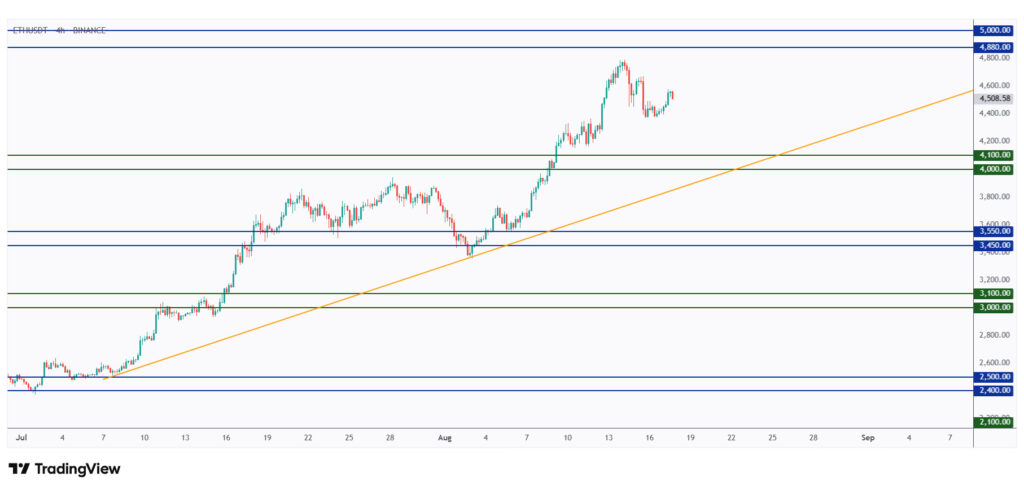
As ETH retests the $4,000–$4,100 support zone, which aligns perfectly with the orange trendline, we will be looking for trend-following longs.
Quotes / Advices
Hope is a bogus emotion that only costs you money.
~ Jim Cramer
Closing Remarks
In summary, the crypto market has entered a cooling phase after weeks of strong optimism, with ETH’s rejection at its all-time high serving as a key trigger.
Despite this pause, sentiment remains positive as reflected in the 7-day heatmap and the rising Fear and Greed Index.
US500 continues to print record highs, while DXY’s bearish trend supports risk assets.
USDT.D suggests room for further downside, which is bullish for altcoins, while BTC remains long-term bullish but faces short-term corrective pressure.
ETH, meanwhile, is consolidating around the $4,000–$4,100 support zone, offering potential opportunities for trend-following longs.