

Welcome to another crypto market outlook for the 7th of June!
War tensions have been escalating worldwide this week — from the feud between Trump and Elon, to the trade war between Trump and the rest of the world, and ongoing conflicts like Russia and Ukraine.
All of this is causing the market to shake hard, mostly to the downside.
Usually, after such weeks, when the dust settles, the market tends to rebound quickly. Will it be this coming week? Let’s find out together.
Today, we will cover the following topics:
– Market Heatmap and Fear and Greed Index
– US500 and DXY
– USDT.D, Bitcoin and Ethereum Analysis
– Quotes / Advices
– Closing Remarks
Market Heatmap and Fear and Greed Index
The crypto heatmap shows a mix of red and green sentiment. While BTC held strong and managed to close the week with nearly a 1% gain, altcoins have been struggling, with many breaking below key daily lows this week.

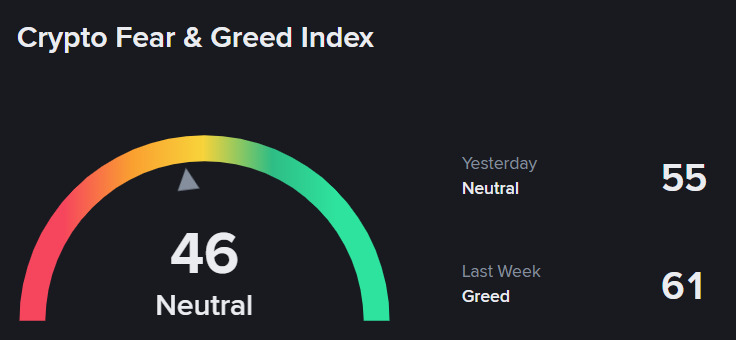
The Fear and Greed Index has remained in Neutral throughout the week, as investors remain indecisive about the overall market direction amid a mix of good and bad news globally.
US500 and DXY analysis
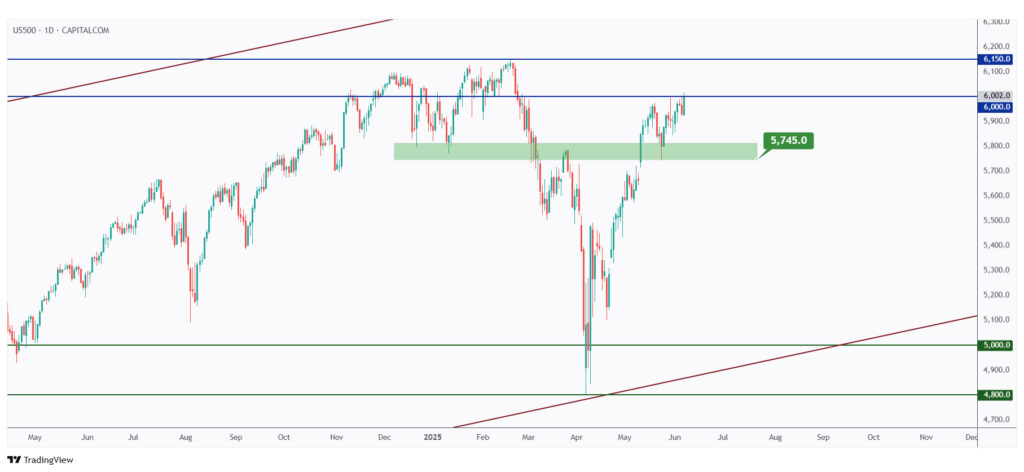
As per our latest US500 update, it is still rejecting the $6,000 round number — a sign that the stock market remains under bearish pressure, and naturally, the crypto market tends to follow.
Is the market already overbought, or is the US500 gearing up to break its all-time high at $6,150?
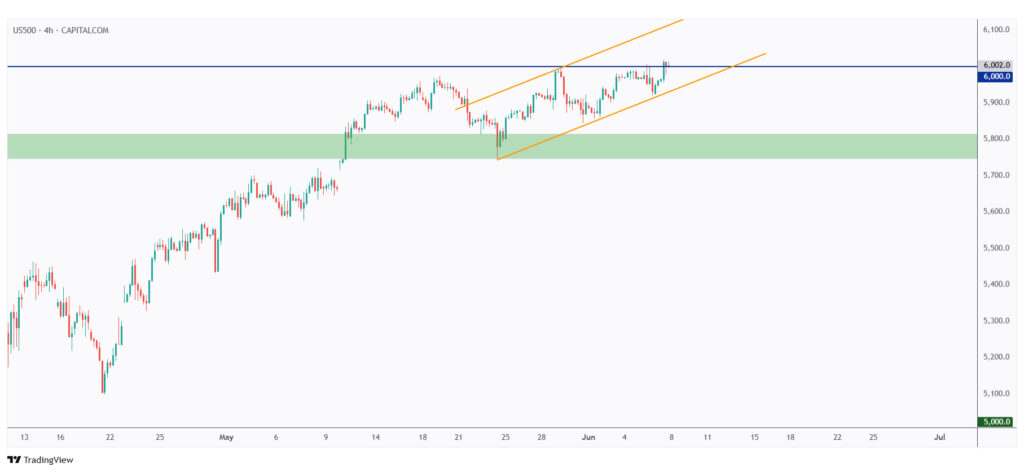
In the medium term, the US500 has been trading within a rising orange channel.
As long as this channel holds and the $6,000 level is broken to the upside, the bulls will remain in control.
However, if the lower orange trendline is broken to the downside, expect the bears to take over.
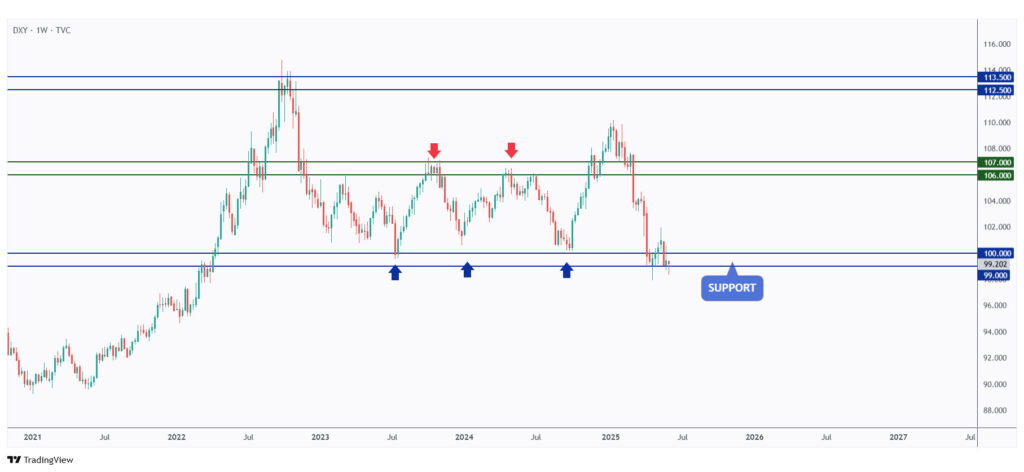
The DXY is still holding strong above the $99 support level.
If $99 is broken to the downside, expect a weaker USD in the second half of 2025.

In parallel, for USD dominance to resume — which would be bearish for both the stock and crypto markets — a break above the upper blue trendline and the $100 round number is needed.
USDT.D, Bitcoin, and Ethereum analysis

As expected in our latest USDT.D update, it rejected the 4.4% support zone marked in green.
However, this week, USDT.D is approaching a strong resistance zone and the key round number at 5%.

USDT.D is currently hovering between two strong rejection zones: the lower orange trendline and the 5% resistance.
As it approaches the lower bound of the rising orange channel, we expect a bullish movement for USDT.D — which typically signals bearish pressure for the crypto market.
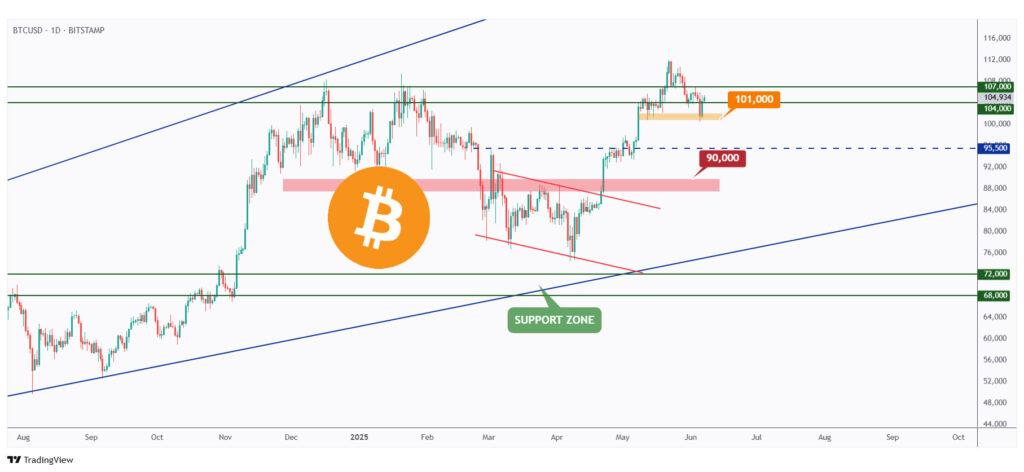
As noted in our last roundup article, BTC is still retesting a strong structure and support zone.
As long as the $101,000 level marked in orange holds, the overall bias remains bullish.
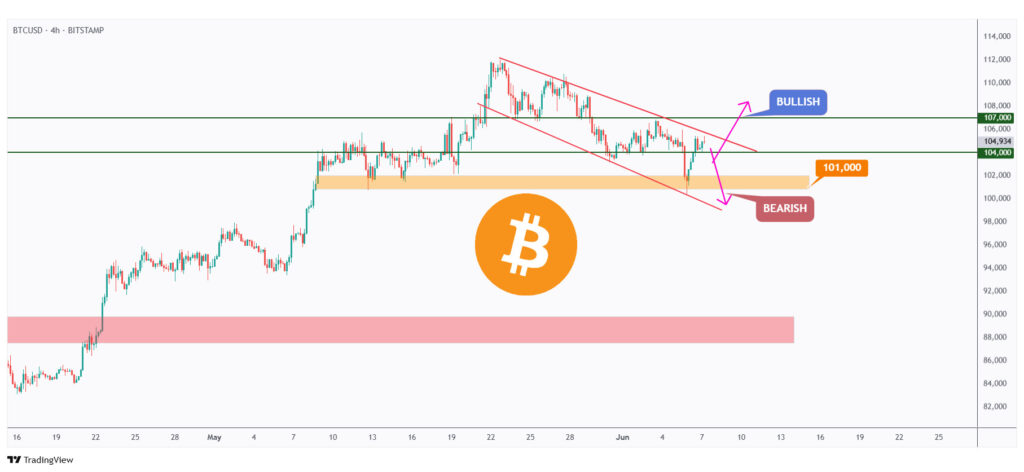
In the medium term, BTC has been bearish, trading within the falling channel marked in red.
If the $101,000 level is broken to the downside, expect a sharp drop in the crypto market as BTC retests the $95,000 support zone.
On the other hand, if BTC breaks above the upper red trendline and the $107,000 resistance, the market could turn optimistic, paving the way for new all-time highs.
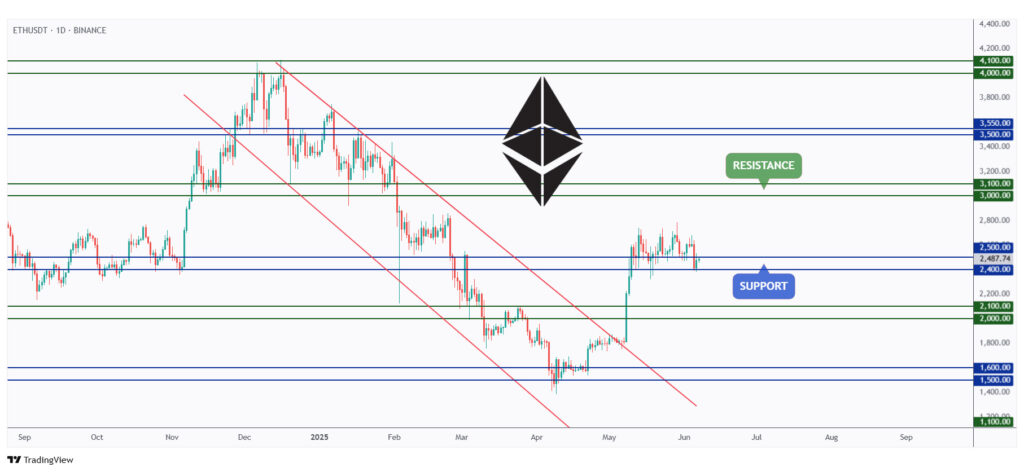
As per our latest ETH analysis, it is still holding above the lower bound of its support at $2,400.
As long as $2,400 continues to hold, we can expect further upside for ETH toward the next resistance at $3,000.
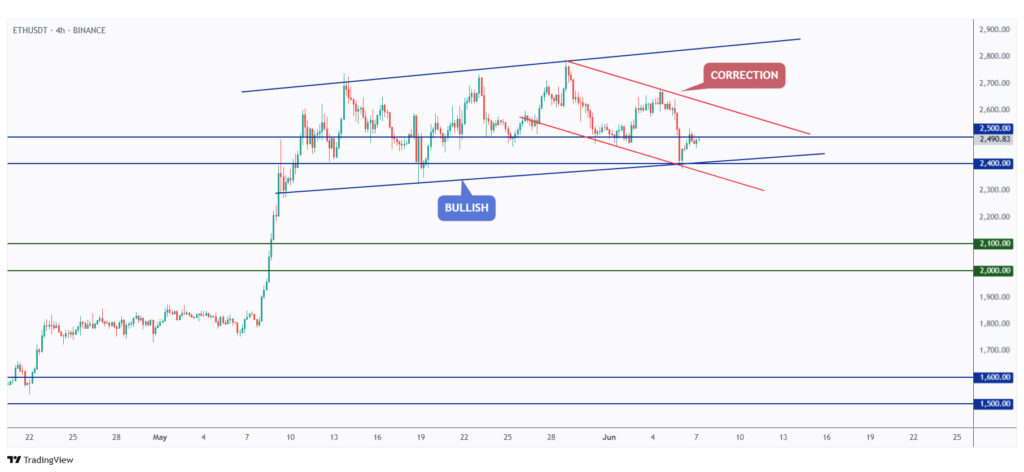
In the medium term, ETH has been in a bearish correction phase this week, trading within the falling channel marked in red.
However, from a long-term perspective, ETH remains bullish, trading within the flat rising channel marked in blue — so we expect the bulls to regain control soon.
Quotes / Advices
Amateurs look for challenges; professionals look for easy trades.
~ Alexander Elder
Closing Remarks
In summary, this week was marked by rising global tensions and mixed market signals. While BTC remained resilient with a modest gain, altcoins struggled, breaking key daily lows.
The US500 continued to reject the $6,000 level, and DXY held strong above $99. USDT.D is nearing key resistance, suggesting potential bearish pressure for crypto.
BTC remains bullish above $101,000, but a break lower could trigger a drop to $95,000. ETH is holding $2,400 support, and despite a short-term correction, its long-term trend remains bullish.