

Welcome to another crypto market outlook for the 1st of February!
While BTC remains strong above the $100,000 mark, altcoins haven’t performed well this month. Historically, the first couple of weeks in February tend to be bullish. Will this February be different? Let’s find out together.
Today, we will cover the following topics:
– Market Heatmap and Fear and Greed Index
– US500, DXY and Gold Analysis
– USDT.D, Bitcoin and Ethereum Analysis
– Quotes / Advices
– Closing Remarks
Market Heatmap and Fear and Greed Index
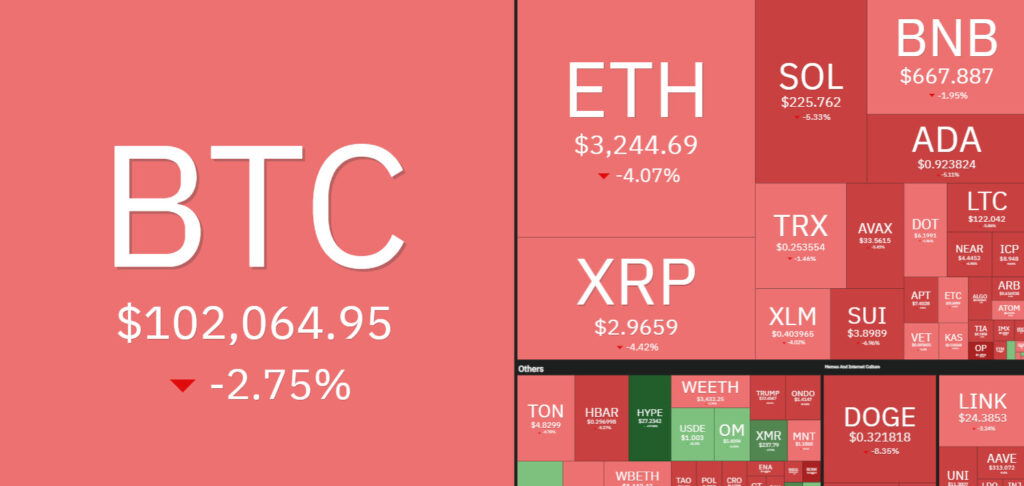
Even though BTC has remained strong above $100,000, the overall momentum last week was bearish, with a dip of -2.75%. This BTC decline impacted the entire crypto market, as almost all altcoins experienced a bearish week, starting with ETH, which dropped by -4%.
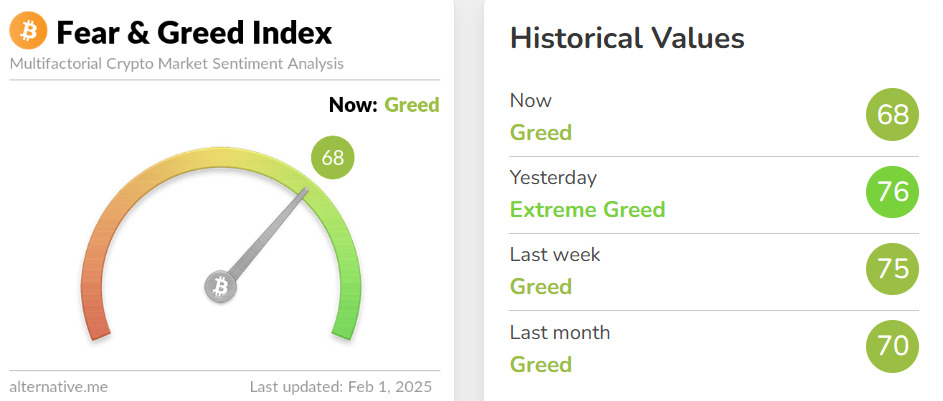
While the market was bearish throughout January, the Fear and Greed Index remained unchanged, signaling Greed for the entire month. This highlights crypto investors’ resilience during market dips.
US500, DXY, and Gold analysis
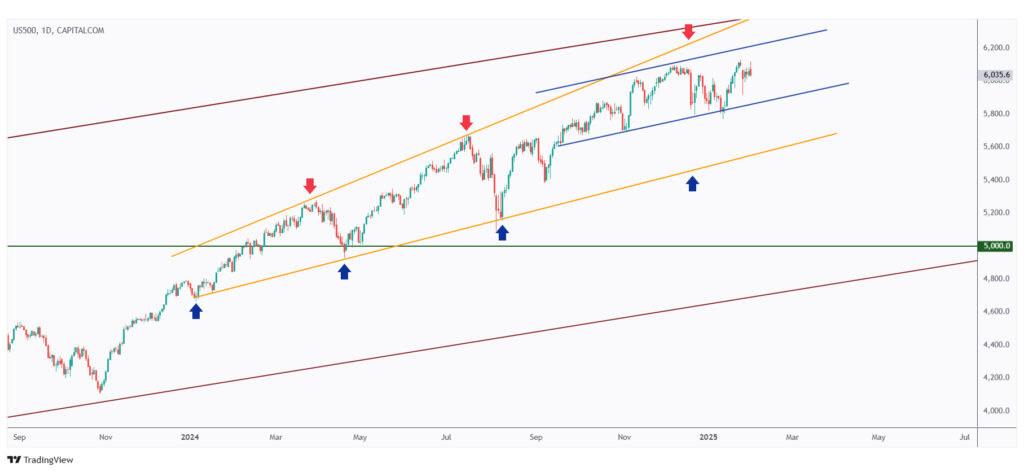
As per our last market outlook, the US500 remains overall bullish from both a medium-term and long-term perspective, trading within the rising blue and orange channels, respectively.
As long as the bulls remain in control, a continuation toward the upper orange trendline is expected.
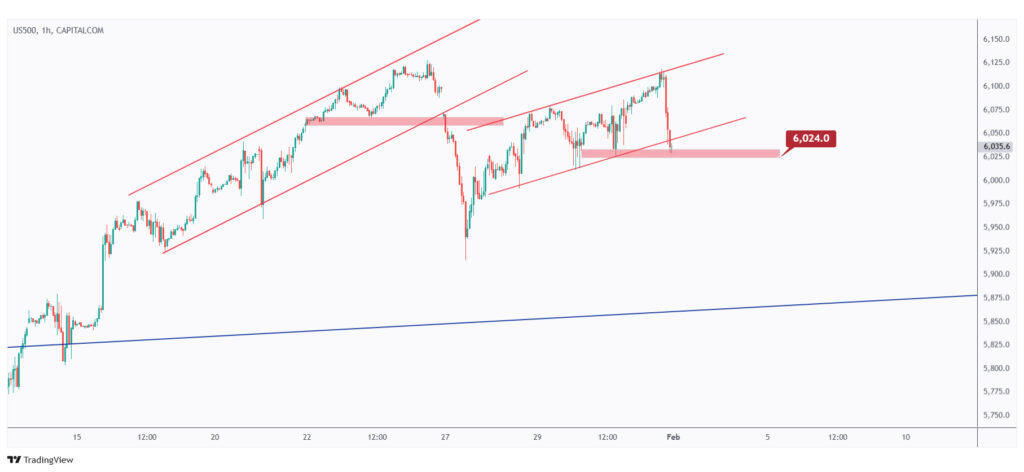
Short-term, the US500 has also been bullish, trading within the rising red channel.
The bulls will maintain control unless the last low at $6,024 is broken downward. In such a scenario, a deep bearish correction toward the lower blue trendline would be likely.
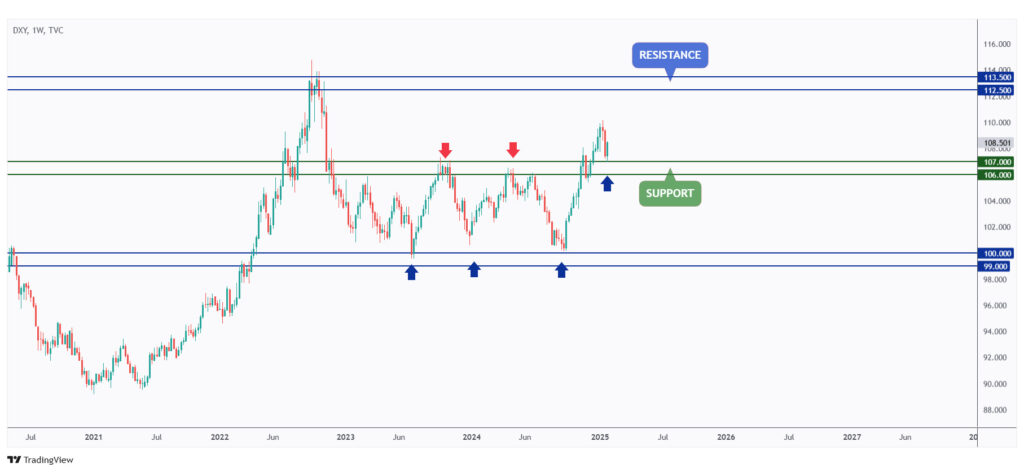
After rejecting the $107 support level, DXY has been bullish throughout the entire week.
Further upside is expected as long as the $106 support level holds.
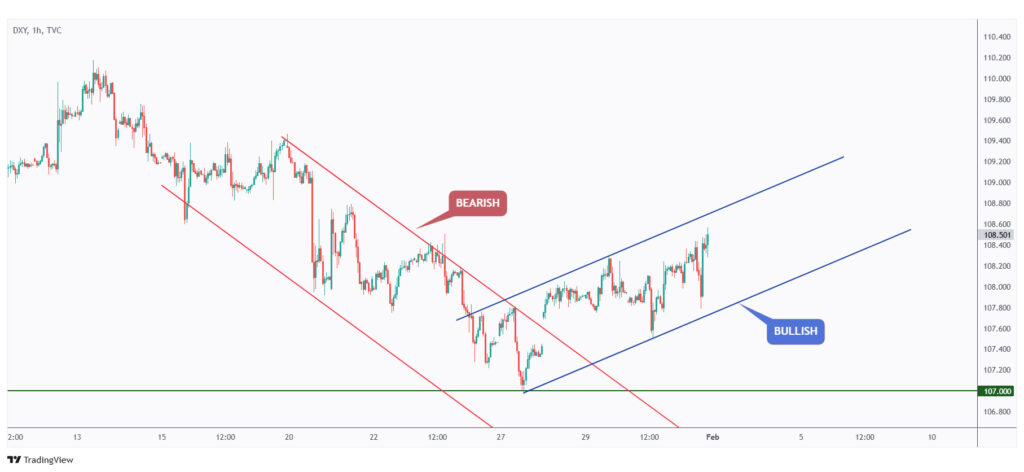
From a short-term perspective on the 1H timeframe, momentum has already shifted from bearish to bullish after breaking above the falling red channel.
The overall bias will remain bullish as long as DXY continues trading within the rising blue channel.
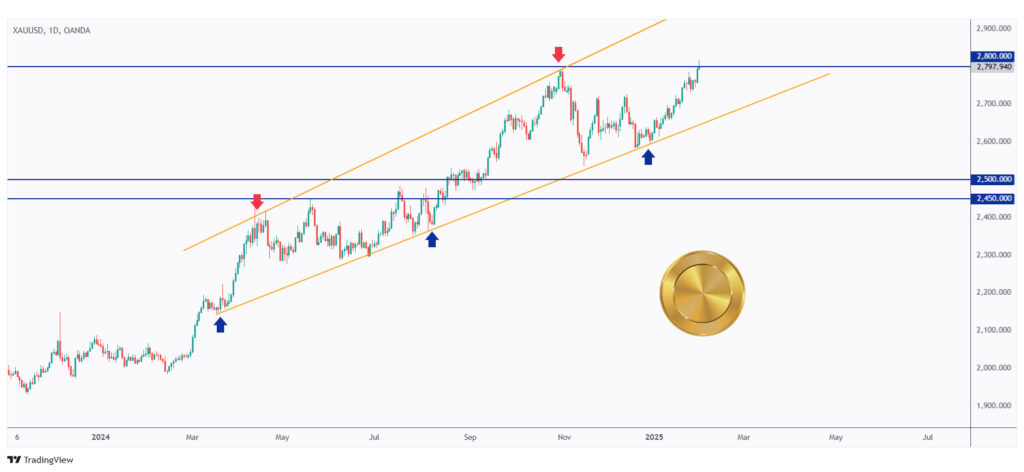
Gold is not slowing down, continuing to record new all-time highs.
For another long-term bullish wave to begin, a break above the $2,800 mark is needed.
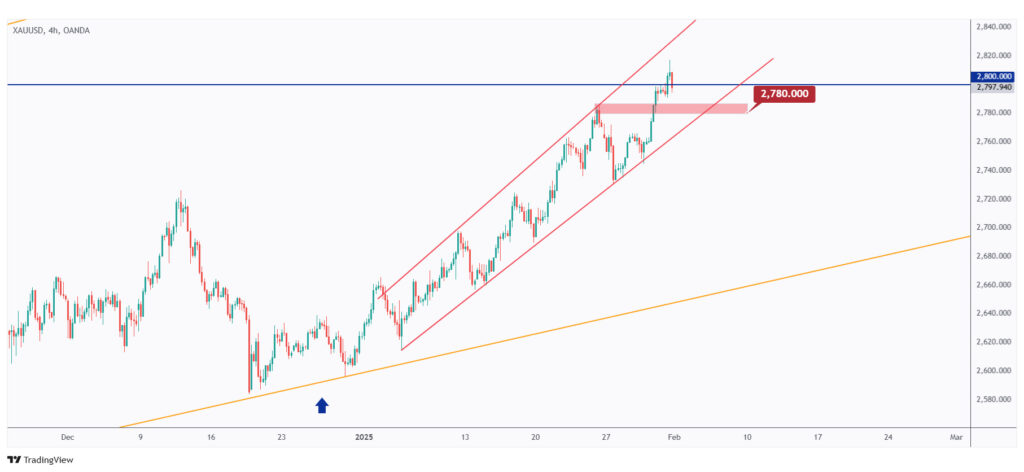
The bears will only take control if the last low at $2,780 is broken to the downside.
In such a scenario, a bearish correction toward the $2,720 structure would be anticipated.
USDT.D, Bitcoin, and Ethereum analysis
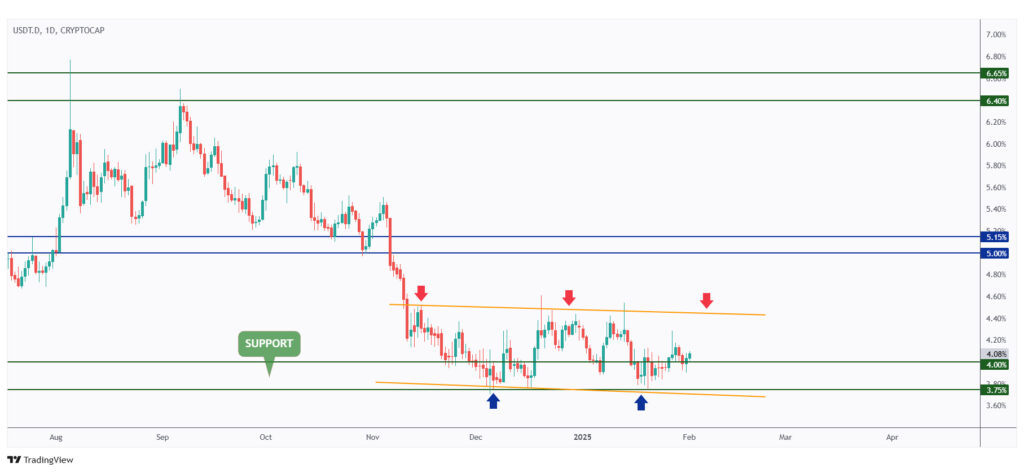
As per our last market overview, USDT.D is still hovering within a tight range between 3.75% and 4.4%.
As long as the 4% support level holds, the bias will favor the bulls, which is bearish for crypto.
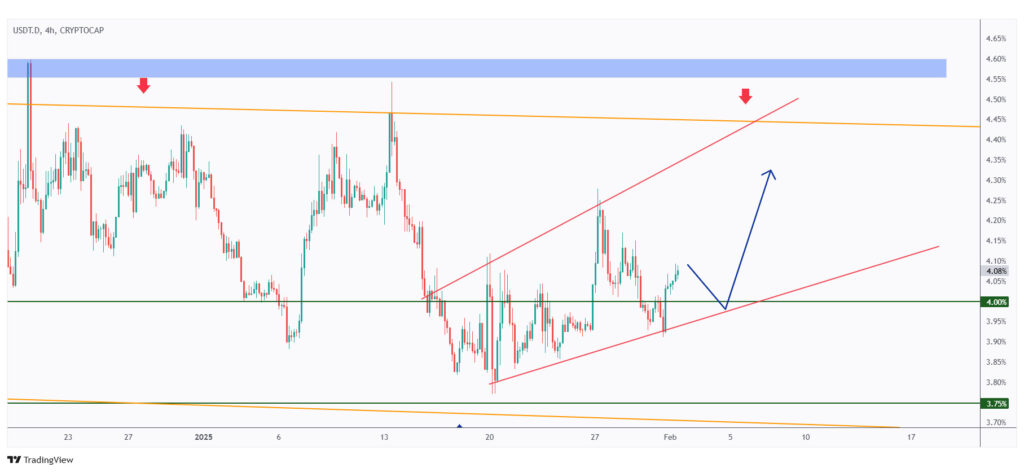
USDT.D is now bullish from a medium-term perspective, trading within the rising channel marked in red.
As long as USDT.D remains within the channel, more downside pressure on the crypto market is expected.
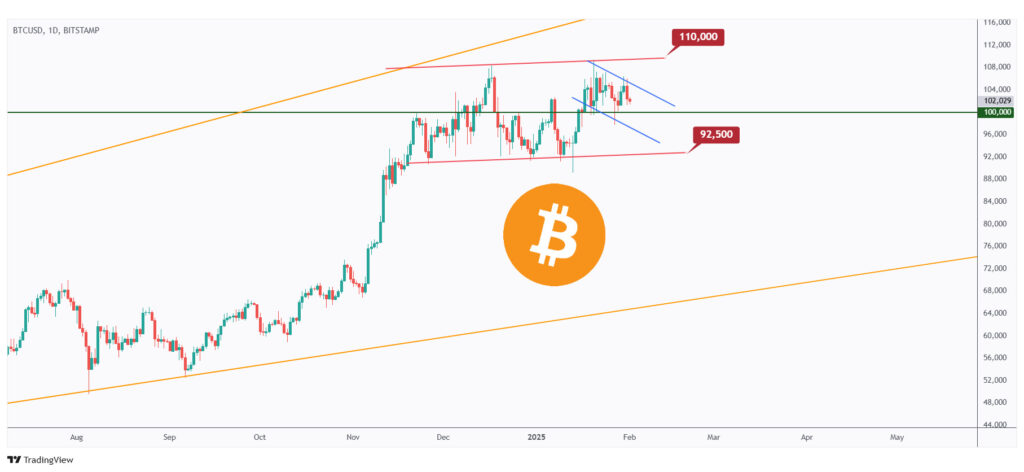
After rejecting the $110,000 level, BTC has been bearish throughout the entire week.
Currently, it is approaching the $100,000 support, a critical make-or-break zone.
If the $100,000 support is broken to the downside, a bearish continuation toward the $92,500 lower bound of the channel is expected.

In parallel, for the bulls to regain control in the short term, a break above the upper blue trendline is needed.
For a macro bullish reversal, a breakout above the $110,000 mark is required.
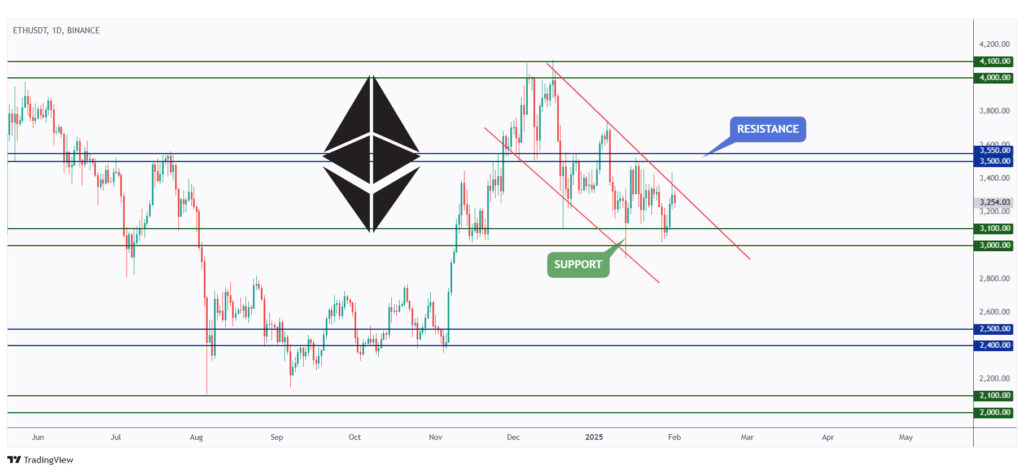
As per our last roundup article, ETH has been rejecting the upper bound of the falling channel marked in red.
Currently, it is hovering within a tight range between the $3,000 support and the upper red trendline, which is acting as a dynamic resistance.
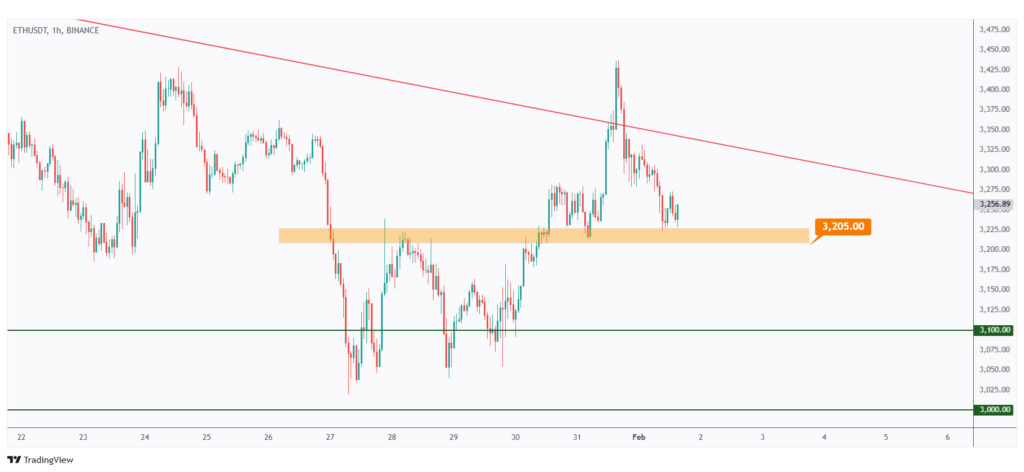
As long as the $3,205 structure marked in orange holds, the overall short-term bias will remain bullish.
If the $3,205 level is broken downward, a deeper bearish correction toward the $3,000–$3,100 support zone would be on the horizon.
Quotes / Advices
Hope is not a strategy.
~ Anonymous
Closing Remarks
In summary, despite a bearish January, the Fear and Greed Index signaled Greed, showcasing investor resilience.
US500 continues its bullish trend, while DXY has strengthened after rejecting $107, maintaining a bullish outlook above $106.
Gold remains in price discovery, with another bullish wave requiring a break above $2,800.
USDT.D is trending higher, suggesting further downside pressure on crypto.
BTC faces a make-or-break moment at $100,000, with further downside possible toward $92,500 if broken.
ETH remains range-bound, with $3,205 acting as a key level for short-term direction.