

After ETH reached a slight new all-time high, the crypto market hasn’t seen a bullish week since. This week, almost all altcoins — including ETH — are approaching a key weekly support zone. It’s a make-or-break level that will determine whether we see a bullish reversal or a deeper correction phase.
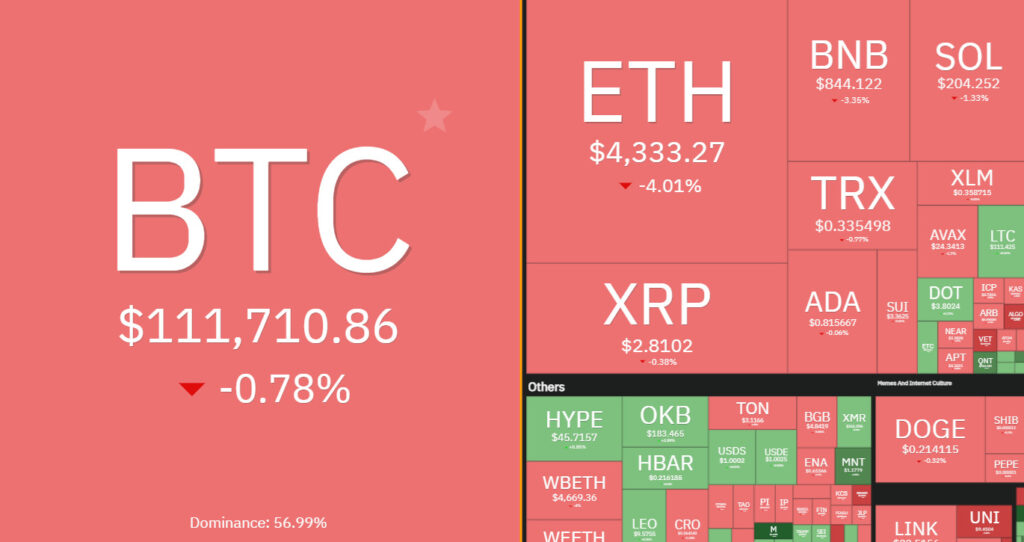
7 Days Heatmap
The 7-day crypto heatmap shows an overall bearish sentiment, with BTC down nearly 1% and ETH dropping more than 4%. Altcoins have also had a rough week so far.
BTC Analysis
According to our latest BTC analysis, the overall outlook remains bullish despite the recent correction.
As long as the rising channel marked in blue holds, we’ll continue looking for trend-following long opportunities.
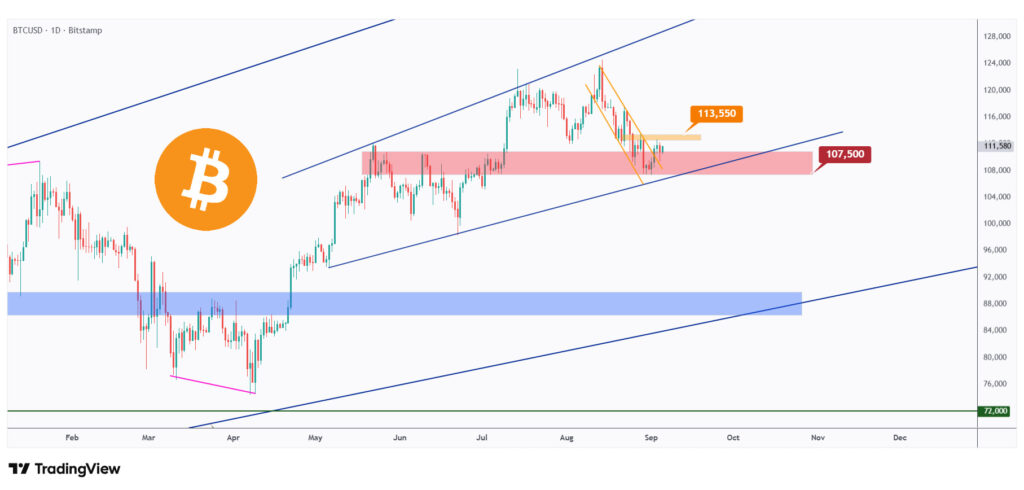
For the bulls to trigger the next upward impulse, a break above the last major high at $113,550 (marked in orange) is required.
On the other hand, if the last low at $107,500 breaks to the downside, we could see further bearish pressure toward the $100,000 round number.
ETH Analysis
According to our latest ETH analysis, after rejecting the $5,000 round number, ETH has entered a bearish correction phase.
This week, it has been trading within the falling red channel.
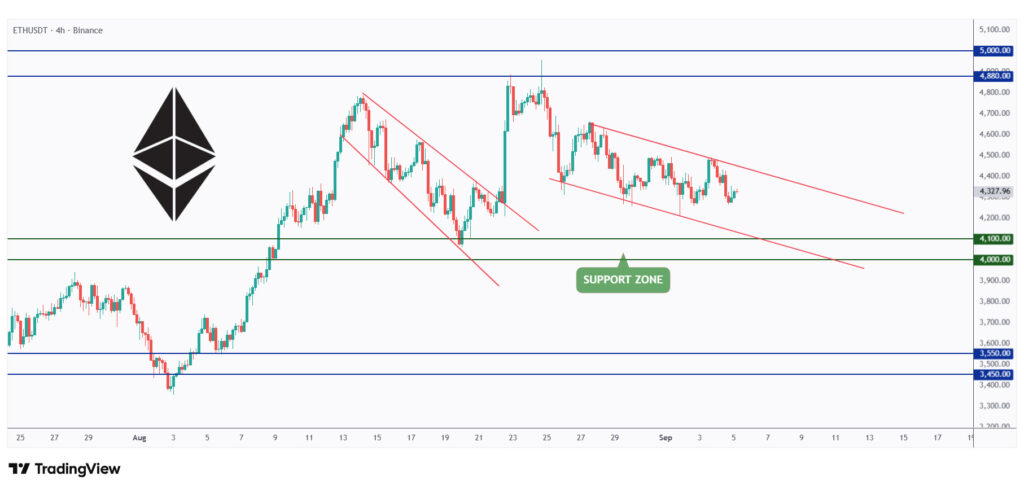
As ETH approaches the lower bound of the channel, which aligns with the $4,000 round number, we’ll be looking for long opportunities.
For the bulls to take full control, a breakout above the upper red trendline is required.
Quote of the week
Never, ever argue with your trading system.
~ Michael Covel
Closing Remarks
In summary, the crypto market remains at a decisive point. After ETH’s recent all-time high, both BTC and ETH have entered corrective phases, with altcoins following suit.
BTC’s structure is still bullish as long as the rising channel holds, with $113,550 as the key breakout level for upside momentum and $107,500 as the critical support.
ETH, meanwhile, is consolidating within a falling channel, with $4,000 acting as a potential rebound zone and the upper red trendline as the trigger for bulls to regain control.