

Welcome to another crypto market outlook for the 25th of October!
After being uncertain for a couple of weeks, the crypto market is finally catching its breath again and starting to move up steadily. But will this bullish correction be followed by another bearish impulse, or are the bulls taking full control again? Let’s find out together in this article.
Today, we will cover the following topics:
– Market Heatmap and Fear and Greed Index
– US500 and DXY
– USDT.D, Bitcoin and Ethereum Analysis
– Quotes / Advices
– Closing Remarks
Market Heatmap and Fear and Greed Index
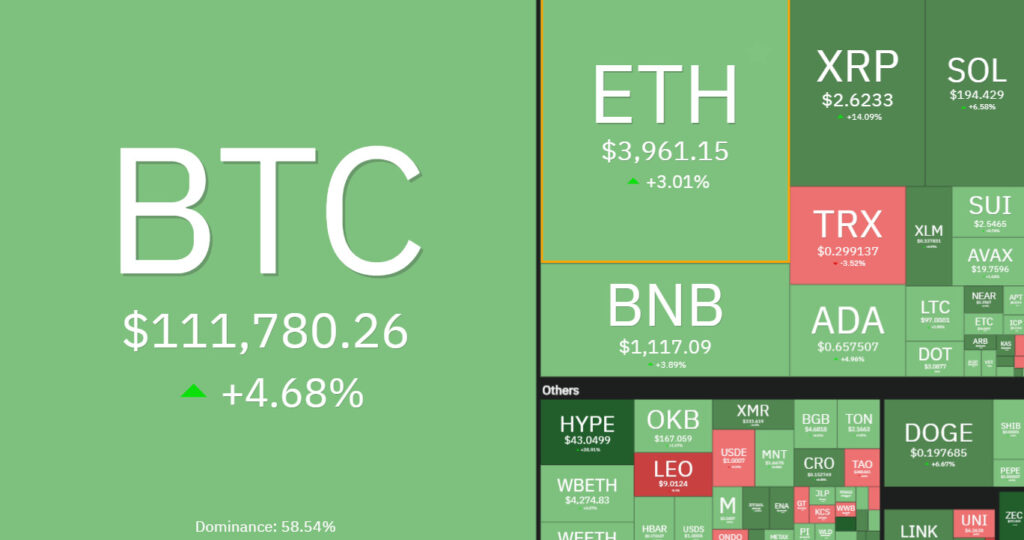
The 7-day crypto heatmap is finally showing signs of hope again, as both BTC and ETH are closing the week on a bullish note, with BTC up nearly 5% and ETH up about 3%.
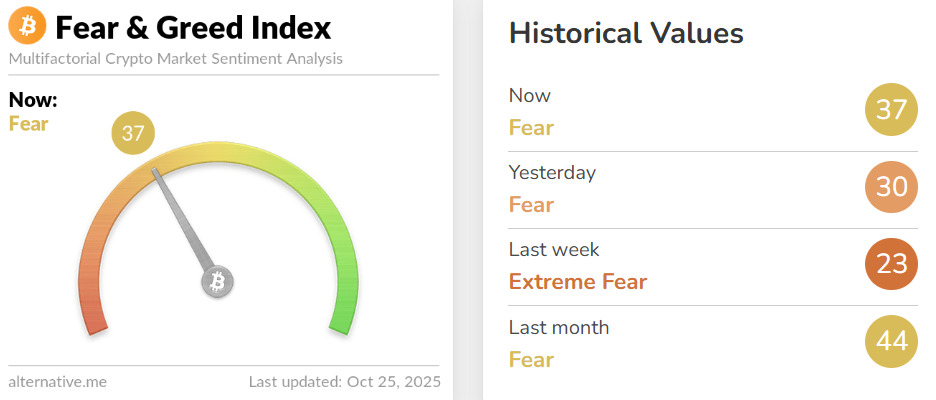
The Fear and Greed Index has shifted from Extreme Fear to Fear this week, indicating early signs of relief in the market.
US500 and DXY analysis
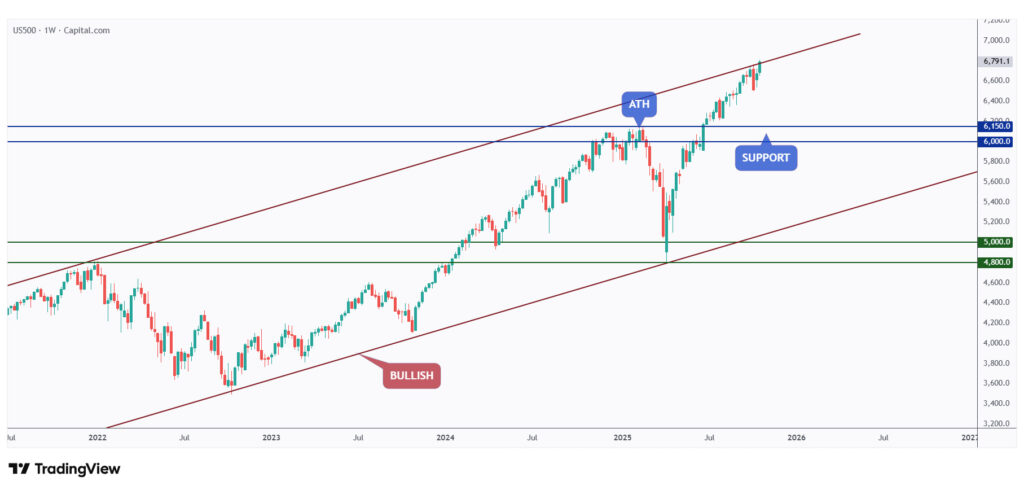
The US500 continues to record new all-time highs each week, showing no signs of weakness in the global stock market.
This indicates that the bulls remain strong and healthy, at least in the stock market.
In the medium term, the US500 broke above its previous all-time high this week, signaling the start of a new price discovery phase.
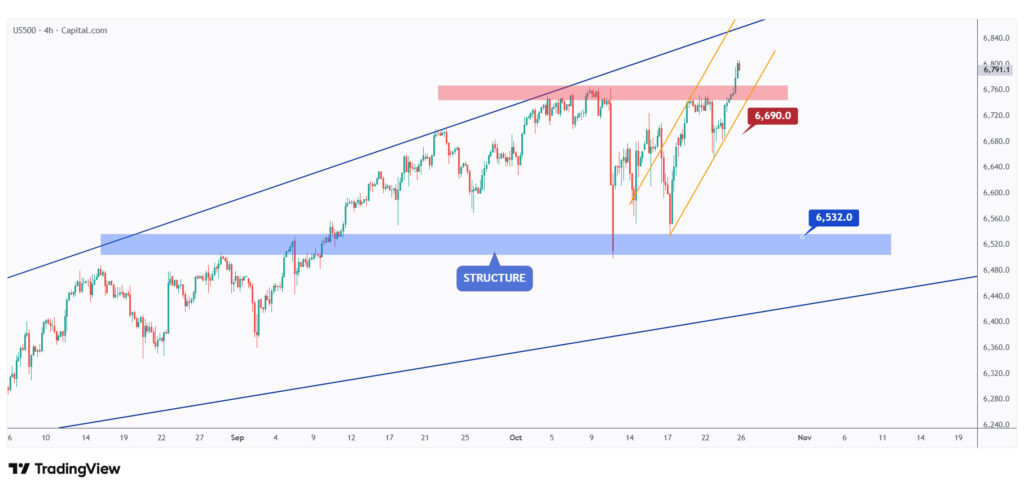
As long as the price holds within the rising orange channel and above the last low at $6,690, the overall bias remains bullish.
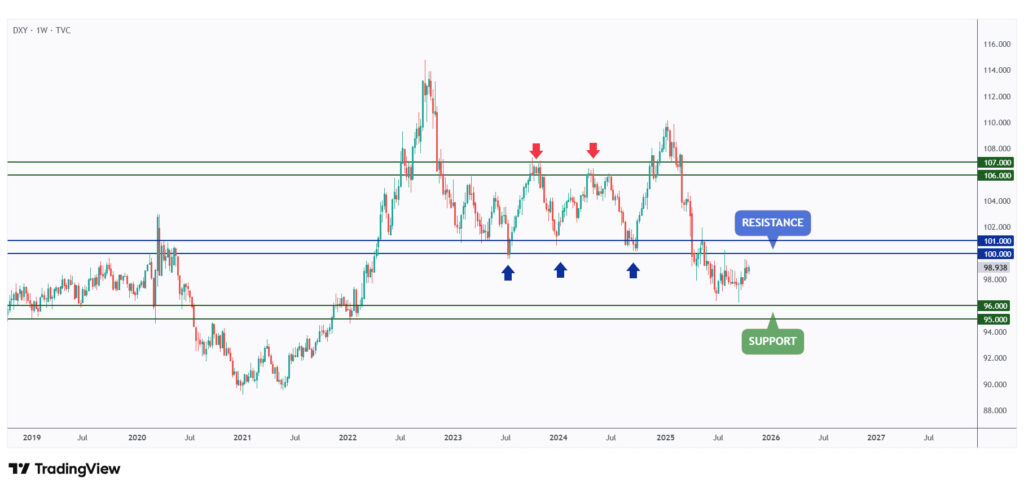
DXY is approaching the upper boundary of its range at $100, suggesting that a potential bearish movement for the USD may be near, which would, of course, be bullish for both the stock and crypto markets.
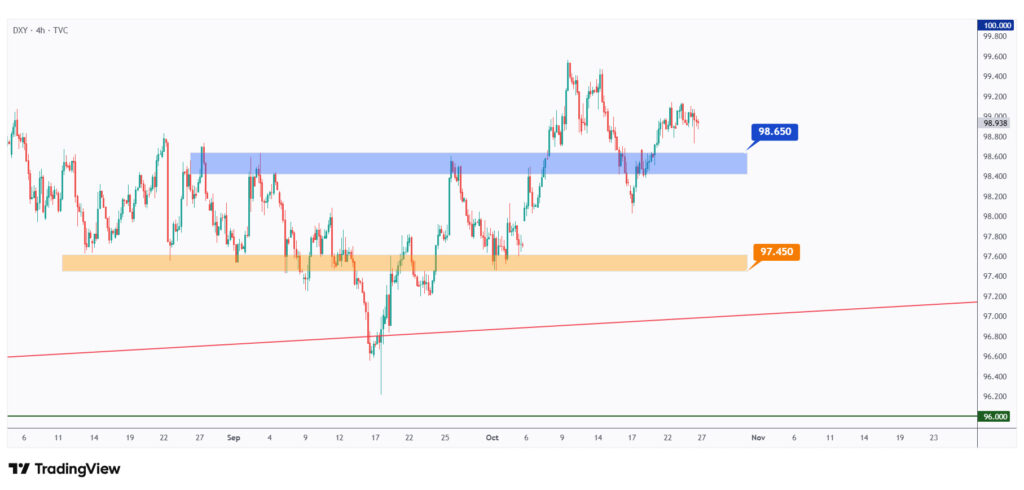
As long as DXY holds above the structure at $98.65, the overall momentum will remain bullish, and a move toward the $100 resistance level can be expected.
USDT.D, Bitcoin, and Ethereum analysis
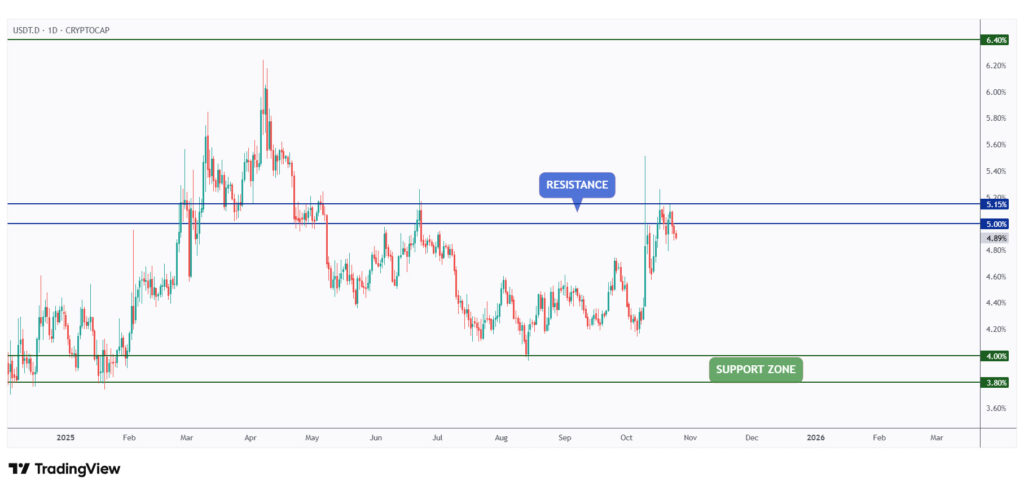
As per our latest USDT.D update, it is back around the 5%–5.15% zone, a major weekly resistance level.
As long as the 5.15% resistance holds, we can expect USDT.D to move lower, which would be bullish for the crypto market.
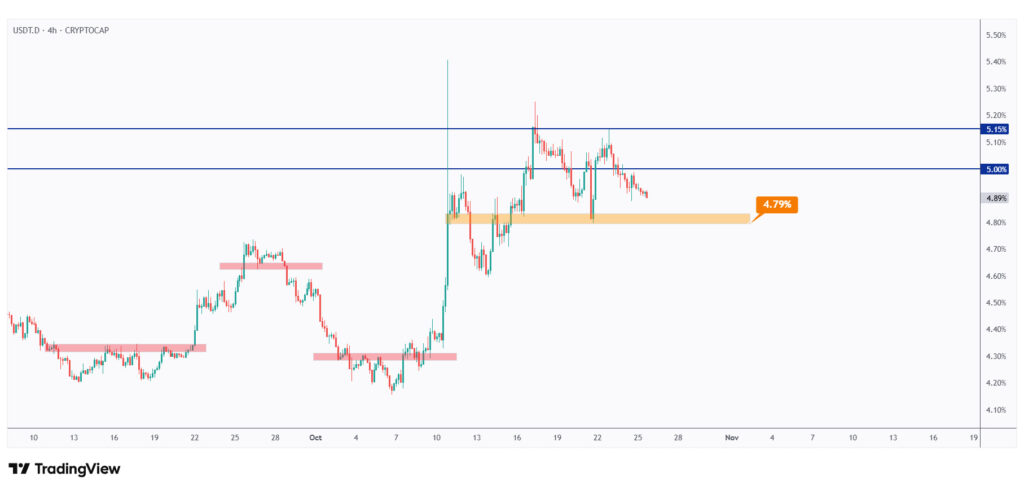
For the bears to take control of USDT.D and signal the start of the next bullish phase for crypto, a break below the last low at 4.79% is needed.
In the meantime, USDT.D is likely to remain stuck within its current range, indicating a sideways market for the broader crypto sector.

As per our latest BTC analysis, as long as it trades above the $105,000 mark, the overall bias remains bullish.
However, if $105,000 is broken to the downside, further bearish movement toward the $100,000 round number can be expected.
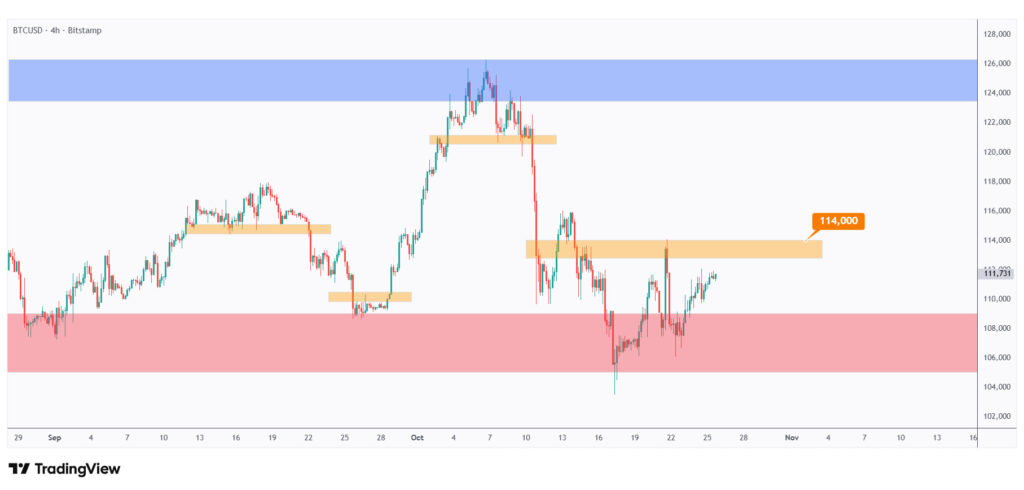
For the bulls to regain short-term control and push toward the upper boundary of the range at $125,000, a break above the last high at $114,000 is required.

As per our latest ETH update, it remains overall bearish as long as it trades below the $4,000–$4,100 resistance zone.
For the bulls to finally take full control, a daily candle close above $4,100 is required.

In the medium term, ETH has been trading within a large symmetrical triangle marked in orange.
For the bulls to take control, a break above the last major high at $4,115 is required.
In the meantime, ETH could still retest the lower boundary of the symmetrical triangle.
Quotes / Advices
Most traders take a good system and destroy it by trying to make it into a perfect system.
~ Robert Prechter
Closing Remarks
In summary, the crypto market is showing early signs of recovery after weeks of uncertainty. BTC and ETH closed the week higher, while sentiment improved from Extreme Fear to Fear, hinting at a possible shift in momentum.
The global stock market remains strong, with the US500 reaching new all-time highs, while DXY nears key resistance, a potential bullish signal for risk assets.
USDT.D is testing major resistance, and a drop below 4.79% could confirm renewed bullish strength for crypto. BTC continues to hold above $105,000, maintaining its bullish structure, while ETH remains capped below $4,100, trading inside a symmetrical triangle.