
Welcome to another crypto market outlook for the 16th of November!
Half of November has already passed, and the crypto market is still dumping! Many traders are calling it the top, while others are still waiting for one more impulse movement before the cycle ends. Let’s go over the possibilities together.
Today, we will cover the following topics:
– Market Heatmap and Fear and Greed Index
– US500 and DXY
– USDT.D, Bitcoin and Ethereum Analysis
– Quotes / Advices
– Closing Remarks
Market Heatmap and Fear and Greed Index
The 7-day crypto heatmap is still bleeding, with almost everything in red. Only a few privacy tokens like ZEC and XMR are standing strong.

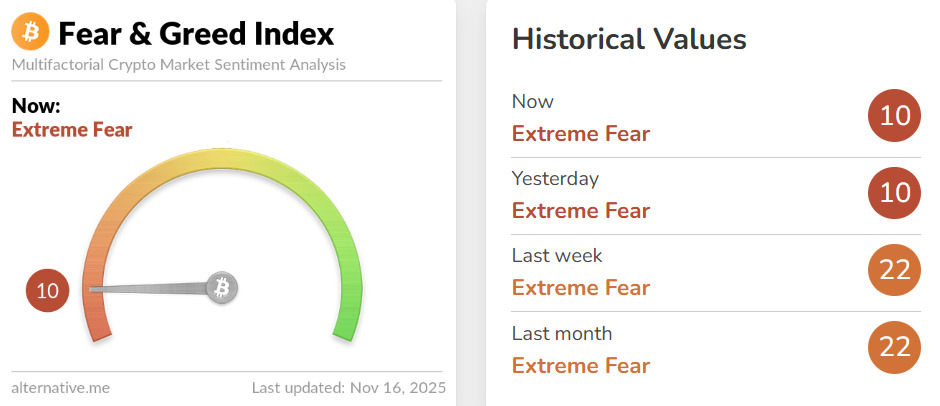
The Fear and Greed Index is signaling “Extreme Fear,” which usually signals a local bottom, so we will be waiting for price action confirmation for the bulls to take over.
US500 and DXY analysis
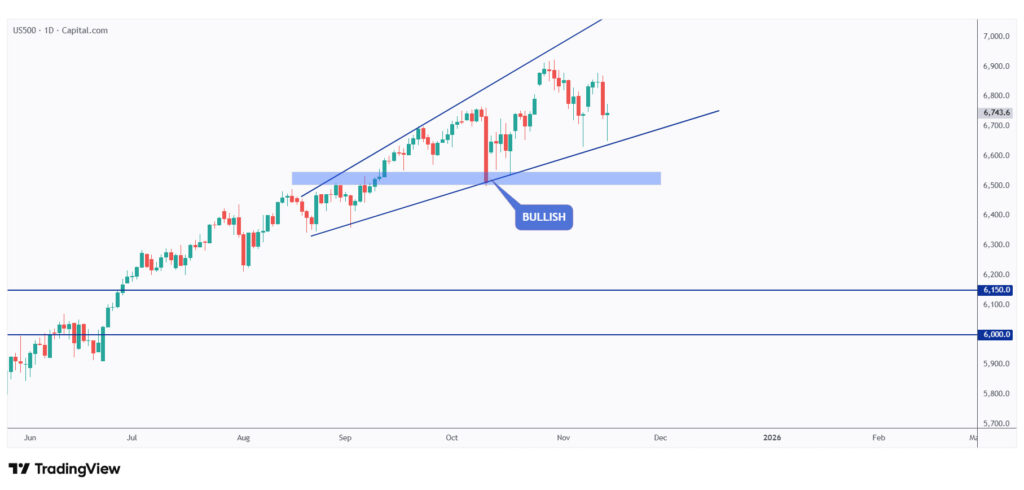
As mentioned in our last market outlook, US500 remains overall bullish as long as it trades within the rising wedge pattern marked in blue.
Since US500 is retesting the lower bound of the wedge, we will be looking for longs on lower timeframes to confirm the start of the next impulse.

Medium-term, US500 has been in a major correction phase marked in red.
As it approaches the lower bound of both the red and blue channels, it will be entering a strong support zone where we will be looking for longs.

DXY is still bearish long term despite the recent bullish movement.
As long as it trades below the $100 mark, we expect a weaker USD moving forward, which is usually good for crypto.

Medium-term, DXY has been bullish, trading within the rising channel marked in red.
If the channel breaks downward, a bearish movement toward $98.65 would be expected.
USDT.D, Bitcoin, and Ethereum analysis

As per our latest USDT.D update, it has been trading within a large range from a long-term perspective, forming a symmetrical triangle marked in red.
Moreover, USDT.D is retesting a strong resistance and the 6% round number.
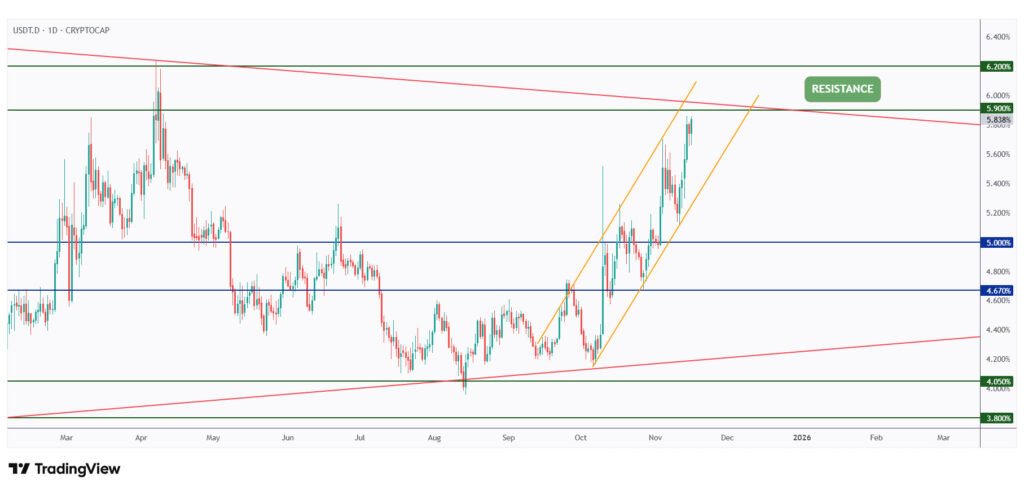
From the daily timeframe, USDT.D is also retesting the upper bound of its rising channel marked in orange, which is an overbought zone.
Thus, as long as the upper bound of the resistance at 6.2% holds, we will be expecting a weaker USDT.D moving forward, which would be bullish for crypto.
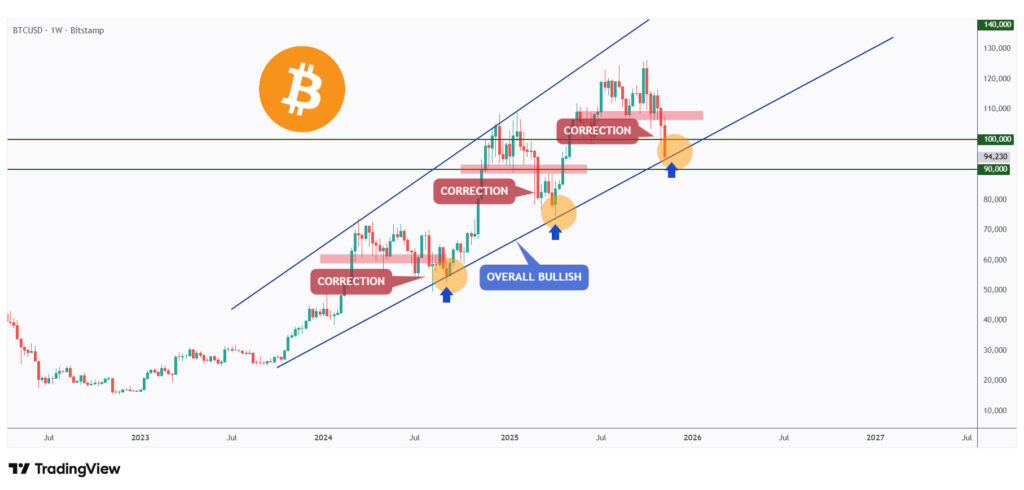
As per our latest BTC analysis, it has been in a correction phase after breaking below the last major low marked in red.
However, for the bulls to remain in control long term, they need to defend the $90,000 support level.

Moreover, from the daily timeframe, BTC is approaching the lower bound of its falling channel marked in red, which is considered an oversold zone.
Thus, as long as the $90,000 level holds as support, we expect the bulls to kick in soon.

As per our latest ETH update, it is still holding above the $2,900 to $3,000 support zone.
Moreover, it is retesting the lower bound of its falling wedge pattern marked in red, acting as a non-horizontal support.

For the bulls to shift the momentum in their favor short term, a break above the last major high marked in orange at $3,270 is needed.
Then, for the bulls to take over long term, a break above the upper red trendline is required.
Quotes / Advices
Bull markets are born on pessimism, grow on skepticism, mature on optimism and die of euphoria.
~ John Templeton
Closing Remarks
In summary, The crypto market remains under pressure, but several key indicators suggest we may be nearing a potential reversal.
The heatmap is still red, yet extreme fear readings and major assets approaching strong support zones could signal a shift soon. US500 is retesting key demand levels, DXY remains bearish below $100, and USDT.D is hitting resistance.
BTC is holding around the crucial $90,000 support, while ETH is retesting a major non-horizontal support within its falling wedge. If both can hold their zones and break their short-term resistances, the bulls may soon regain control.