Welcome to another crypto market outlook for the 12th of July!
The market is finally turning bullish again — get ready for a hot summer, not just in temperature, but in your portfolio as well. This is the end-of-cycle moment we’ve all been waiting for. If history repeats itself, this bullish phase could last until the end of 2025.
Today, we will cover the following topics:
– Market Heatmap and Fear and Greed Index
– US500 and DXY
– USDT.D, Bitcoin and Ethereum Analysis
– Quotes / Advices
– Closing Remarks
Market Heatmap and Fear and Greed Index
The 7-day crypto heatmap is screaming bullish once again, with BTC up over 9% in just a few days — lifting the entire market with it, especially XRP, which has surged more than 27%.
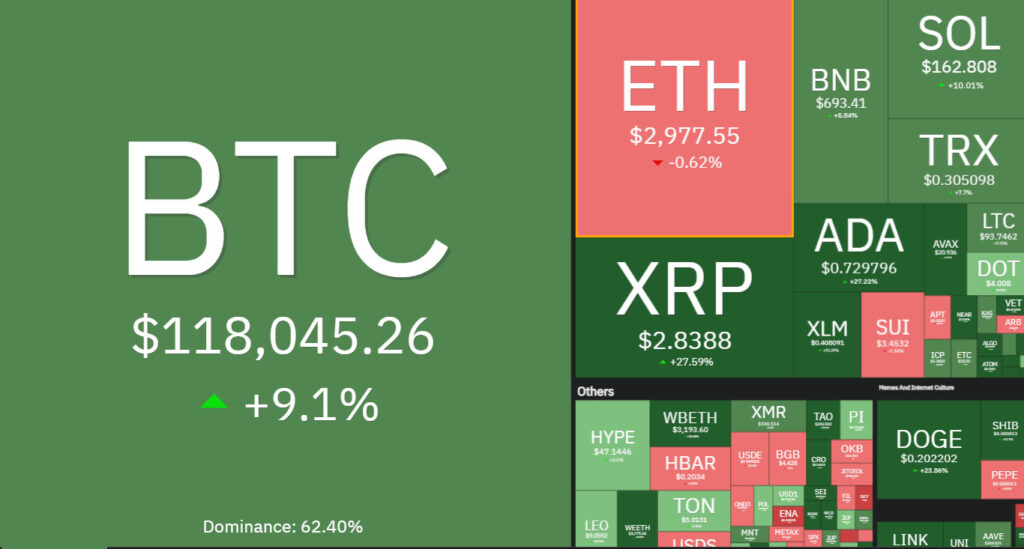
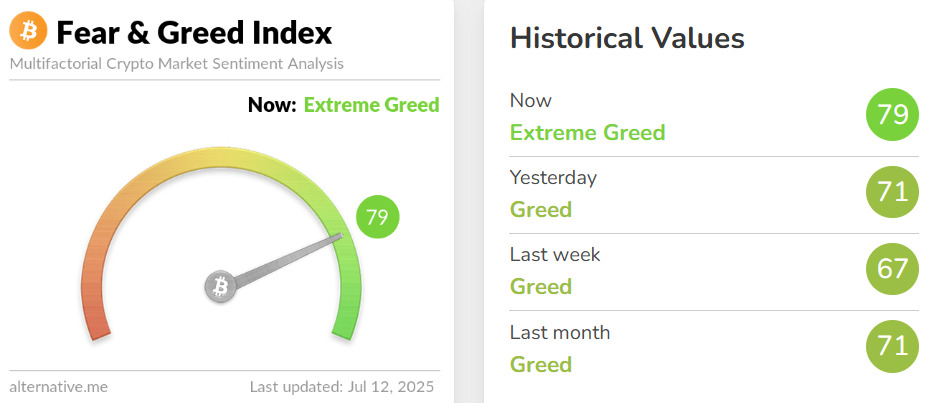
The Fear and Greed Index is showing “Extreme Greed” for the first time in months — a strong sign that altcoin season has officially begun.
US500 and DXY analysis

As mentioned in our last US500 analysis, breaking above its all-time high paved the way for crypto to breathe again.
It’s not just the stock market showing optimism now — risk-on assets like crypto are rallying too.
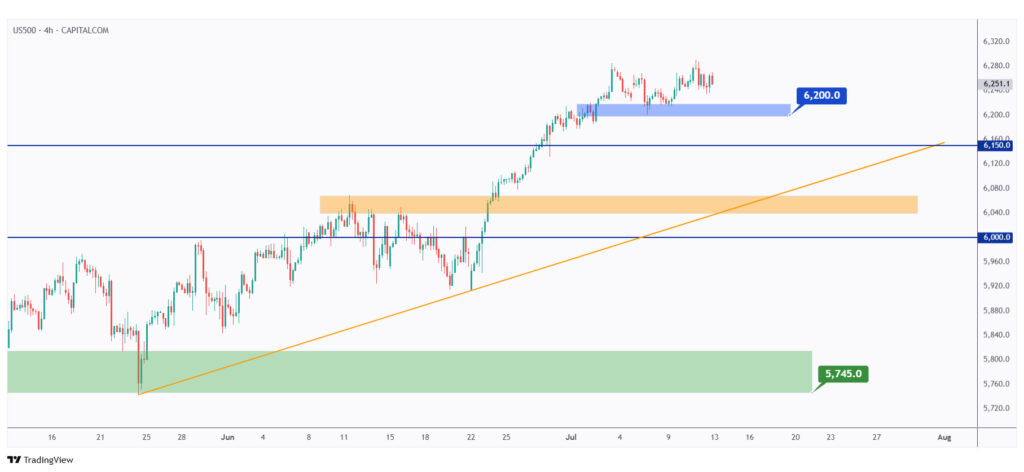
The bulls will remain in control in the short term, as long as the last low marked in blue at $6,200 holds.
If the $6,200 low is broken to the downside, expect a bearish correction toward the previous major high marked in orange.
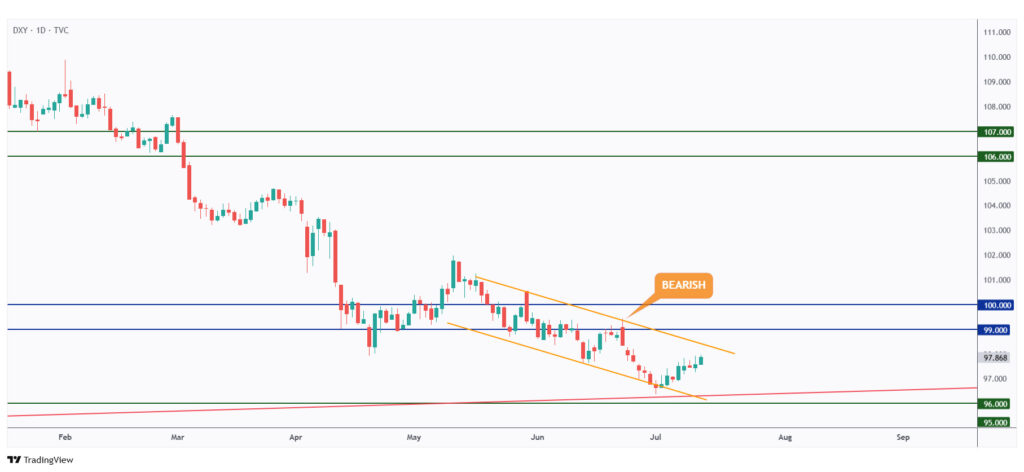
As expected, DXY rejected the lower red and orange trendlines, which are acting as an oversold zone, and is currently gaining strength again.
However, it’s now approaching the upper bound of its falling orange channel, so we expect a weaker USD next week — which would be a positive sign for crypto.
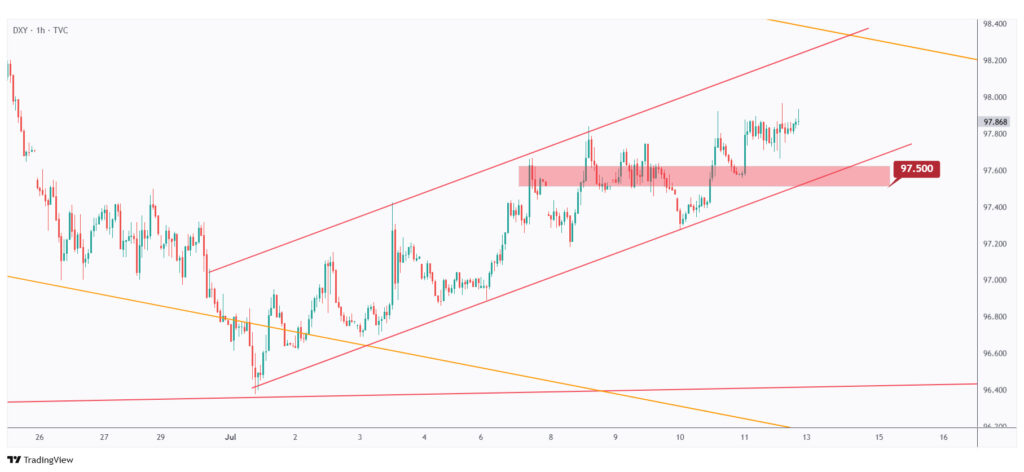
For the bears to take over and trigger the next bearish impulse, a break below the last low marked in red at $97.5 is needed.
In the meantime, DXY is expected to remain bullish in the short term.
USDT.D, Bitcoin, and Ethereum analysis
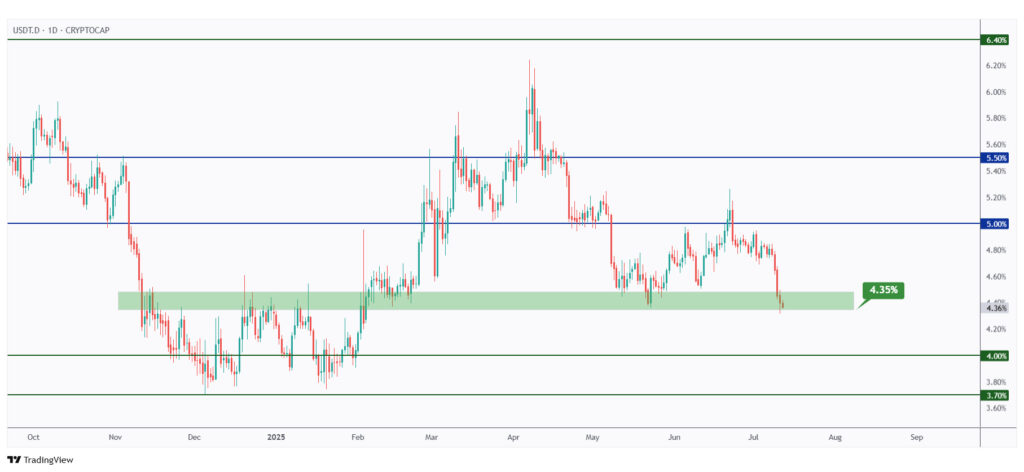
As mentioned in our last market outlook, USDT.D is retesting a weekly support level marked in green at 4.35%.
For the bears to stay in control, a daily candle close below the 4.35% mark is needed. If that happens, expect a stronger bullish phase for crypto.
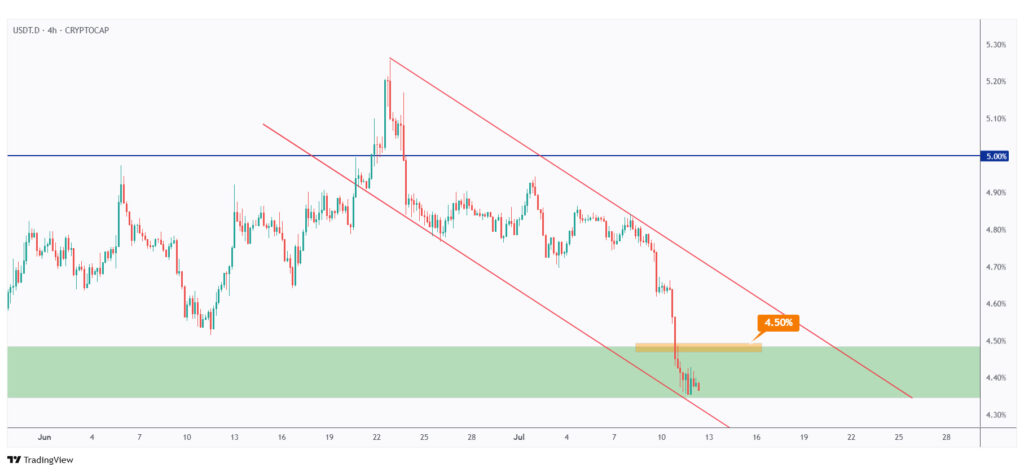
The bears will remain in control for USDT.D as long as the last high marked in orange at 4.5% holds.
If the upper red trendline is broken to the upside, we expect a deep bearish correction for crypto.

Congrats, HODLERS! BTC recorded a new all-time high this week, as mentioned in our last roundup article.
BTC has now entered the price discovery phase — and it’s going to be a wild summer!
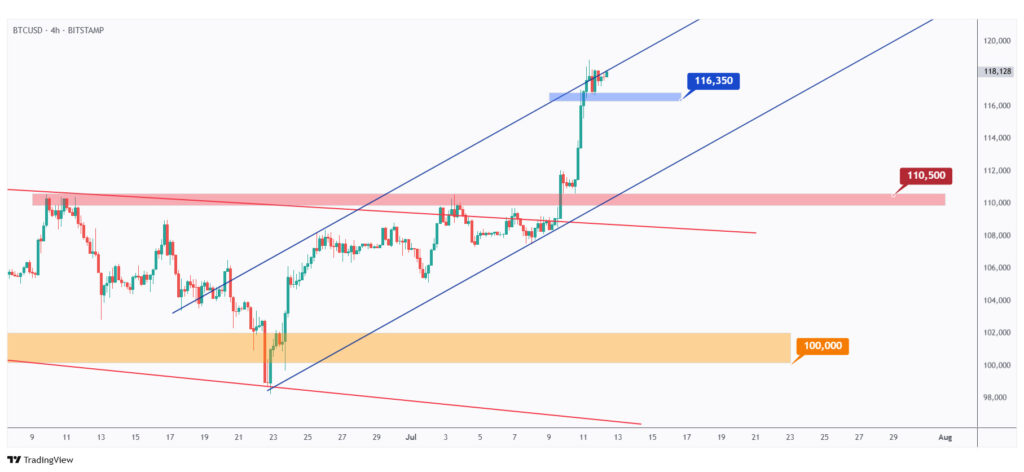
If the last low marked in blue at $116,350 is broken to the downside, a bearish correction toward the lower blue trendline and the $111,000 demand zone would be expected.
Meanwhile, the bulls remain in control in the short, medium, and long term.
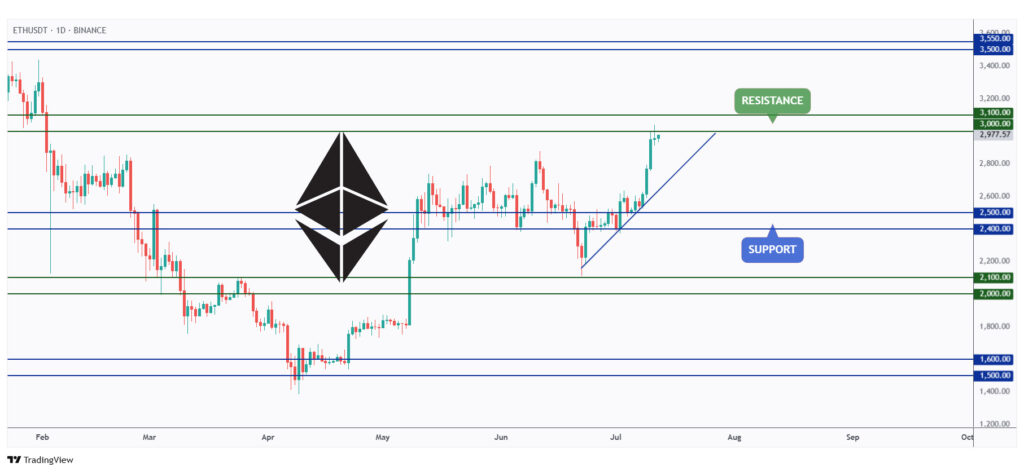
After rejecting the $2,500 support level, ETH moved higher aggressively and is currently retesting the $3,000–$3,100 resistance zone.
For the bulls to remain in control, a break above the $3,100 resistance level is needed.
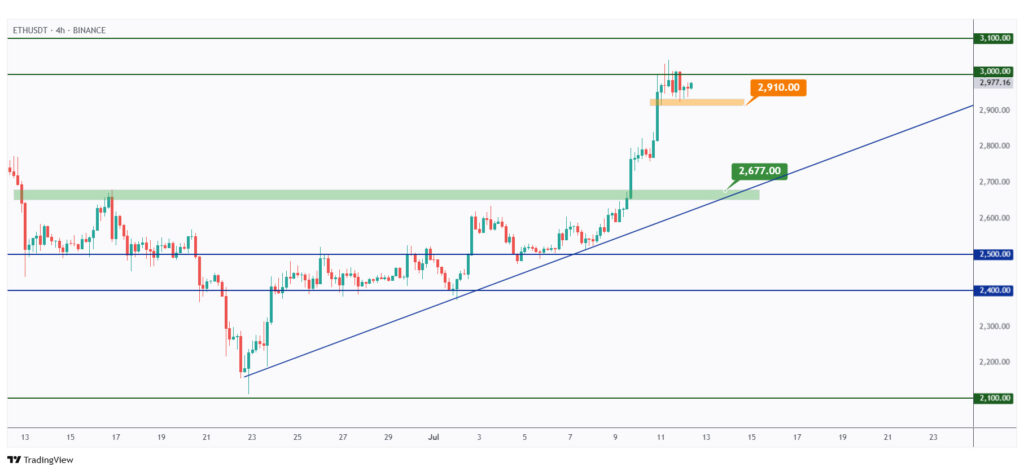
In parallel, if — and only if — the last low marked in orange at $2,910 is broken to the downside, a bearish correction toward the blue trendline and the $2,700 level would be expected.
Quotes / Advices
Hope is a bogus emotion that only costs you money.
~ Jim Cramer
Closing Remarks
In summary, the crypto market is heating up as bullish momentum returns across the board. BTC reached a new all-time high, entering the price discovery phase, while ETH is aggressively testing the $3,000–$3,100 resistance zone.
Altcoins are following closely, with XRP leading the charge, backed by a Fear and Greed Index reading of “Extreme Greed” — the first in months.
Meanwhile, US500’s breakout above its all-time high continues to support risk-on sentiment, giving crypto room to breathe.
DXY and USDT.D remain key metrics to monitor, as their movements could signal short-term volatility. As long as major support levels hold, the bulls remain firmly in control heading into what could be a historic summer for the crypto market.