

Welcome to another crypto market outlook for the 15th of February!
BTC has been hovering within a tight range, signaling an extended accumulation phase, especially as most altcoins are sitting around strong support and demand zones. Will altcoin season start soon? Let’s find out!
Today, we will cover the following topics:
– Market Heatmap and Fear and Greed Index
– US500, DXY and Gold Analysis
– USDT.D, Bitcoin and Ethereum Analysis
– Quotes / Advices
– Closing Remarks
Market Heatmap and Fear and Greed Index
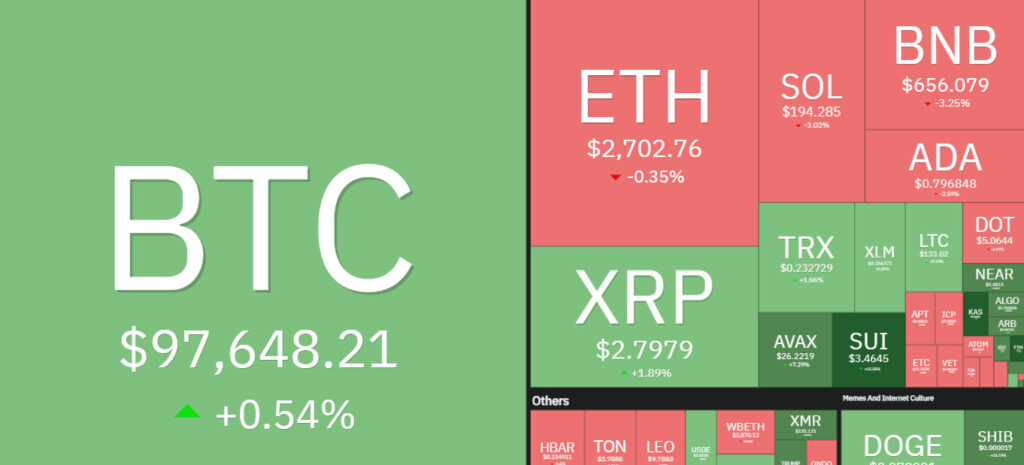
As both BTC and ETH are ranging, the entire market remains unstable, unable to break a recent major high. The good news is that we are not making new lows, which is the first signal of a potential bullish reversal.
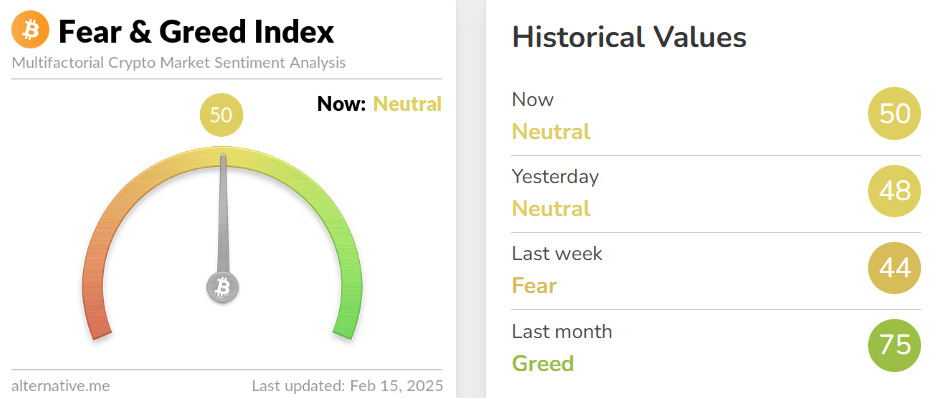
After signaling “Fear” last week, the Fear and Greed Index has returned to “Neutral” territory, indicating that the market is about to breathe again—hopefully to the upside.
US500, DXY, and Gold analysis
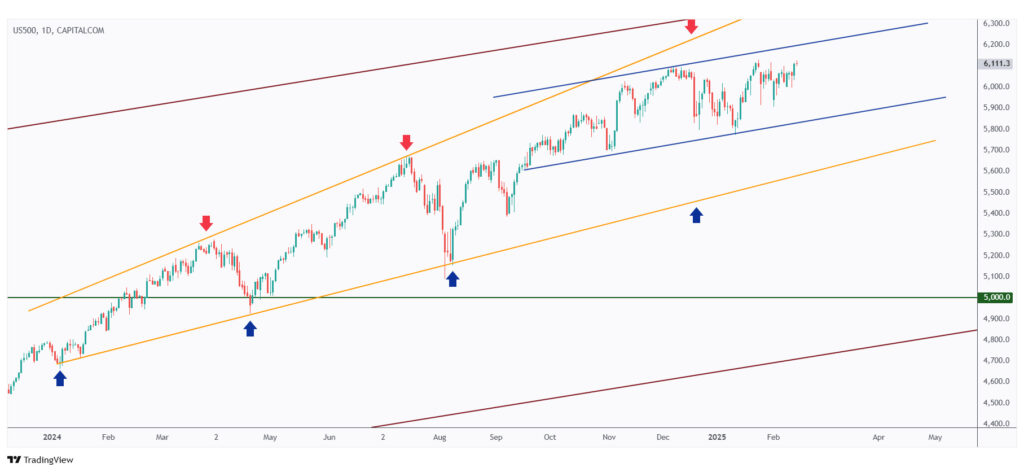
According to our last market overview, the US500 is now approaching the upper bound of its rising channel. If it faces rejection to the downside, it could signal a correction phase for the stock market, potentially followed by the crypto market.
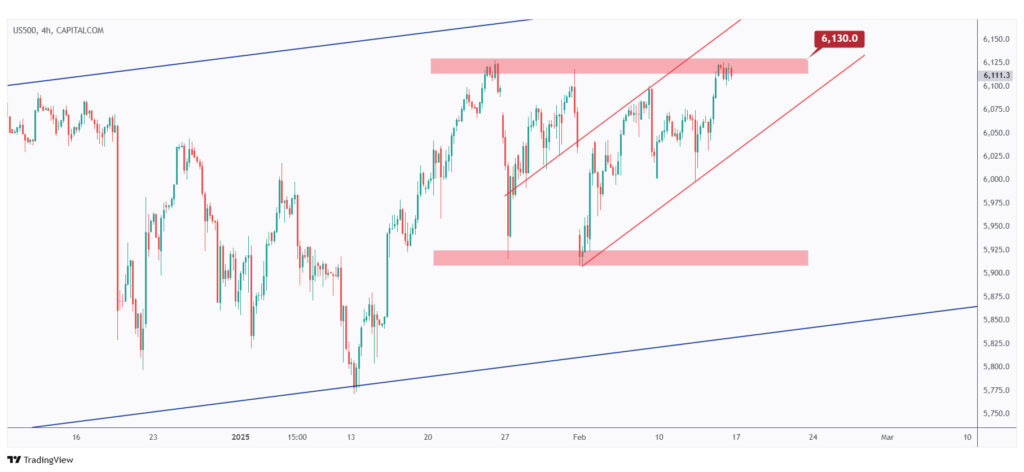
Short-term, the US500 is retesting the upper bound of its horizontal range on the 4H timeframe.
If the $6,130 upper bound is broken to the upside, a bullish continuation is expected, which would be positive for crypto.
In parallel, if the upper bound is rejected, a bearish correction toward the lower red trendline could be on the horizon.
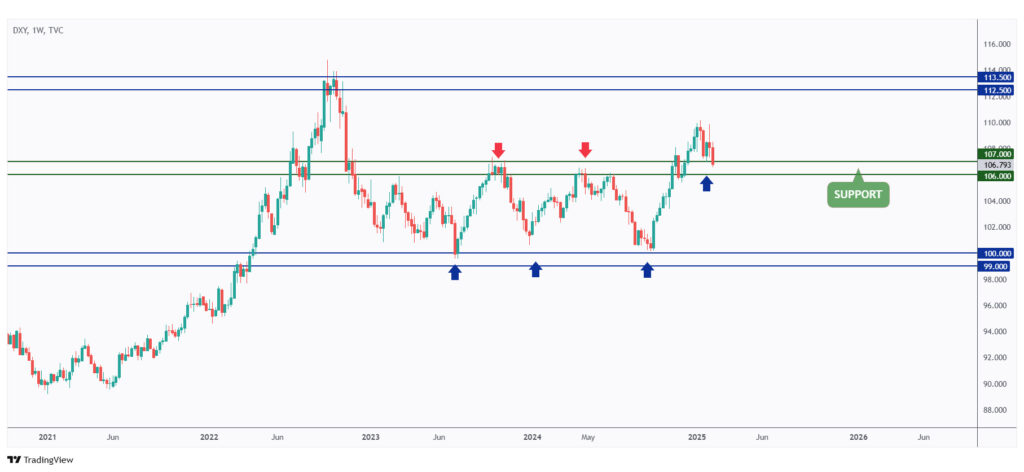
DXY is rejecting a massive support level on the weekly timeframe, indicating a stronger USD next week as long as the support holds.
As a rule of thumb, if DXY trades higher, it typically means downward pressure on other markets, including crypto and stocks.
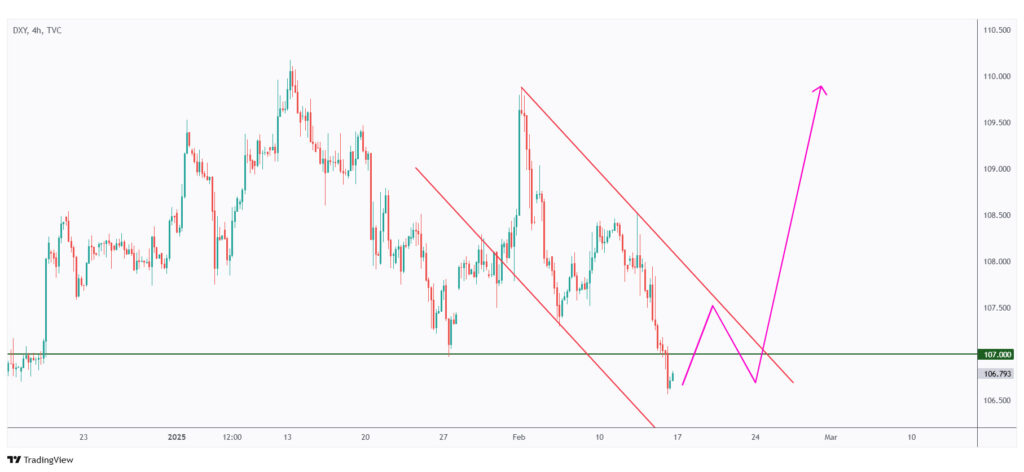
For the momentum to shift from bearish to bullish, a break above the falling red channel is required.
Meanwhile, DXY will remain bearish, especially if the $106 support level is broken to the downside.
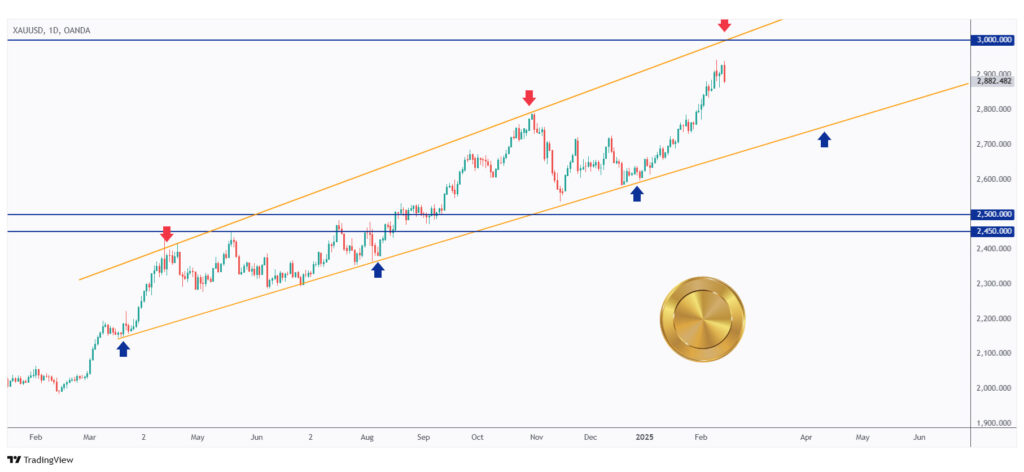
Gold is approaching the $3,000 round number, which intersects with the upper bound of the rising channel marked in orange.
The closer it gets to this rejection zone, the higher the probability that bears will step in.
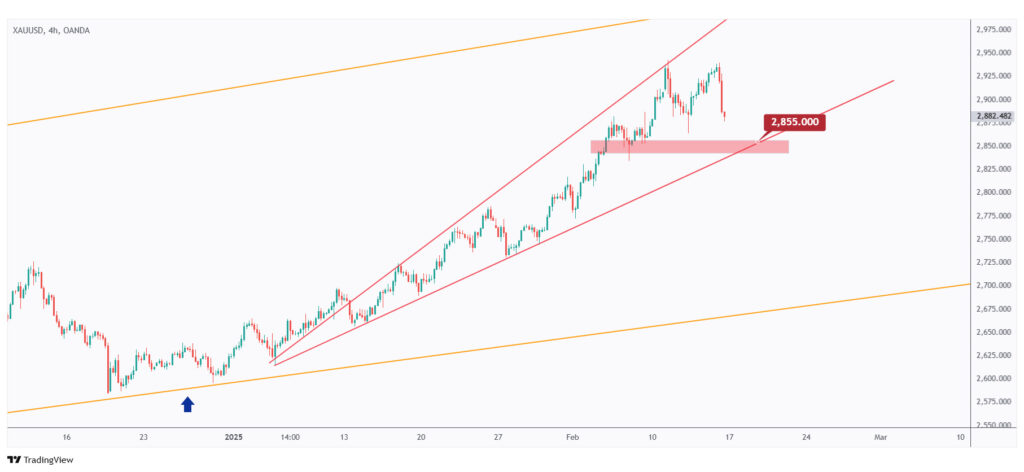
Short-term, as long as the $2,855 major low and the lower red trendline hold, the overall bias will remain bullish.
USDT.D, Bitcoin, and Ethereum analysis
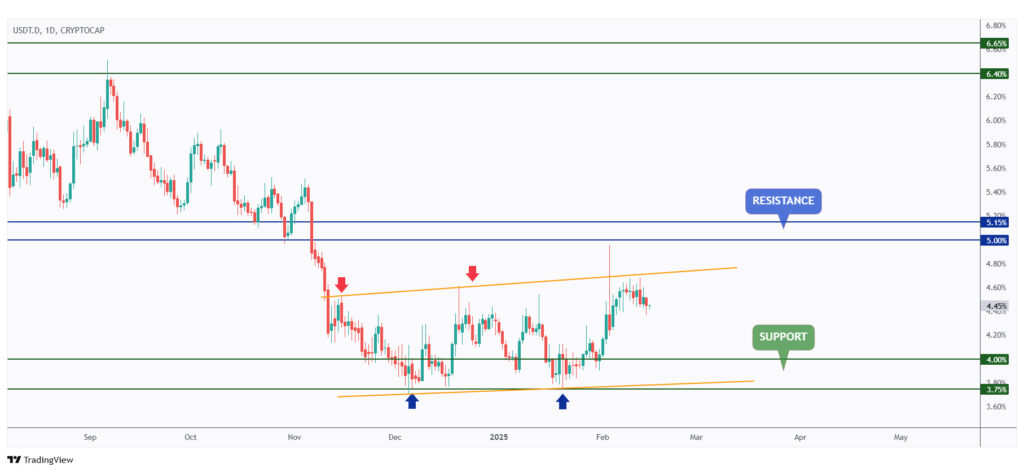
USDT.D is still rejecting the upper bound of its rising channel, indicating that the crypto market is holding its support firmly as mentioned in our last market outlook.
For the next bullish wave in crypto to begin, a bearish move in USDT.D is needed.
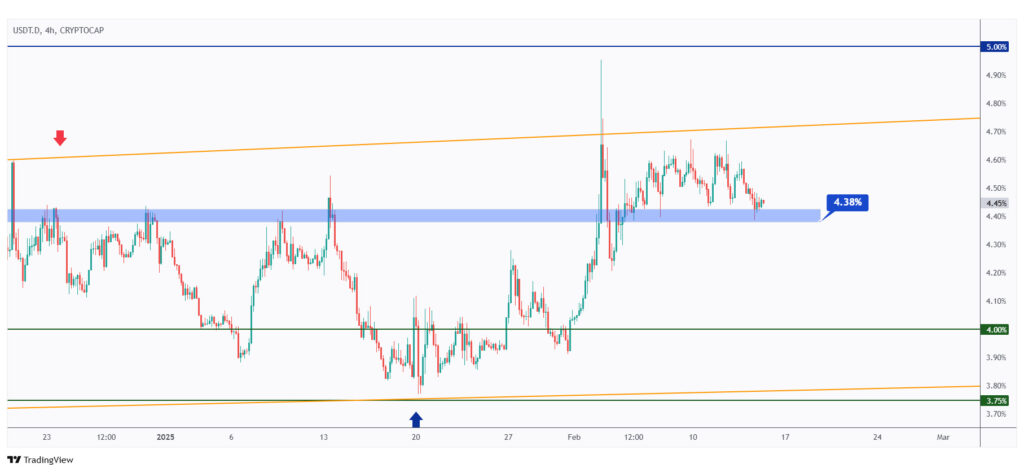
For the bears to take control of USDT.D, which would signal a bullish shift in crypto, a break below the 4.38% structure is needed.
Meanwhile, further downside in the crypto market remains possible.
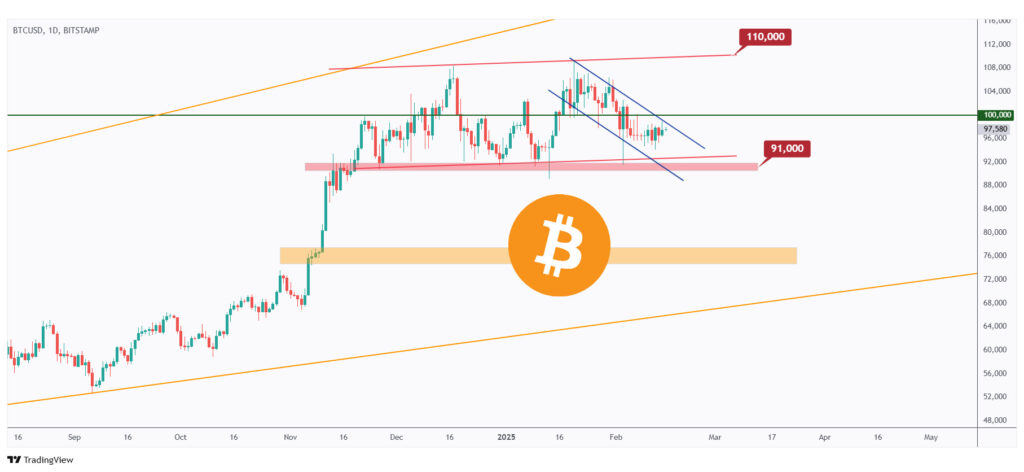
BTC is still holding firmly above the lower bound of its range and both the red and blue channels.
As long as this key intersection holds, the overall bias will remain bullish in the long term.

As BTC retests the upper bound of its medium-term falling channel marked in blue, the overall short-term bias remains bearish.
If the last low at $96,500 is broken to the downside, a bearish correction for BTC would be expected.
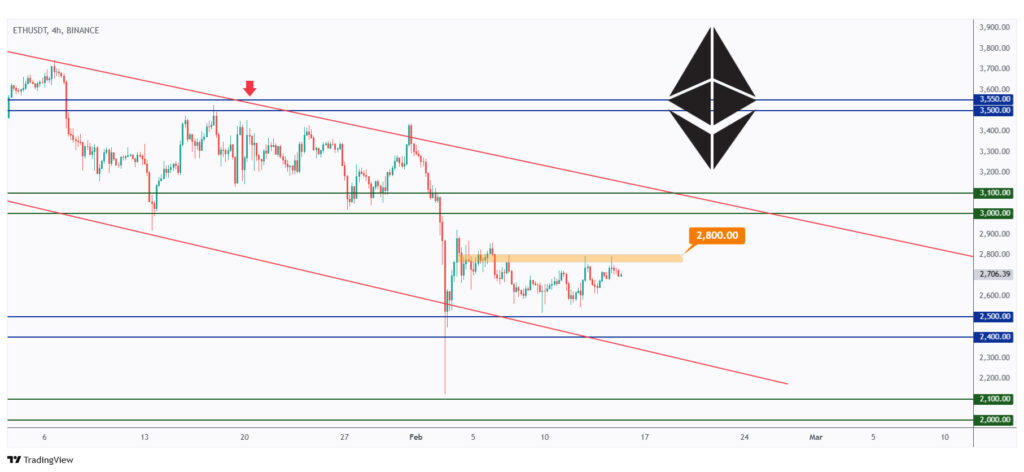
As mentioned in our last roundup article, for the bulls to take control of ETH and push toward the $3,100 resistance level, a break above the $2,800 structure marked in orange is needed.
Until then, the bears will maintain the upper hand.
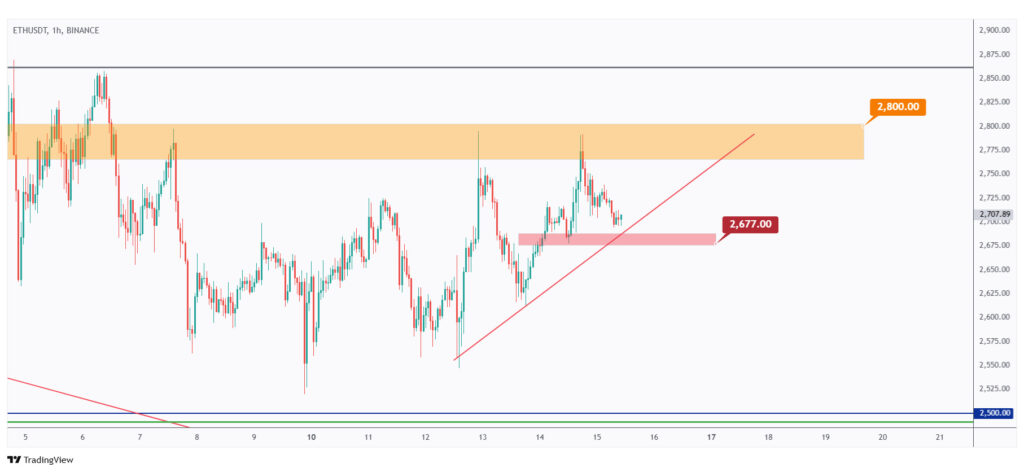
Just like BTC, if the last low at $2,677 is broken to the downside, another bearish wave can be expected for ETH and the broader altcoin market.
Quotes / Advices
When you genuinely accept the risks, you will be at peace with any outcome.
~ Mark Douglas
Closing Remarks
In summary, The crypto market remains in a critical phase, with BTC and ETH consolidating within tight ranges, signaling an extended accumulation period.
The Fear and Greed Index has returned to neutral, suggesting a potential shift in sentiment.
On the macro side, US500 is approaching key resistance, while DXY is rebounding from major support, indicating a possible stronger USD, which could pressure risk assets. Gold nears the $3,000 psychological level, with rejection likely at its rising channel’s upper bound.
For crypto, USDT.D remains near resistance, and a breakdown is needed for bullish momentum. BTC and ETH must hold key support levels, with further downside possible if major lows are broken. The next bullish wave depends on critical breakouts across the market.