

Welcome to another crypto market outlook for the 13th of September!
The crypto market is finally pumping, especially large-cap altcoins. This is a clear signal that the last phase of the bull run began toward the end of 2025. Traders are extremely optimistic as they await the Fed’s interest rate cut on September 17.
Today, we will cover the following topics:
– Market Heatmap and Fear and Greed Index
– US500 and DXY
– USDT.D, Bitcoin and Ethereum Analysis
– Quotes / Advices
– Closing Remarks
Market Heatmap and Fear and Greed Index
The 7-day crypto heatmap is screaming bullish for the second week in a row, with almost every altcoin pumping hard, following ETH’s lead after it surged by over 4% this week.
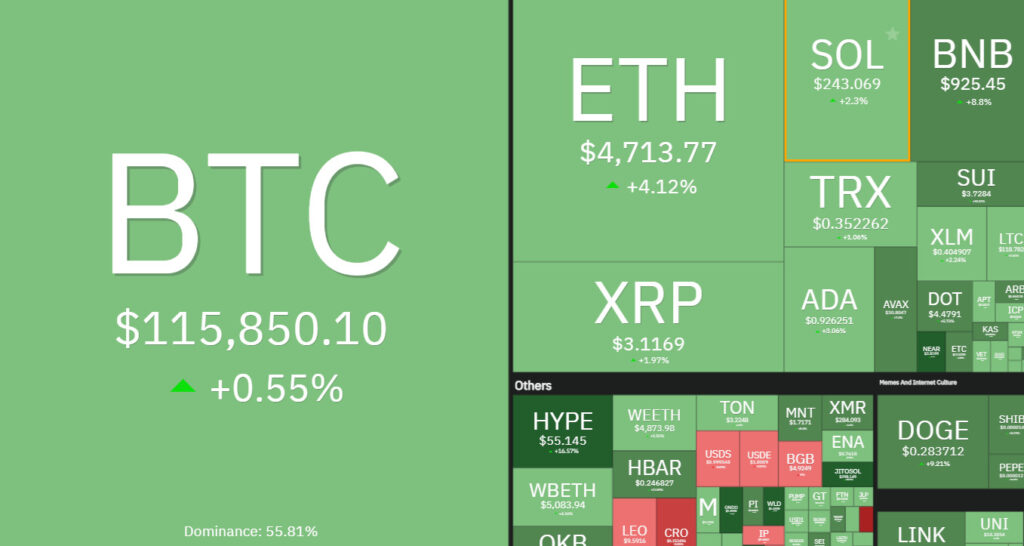
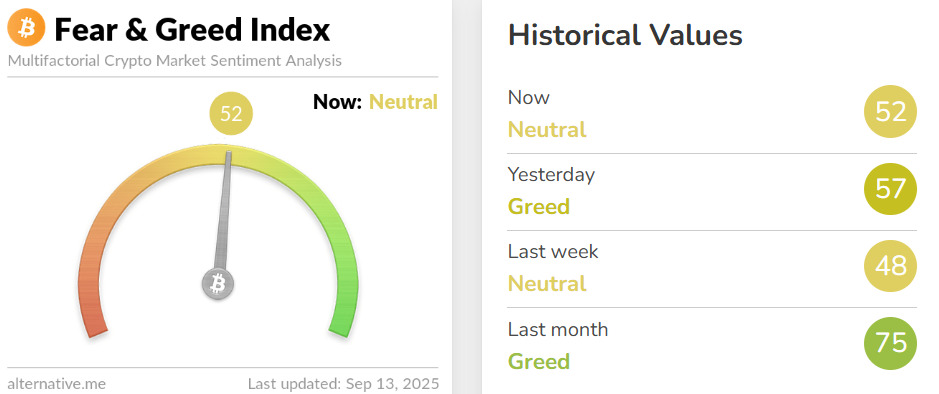
The Fear and Greed Index flipped from Fear to Neutral this week, signaling a potential reversal in market sentiment, with traders and investors growing more optimistic than ever.
US500 and DXY analysis
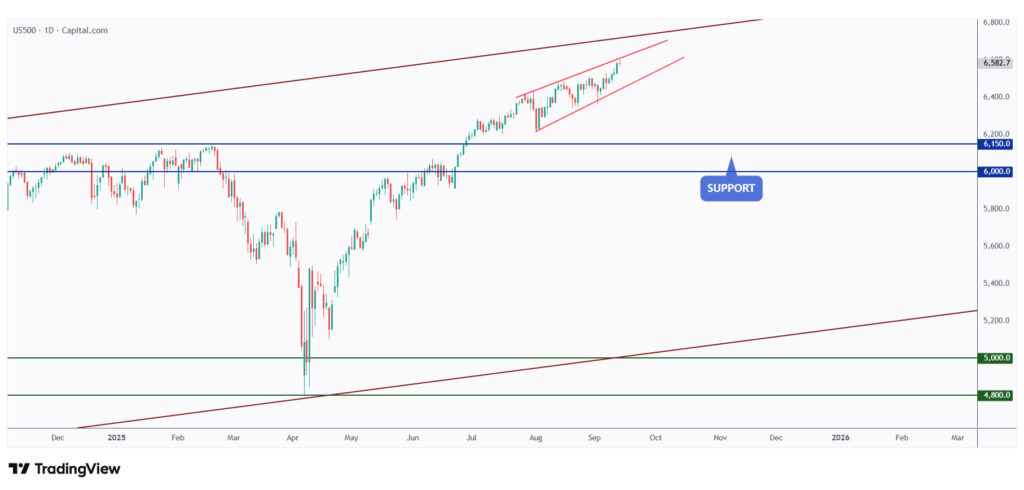
As per our previous US500 analysis, the overall bias remains bullish as long as price continues to trade within the red rising wedge pattern.
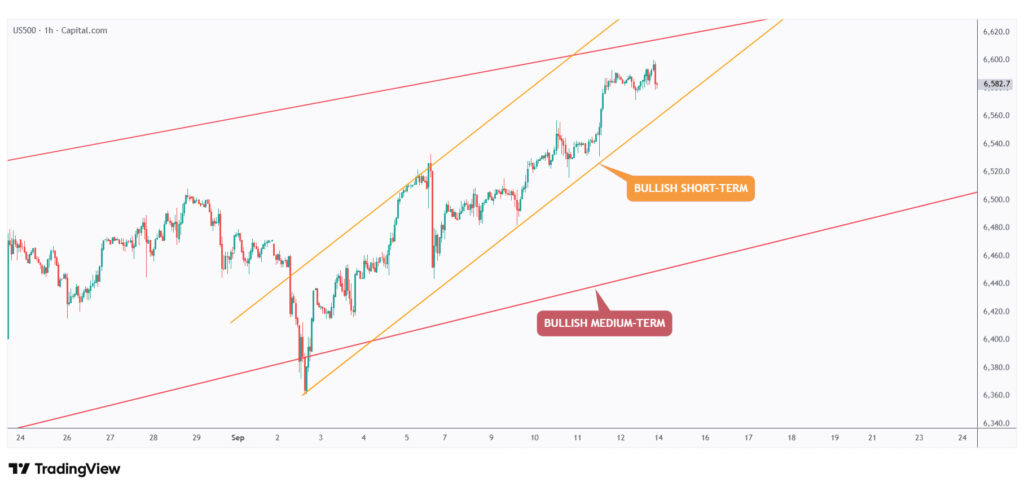
US500 will remain bullish in the short term as long as it trades within the rising orange channel.
However, if the orange channel breaks downward, a short-term bearish correction toward the lower bound of the rising red channel can be expected.
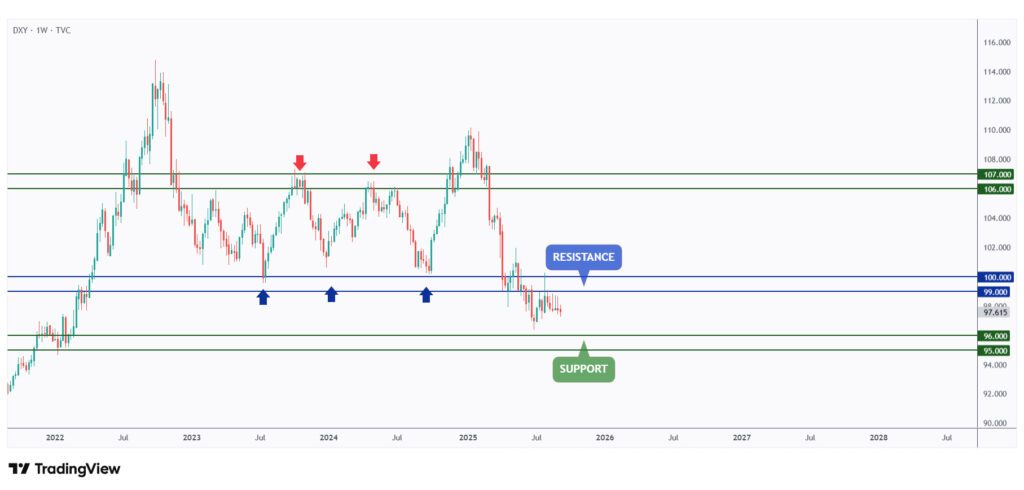
DXY is still ranging between the $95 support and the $100 resistance levels.
As long as DXY holds below the $100 mark, the overall bias remains bearish, which is positive for crypto.
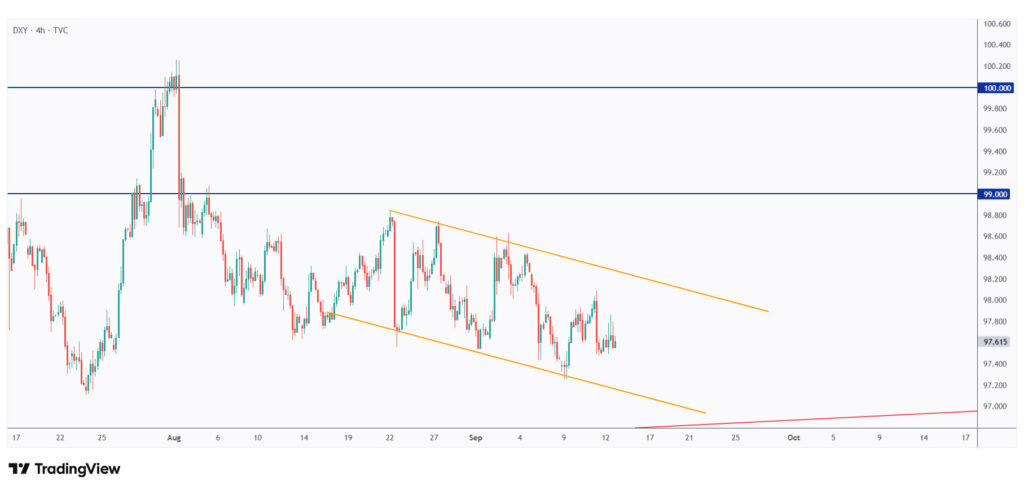
The overall trend for DXY will remain bearish as long as it continues to trade within the falling orange channel.
USDT.D, Bitcoin, and Ethereum analysis
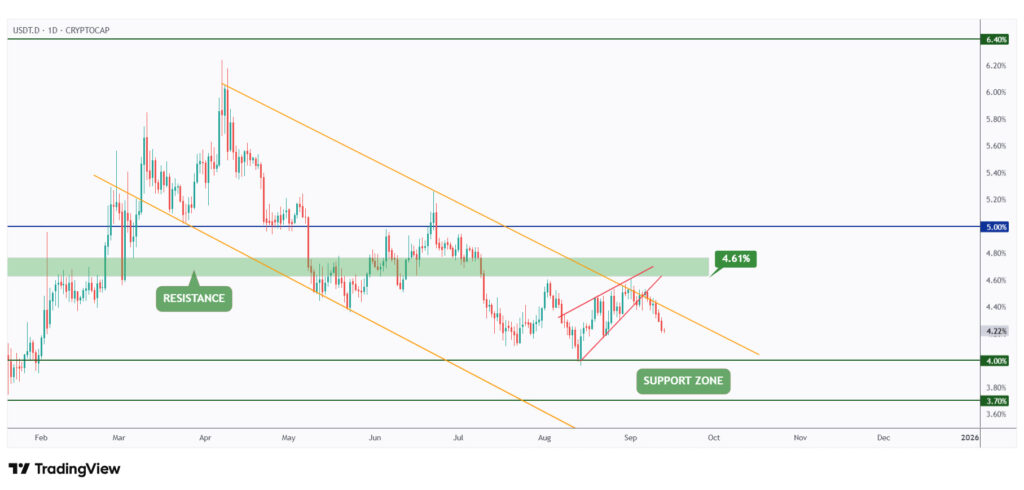
As per our latest USDT.D update, it perfectly rejected the 4.61% resistance level and has since been in free fall, a highly bullish sign for crypto.
The next support for USDT.D is around 4%, which is acting like a magnet, pulling the price toward it.
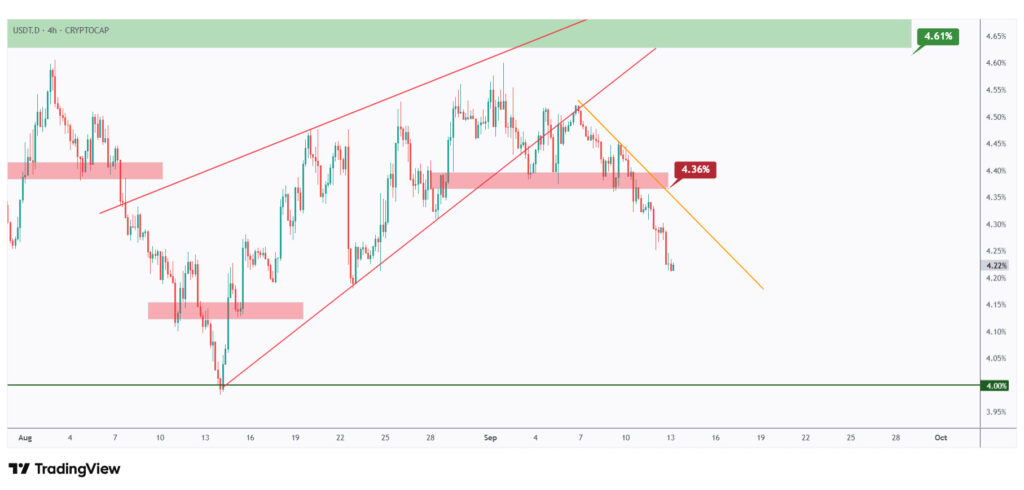
After breaking below our last low at 4.36% (marked in red), USDT.D’s momentum has shifted from bullish to bearish, flipping overall crypto sentiment from bearish to bullish.
As long as USDT.D holds below the falling orange trendline, the bias will remain bearish.
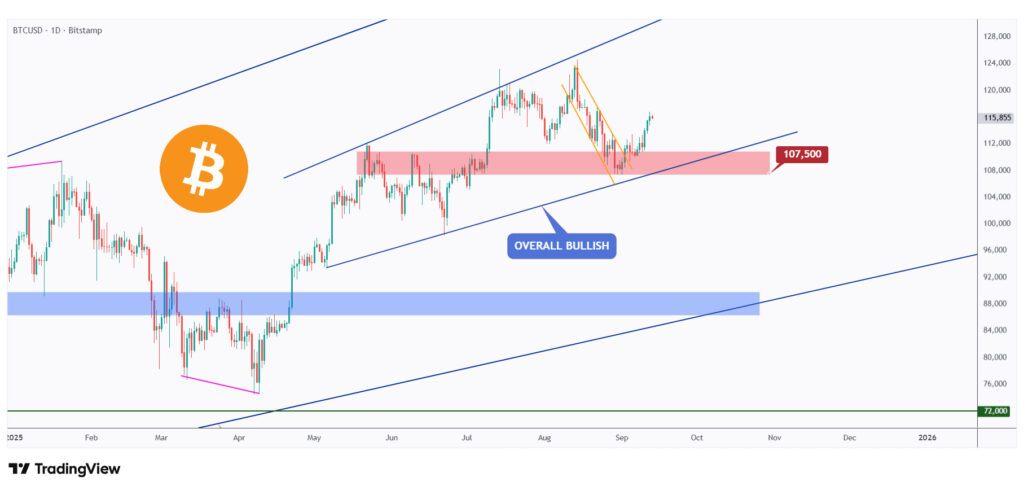
As per our latest BTC update, price rejected the $107,500 structure (marked in red) and has been surging since.
As long as the $107,000 level holds, the path remains upward, with a move expected toward the upper bound of the rising channel at $125,000.
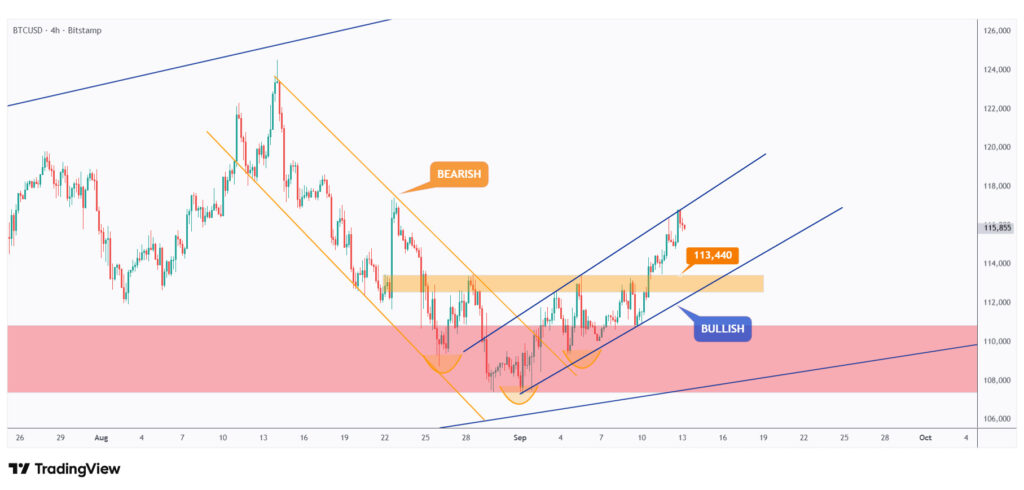
After breaking above the $113,440 neckline mentioned last week, BTC’s momentum has shifted from bearish to bullish.
As long as it trades within the rising blue channel, the overall bias remains bullish, and we’ll be looking for trend-following longs on every bearish correction.
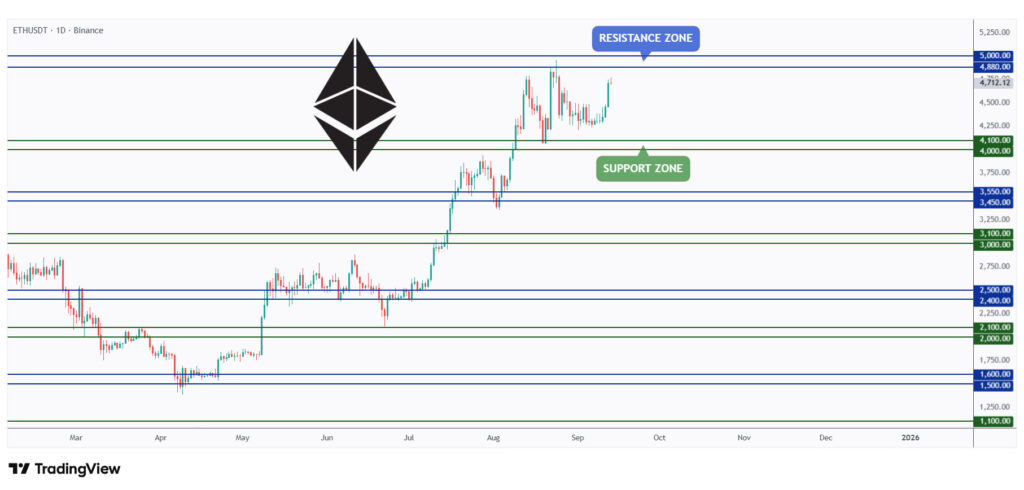
As per our latest ETH analysis, it rejected the lower bound of its range at $4,000 and surged by over 10%.
It is now approaching the upper bound of the range at $5,000, where short-term bearish pressure can be expected.
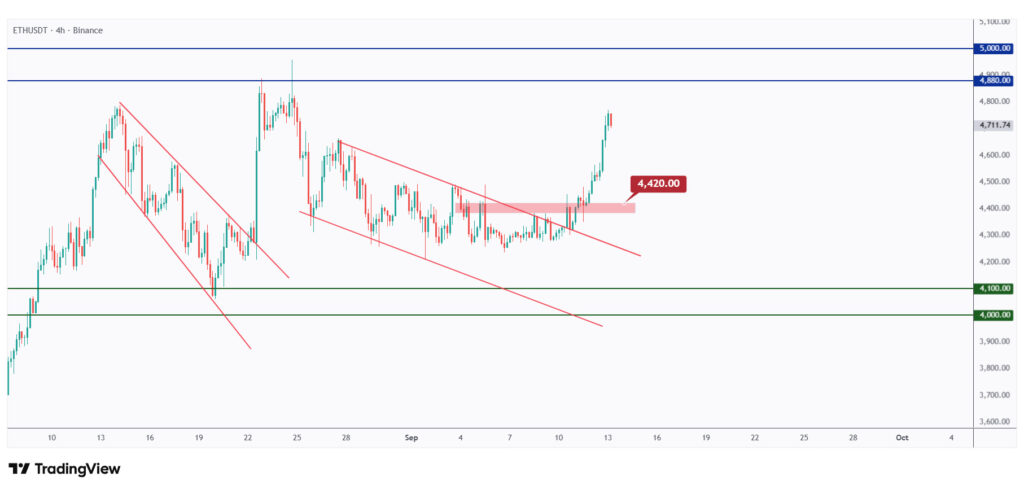
After breaking above the last major high at $4,420, the bulls took control of ETH.
As long as they maintain momentum, we can expect a continuation toward the upper bound of the range at $5,000.
Quotes / Advices
You never know what kind of setup market will present to you, your objective should be to find an opportunity where risk-reward ratio is best.
~ Jaymin Shah
Closing Remarks
In summary, the crypto market is showing strong bullish momentum, led by large-cap altcoins and renewed optimism ahead of the Fed’s expected rate cut on September 17.
Market indicators such as the heatmap and the Fear and Greed Index point to improving sentiment. US500 remains bullish within its rising patterns, while DXY’s weakness continues to favor crypto.
USDT.D’s breakdown signals further upside potential, with Bitcoin targeting $125,000 as long as key supports hold, and Ethereum approaching the $5,000 resistance after a sharp rebound.