

Welcome to our latest crypto market outlook for February 12th!
Altcoins are still in a deep correction phase, unable to break above a major high. However, since most altcoins are rejecting a support or demand zone, it is time to start looking for potential long opportunities. Here are five altcoins currently at strong key rejection levels: IO, TST, VIDT, NKN, and UNI.
Today, we will cover the following topics:
– USDT.D and BTC Analysis
– 5 Altcoins Analysis
– Quotes / Advices
– Closing Remarks
USDT.D and BTC analysis
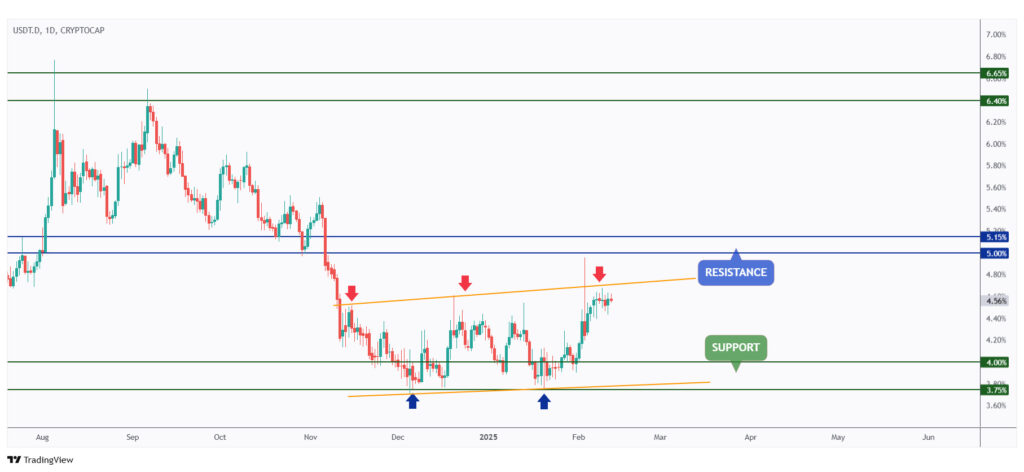
As per our last market outlook, USDT.D is still approaching the upper bound of its rising channel, marked in orange.
This is a positive signal that the crypto market may recover soon.
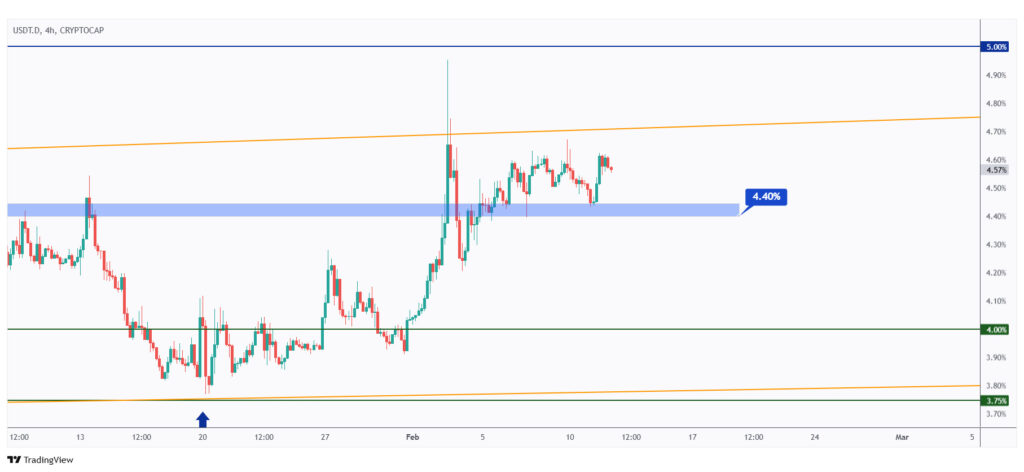
The overall bias will remain bearish for the crypto market as long as the 4.4% support holds for USDT.D.
For a bullish correction to begin, a break below 4.4% is required.
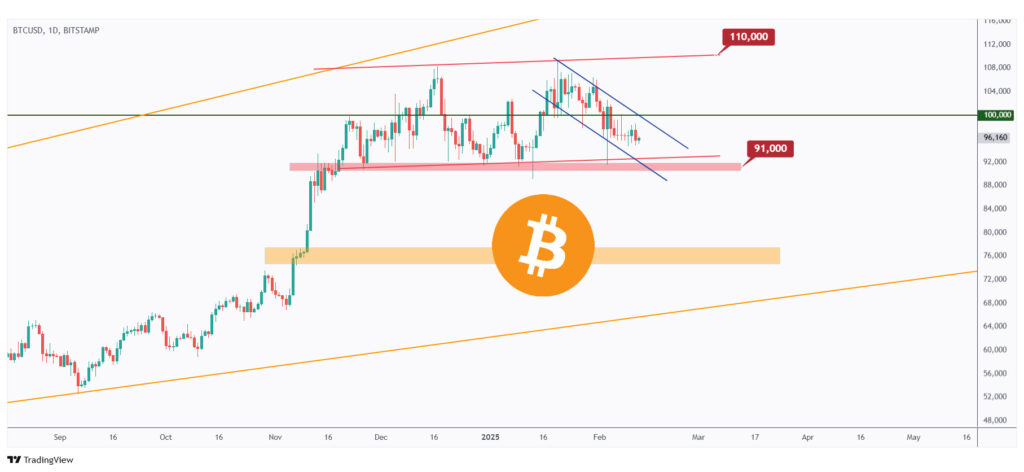
BTC remains bearish in a short-term correction phase, trading within the falling channel marked in blue.
As it approaches the lower bound of its range at $91,000, the advantage will shift to the bulls.
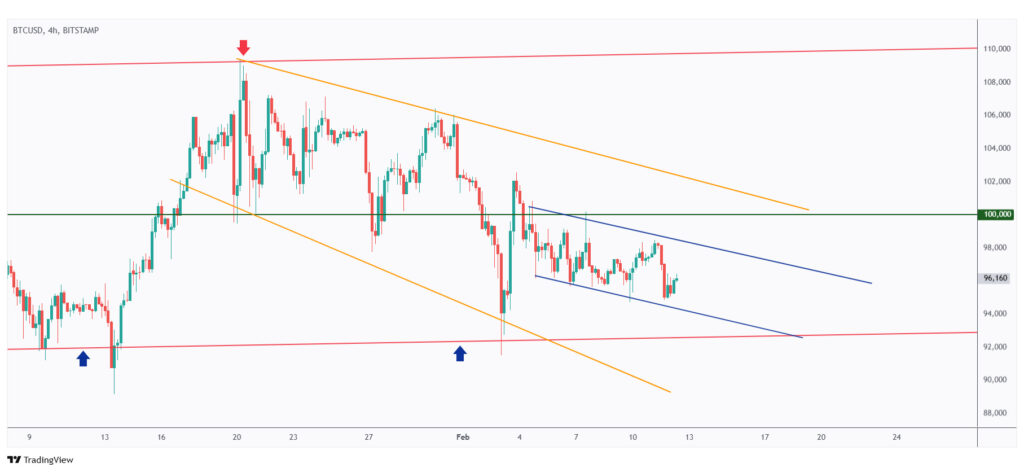
For momentum to shift from bearish to bullish in the short term, a break above the upper blue trendline is required.
Meanwhile, further downside toward $91,000 remains possible.
5 Altcoins Analysis
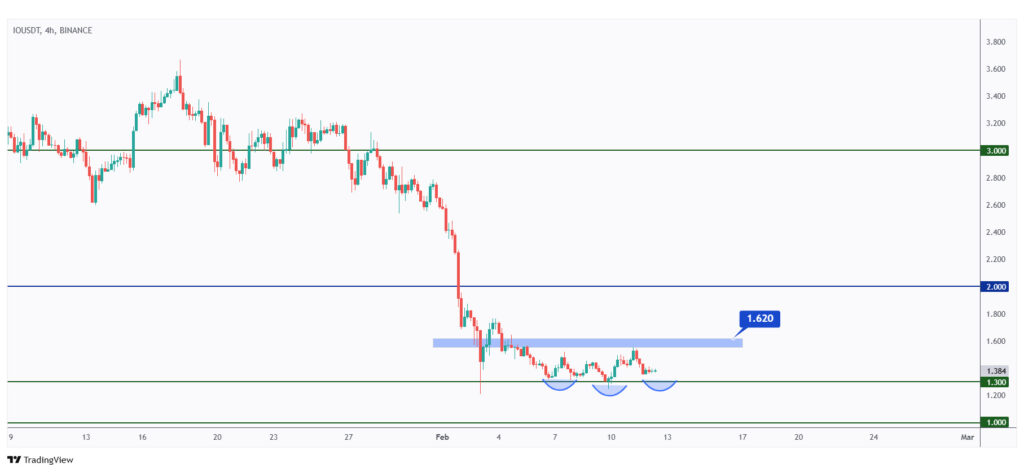
After being bearish for almost two months, IO is finally retesting strong support at $1.3.
As long as this support holds, we will be looking for bullish reversal setups.
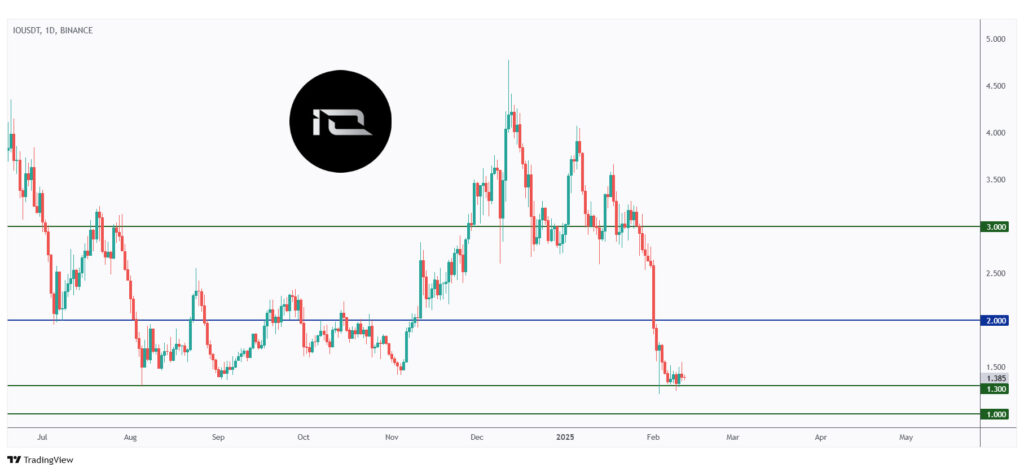
In the medium term, for the bulls to confirm control, a break above the inverse head and shoulders neckline at $1.62 is required.
Meanwhile, if IO breaks below the $1.3 support, further downside toward the $1 round number is expected.
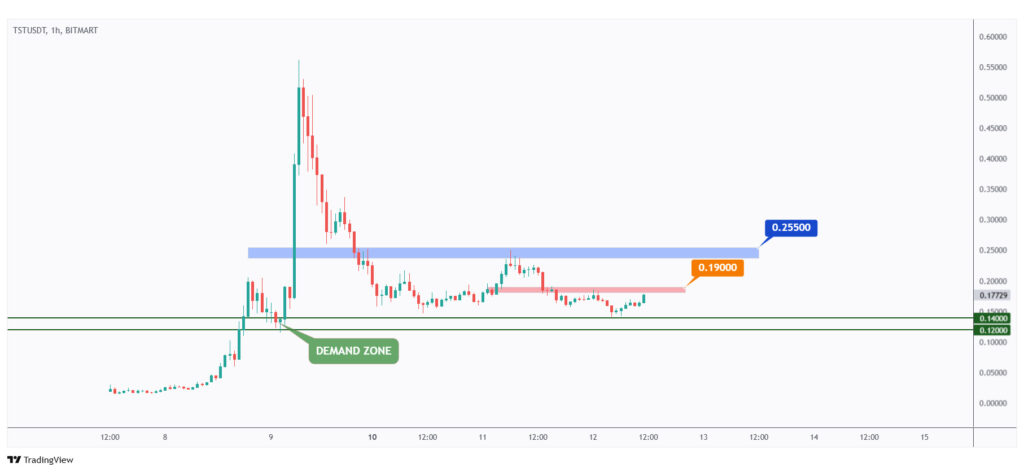
TST went viral after being leaked during a Binance test video.
After peaking around $0.55, TST has been bearish and is currently rejecting the $0.12–$0.14 demand zone.
For the bulls to take over in the short term, a break above the $0.19 high is needed, followed by a break above the $0.255 structure for them to maintain control.
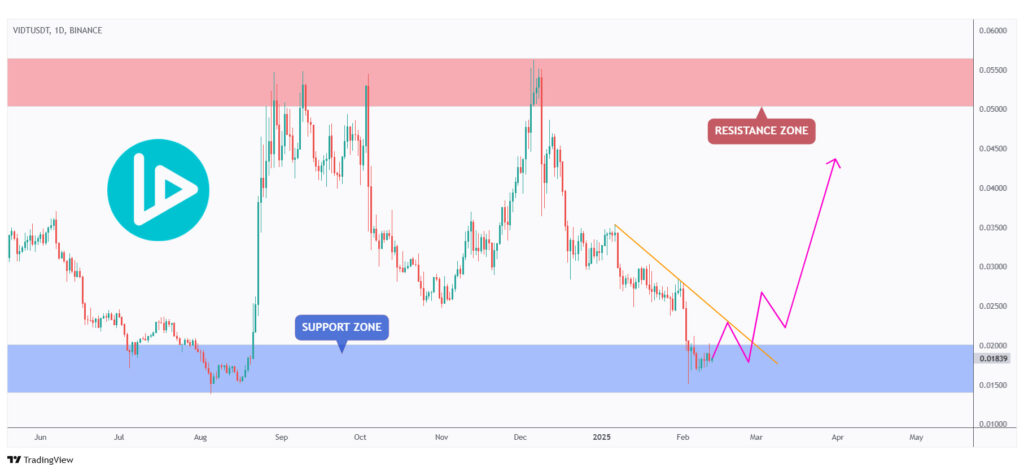
Next up is VIDT, which has been trading within a broad range between $0.015 and $0.055.
Since it is currently hovering around the lower bound of this range, we will be looking for long setups on lower timeframes.
For the bulls to shift momentum in their favor, a break above the falling orange trendline is required.
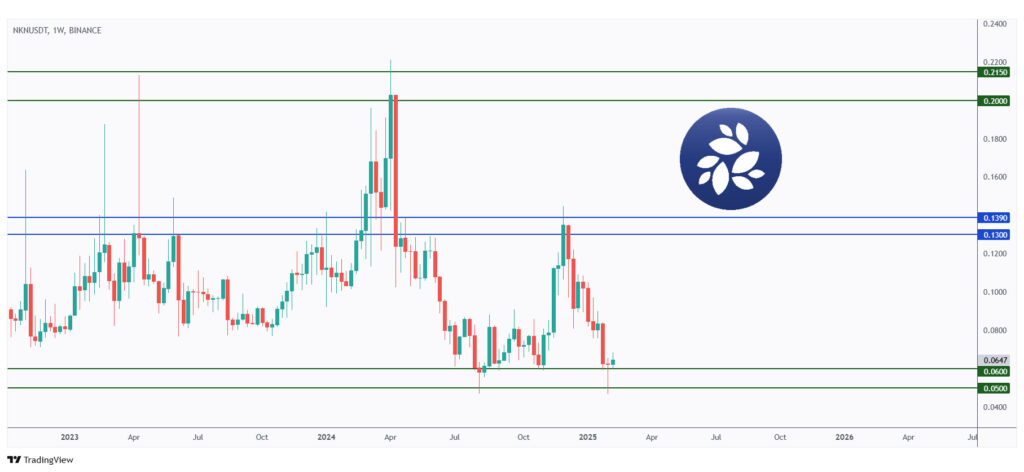
Analyzing NKN, it is currently rejecting a massive support level at the round number of $0.05.
As long as this support holds, the bulls will have the edge to take full control.
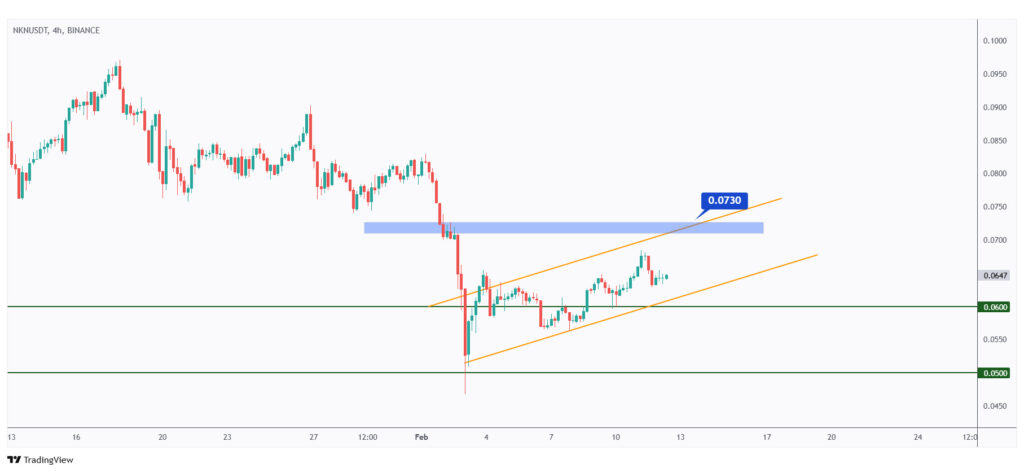
After rejecting the $0.05 round number, NKN has been bullish in the medium term, trading within the rising channel marked in orange.
The bulls will remain in control as long as the channel holds and will take full control if they manage to break above the $0.073 structure marked in blue.
Last but not least, UNI has been overall bullish from a macro perspective, trading within the rising channel marked in red.
Currently, UNI is rejecting the lower bound of the channel, which intersects with the $7–$8 support zone.
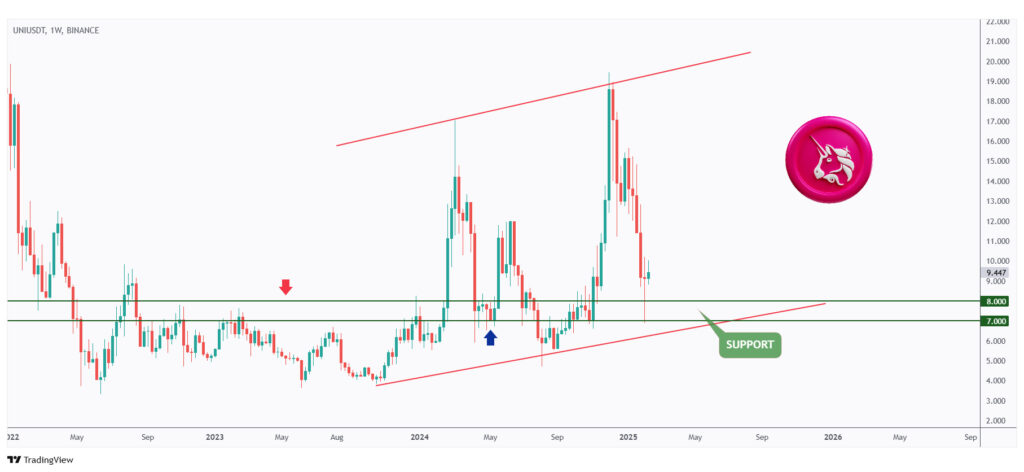
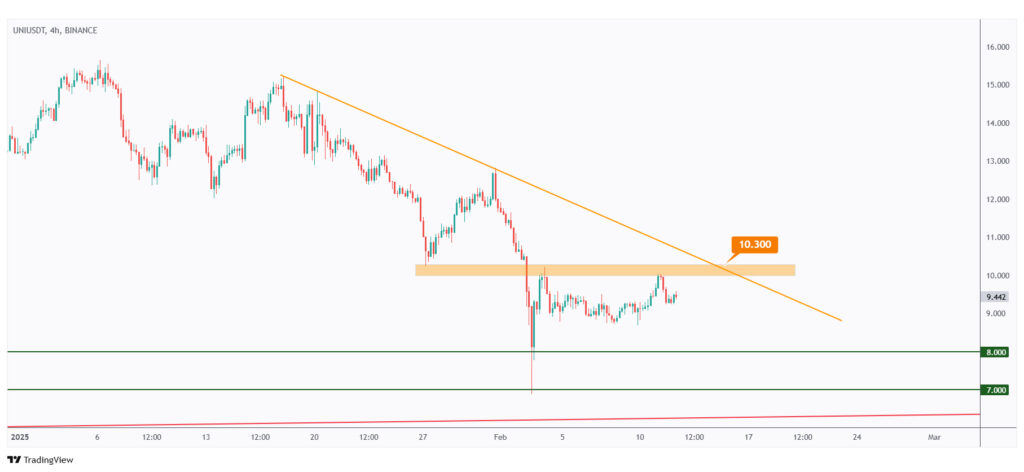
For the bulls to take over and initiate the next impulse move toward the $20 round number, a break above the orange trendline and the $10.3 structure is required.
Quotes / Advices
You never know what kind of setup the market will present to you. Your objective should be to find an opportunity where risk-reward ratio is best.
~ Jaymin Shah
Closing Remarks
In summary, USDT.D is approaching the upper bound of its rising channel, signaling potential recovery in the crypto market. However, a break below the 4.4% support is needed for a bullish correction.
BTC remains in a short-term bearish correction but is nearing $91,000, where bullish momentum may increase. A break above the upper blue trendline is required for a confirmed reversal.
IO is retesting strong support at $1.3, with bullish setups likely as long as this level holds. A break above $1.62 would confirm bullish control.
TST has been bearish after its viral surge but is rejecting the $0.12–$0.14 demand zone. Bulls need to clear $0.19 first and then $0.255 for sustained control.
VIDT is hovering around the lower bound of its range at $0.015–$0.055, with bullish momentum dependent on a breakout above the falling orange trendline.
NKN is holding massive support at $0.05 and has turned bullish in the medium term within its rising channel. A break above $0.073 would confirm full bullish control.
UNI remains bullish from a macro perspective, trading within a rising channel. Currently rejecting support at $7–$8, UNI needs to break $10.3 and the orange trendline for a push toward $20.