
Welcome to another crypto market outlook for the 8th of February!
After losing the $100,000 mark, BTC has entered a correction phase, heading toward $91,000. Is this just a correction or the beginning of a broader bearish trend? Let’s go over the possible scenarios together.
Today, we will cover the following topics:
– Market Heatmap and Fear and Greed Index
– US500, DXY and Gold Analysis
– USDT.D, Bitcoin and Ethereum Analysis
– Quotes / Advices
– Closing Remarks
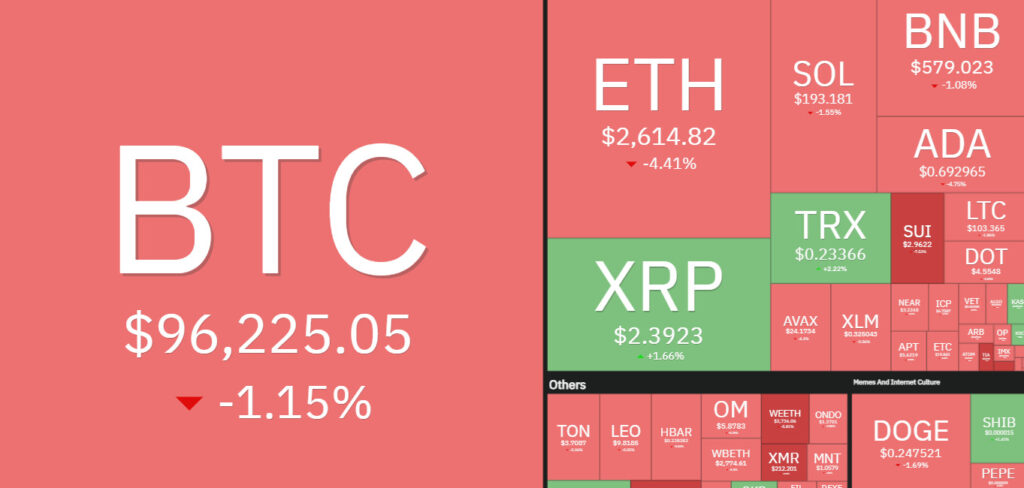
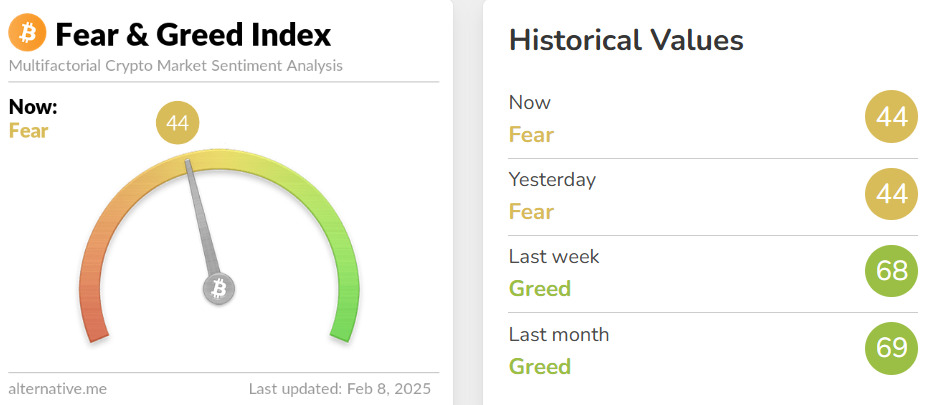
Market Heatmap and Fear and Greed Index
BTC has been dipping slowly, while altcoins have been falling at a faster pace. ETH is down by -4.41%, and the entire crypto market is in the red.
The Fear and Greed Index has shifted to “Fear” for the first time in months. While many might see this as a negative signal, this is where professional traders start accumulating at a discount. Which side are you on?
US500, DXY, and Gold analysis
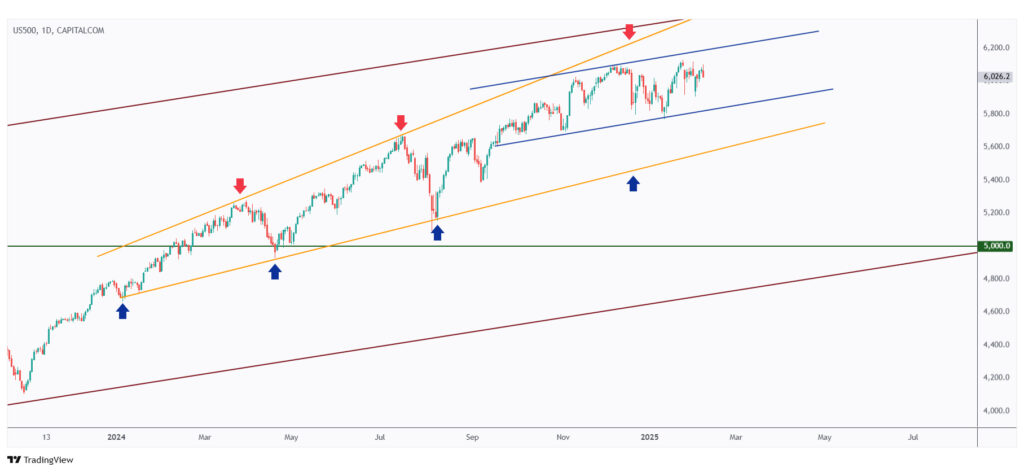
As per our last market outlook, the US500 is still overall bullish, trading within the blue channel from a medium-term perspective.
However, it is currently rejecting the upper bound of the channel, so a correction is in sight.
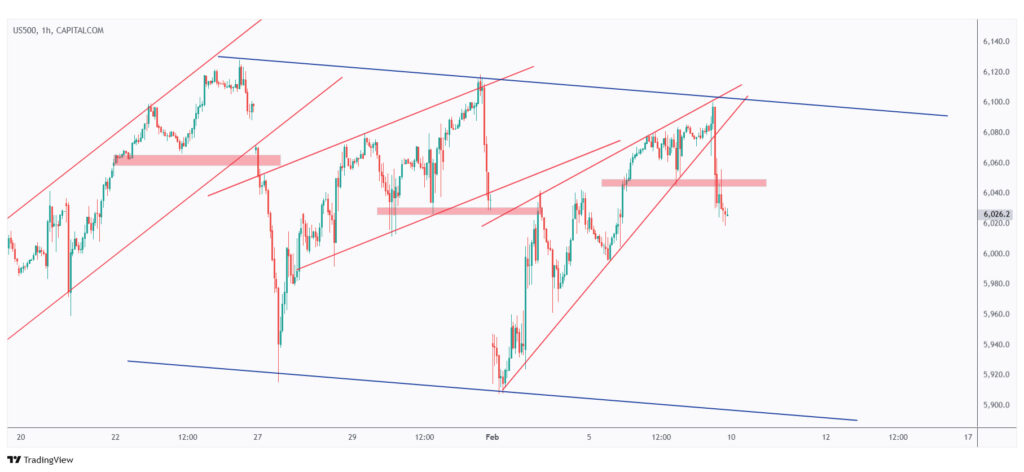
From the 1H timeframe, the US500 has broken below the last minor low marked in red on Friday.
Thus, a bearish trend is expected next week for the stock market.
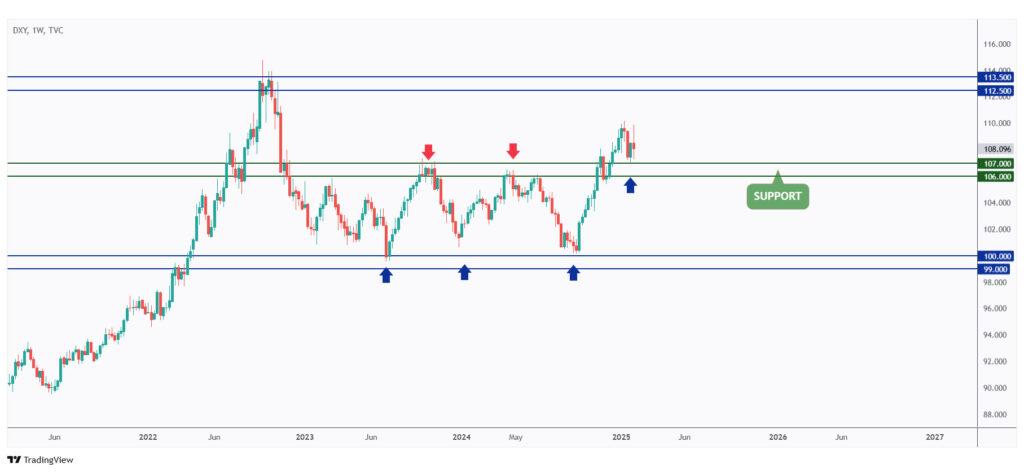
The DXY is still standing strong above the $107 support.
As long as the support zone holds, a stronger DXY is expected, making it difficult for the crypto market to gain momentum.
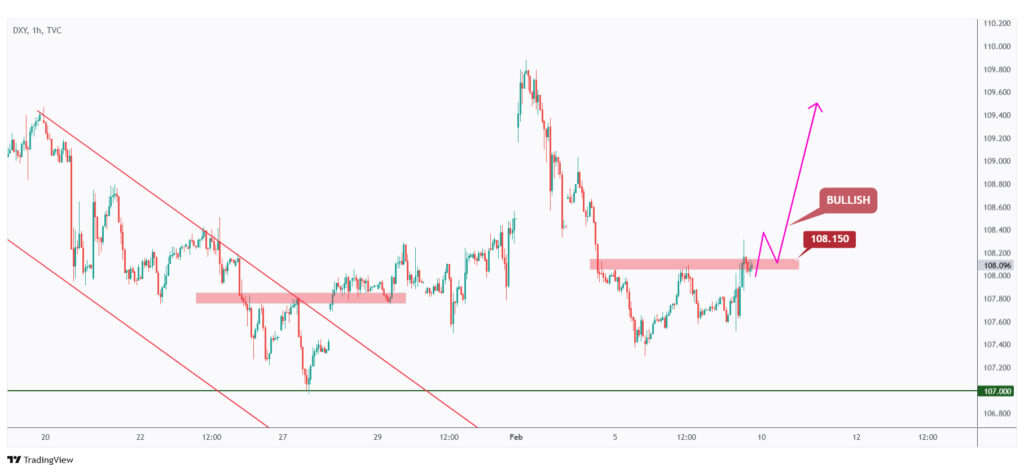
As the DXY breaks above the minor high marked in red at $108.15, the bulls would take over in the short term.
A stronger DXY means weaker assets across the board, including stocks and crypto.
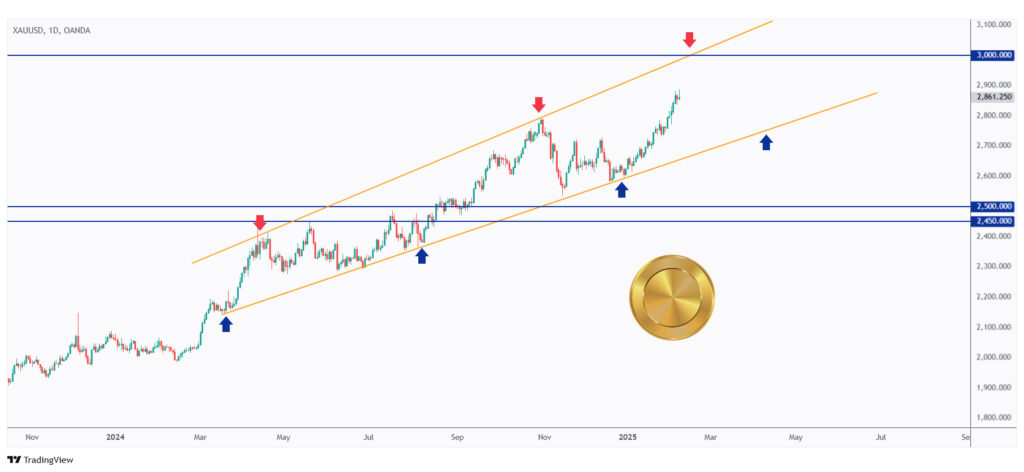
After breaking above its all-time high, gold is recording new highs this week and heading toward the upper bound of the orange channel, which aligns with the $3,000 round number.
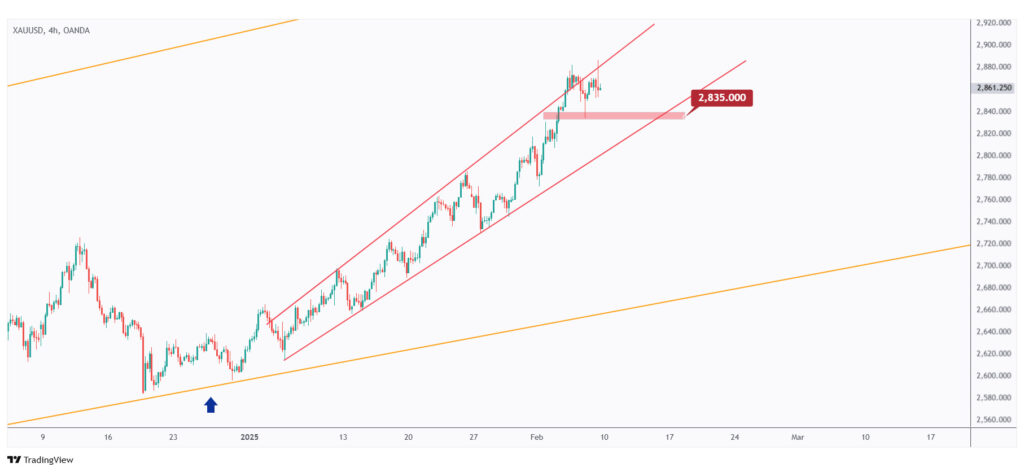
The bulls will remain in full control unless the last low at $2,835 is broken to the downside.
Only then would a bearish correction be expected.
USDT.D, Bitcoin, and Ethereum analysis
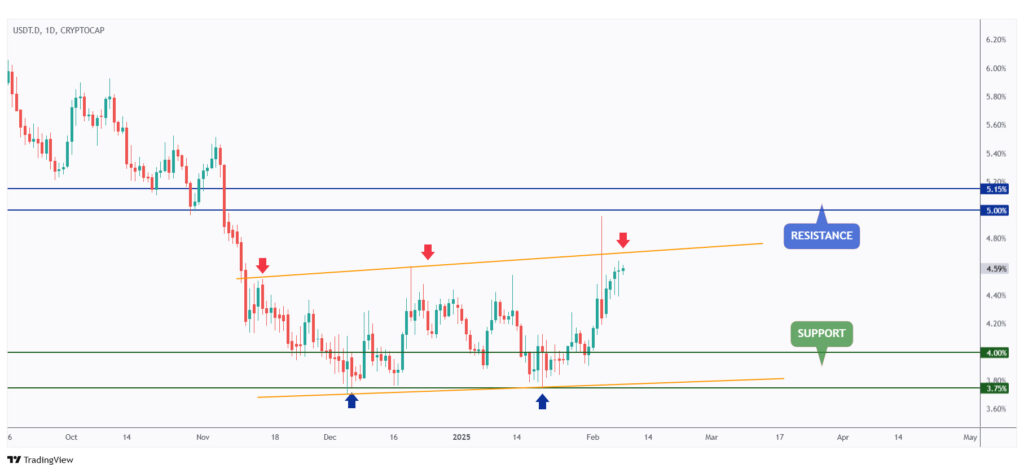
As per our last USDT.D analysis, it is still nearing the upper bound of its range, marked in orange.
As long as the upper orange trendline holds, a bearish correction from here is very likely.
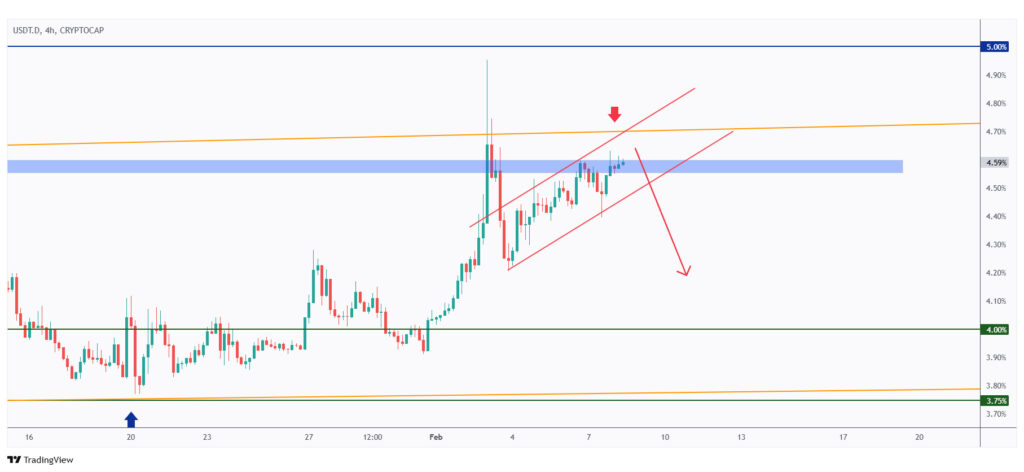
For the bears to finally take over and initiate the bearish correction phase— which would be positive for crypto— a break below the rising red channel is needed.
Meanwhile, more pain is expected.
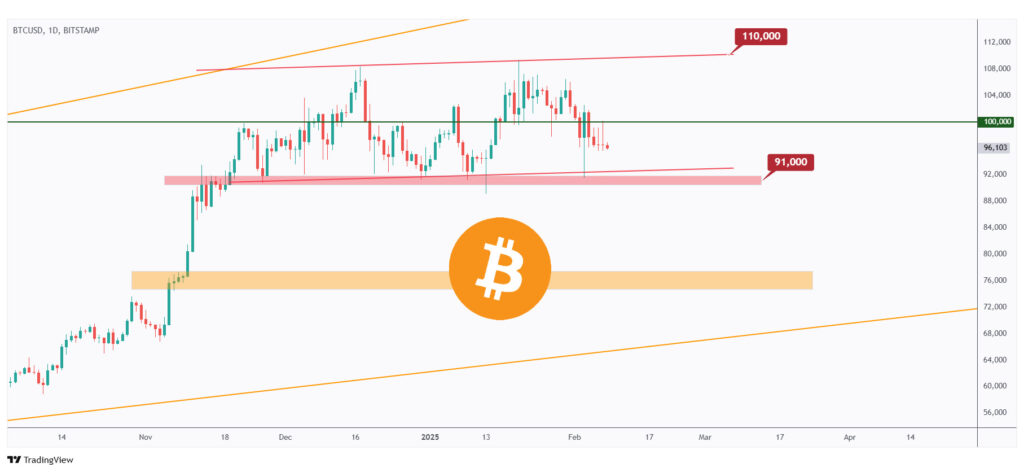
BTC has been bearish in the short term after breaking below the $100,000 mark, as mentioned in our last market overview.
As it approaches $91,000, we will be looking for short-term longs as long as the support holds.
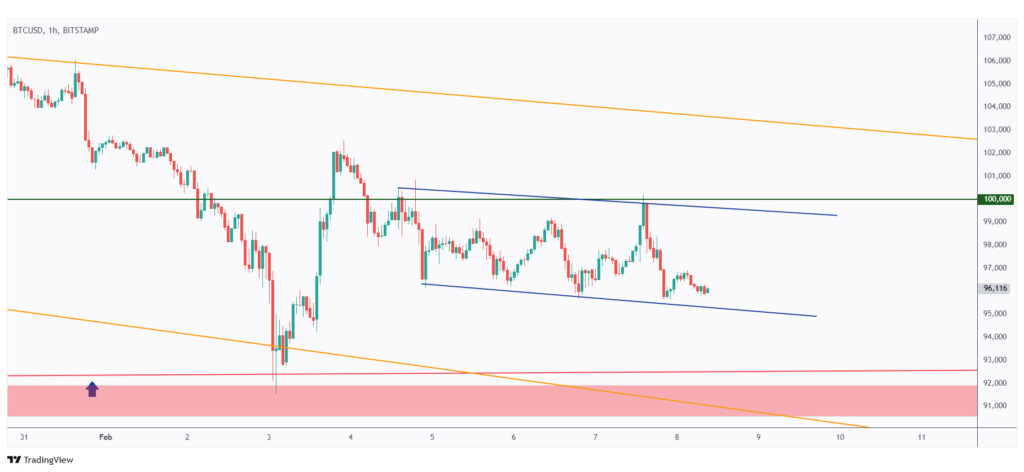
As BTC hovers around the lower bound of its short-term range, marked in blue, we expect the bulls to step in soon to retest the $100,000 resistance level.
However, if the lower blue trendline is broken to the downside, a deeper correction toward $91,000 could be possible.
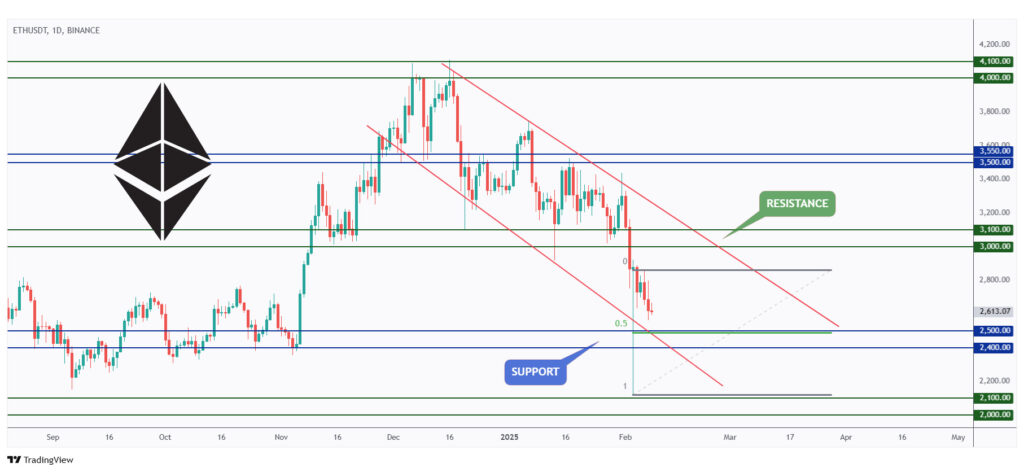
As Richard mentioned in his last YouTube short, ETH is filling 50% of the wick caused by Trump imposing tariffs on Mexico, Canada, and China.
The 50% Fibonacci level aligns perfectly with the $2,500 round number and the lower bound of the red channel.
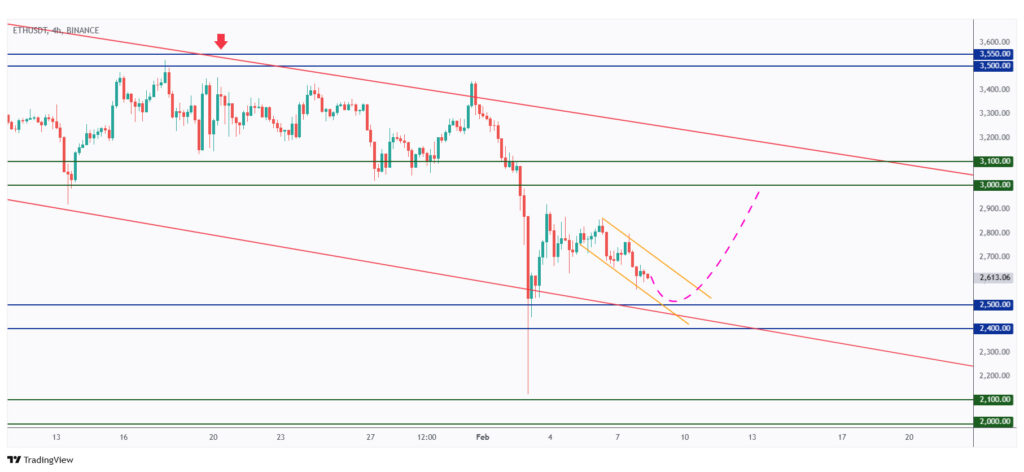
For the bulls to shift the momentum in their favor and drive ETH toward the $3,000 round number, a break above the falling channel marked in orange is needed.
Quotes / Advices
When it’s raining gold, reach for a bucket, not a thimble.
~ Warren Buffett
Closing Remarks
In summary, the crypto market continues to experience turbulence as BTC remains in a correction phase after losing the $100,000 mark, with a key support level at $91,000 in focus.
Meanwhile, ETH is filling a key wick, aligning with the $2,500 Fibonacci level, with bulls needing a breakout above the falling channel to regain momentum.
US500 is showing signs of a correction after rejecting the upper bound of its channel, while the DXY remains strong above $107, creating additional pressure on risk assets.
Gold, on the other hand, continues its rally after breaking its all-time high, with $3,000 in sight.
For a sustained crypto recovery, USDT.D needs to break below its rising red channel, signaling a shift toward risk-on sentiment. Until then, more downside or consolidation is likely.