

Welcome to our latest crypto market outlook for February 5th!
Altcoins are struggling as President Trump has imposed tariffs on Mexico, Canada, and China. Here are five altcoins rejecting strong support this week: FLOW, TRUMP, JTO, ENA, and JASMY.
Today, we will cover the following topics:
– USDT.D and BTC Analysis
– 5 Altcoins Analysis
– Quotes / Advices
– Closing Remarks
USDT.D and BTC analysis
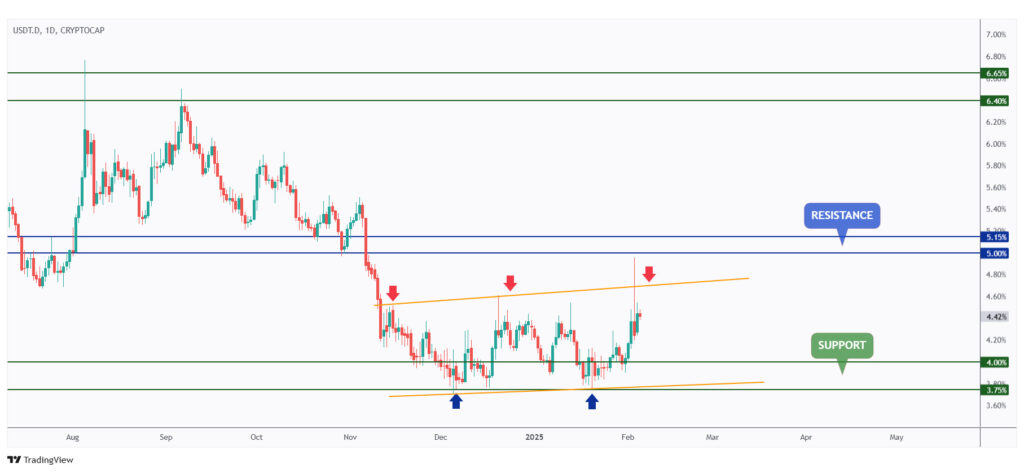
As expected in our last market outlook, USDT.D is rejecting the upper boundary of its range, marked in orange.
The higher USDT.D rises, the closer it gets to the upper orange trendline, which represents an overbought zone.
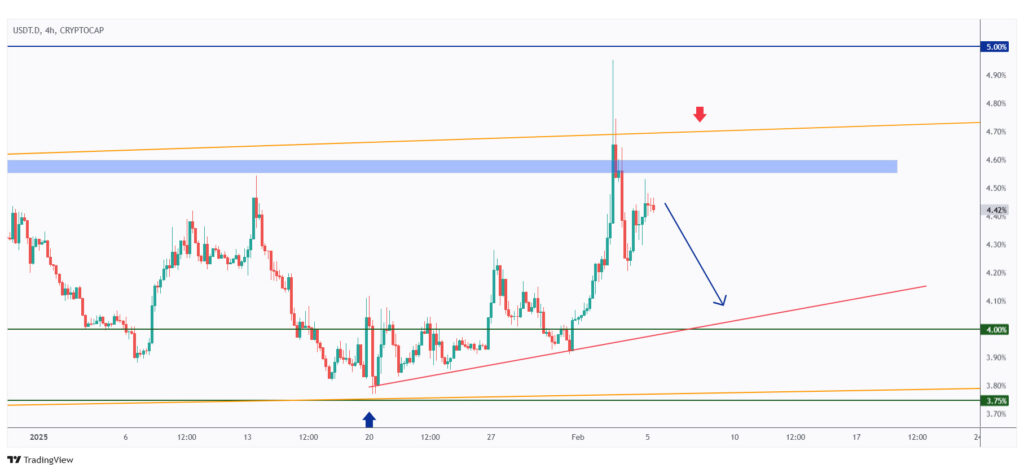
As USDT.D hovers around the upper boundary of the range and supply zone, we anticipate a bearish correction from this level. This would be a healthy development for the crypto market after two challenging weeks.
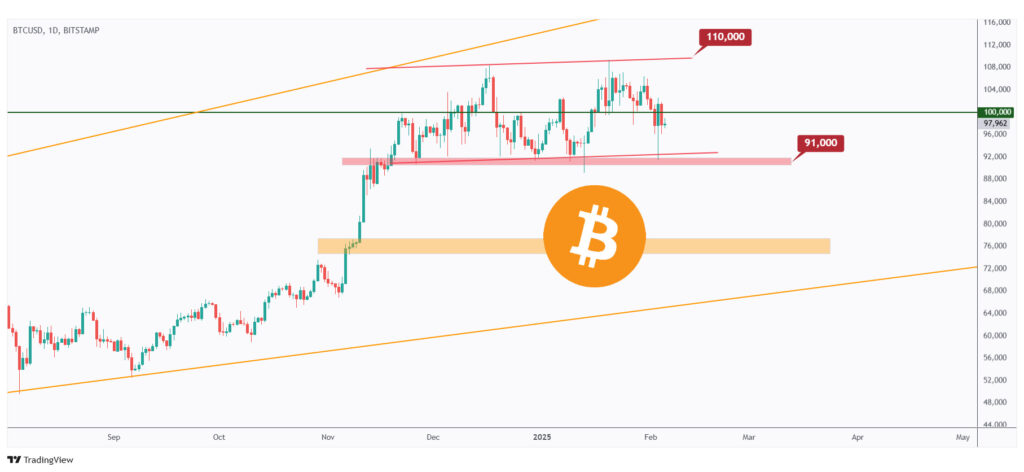
BTC is still holding strong, hovering around the $100,000 round number.
As mentioned in our last BTC analysis, as long as the $91,000 structure remains intact, the overall bias will stay bullish.
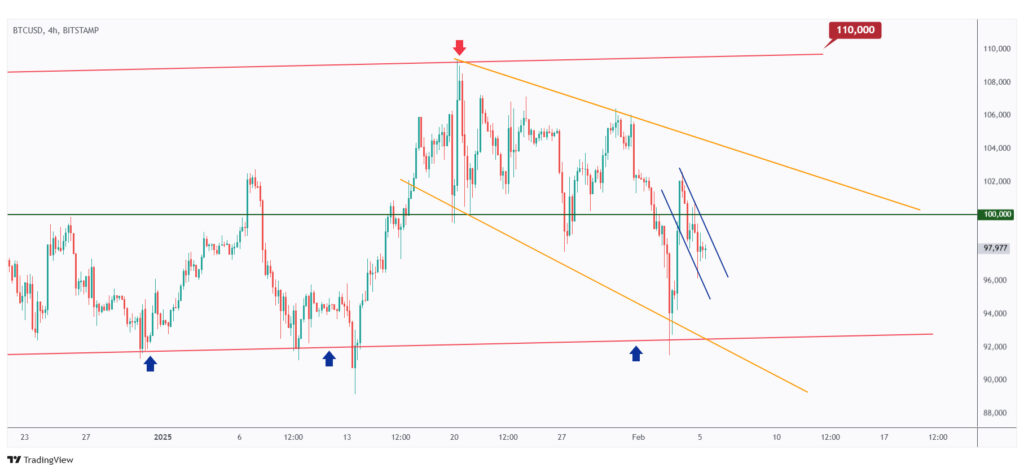
Short-term, BTC is forming a flag pattern, which is typically a bullish continuation signal.
For the bulls to regain control, a break above the blue channel is required. In this scenario, a move toward the upper orange trendline is expected.
Until then, BTC will remain bearish in the short term, with a continuation toward the lower boundary of the red channel anticipated.
5 Altcoins Analysis
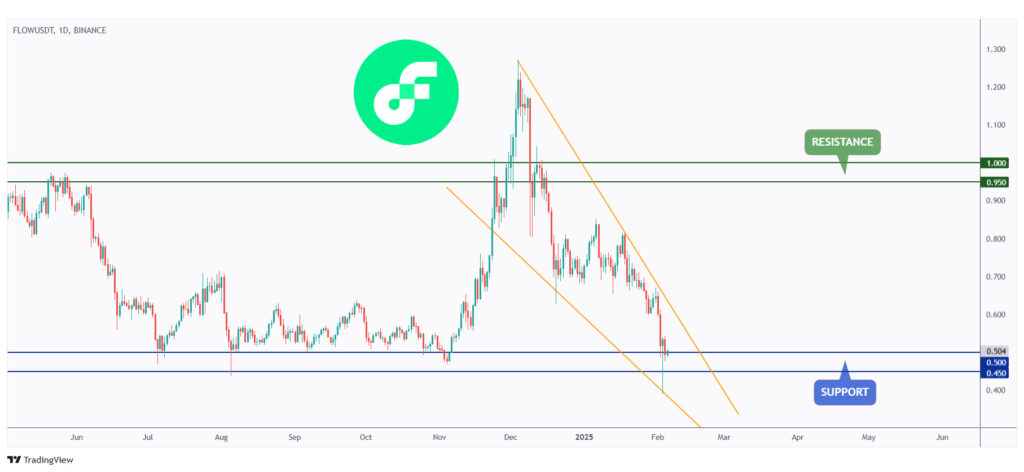
As per our last FLOW update, it is currently hovering around a major support level and the round number of $5.
As long as the lower boundary of the support at $4.5 holds, we expect the bulls to step in at any moment.
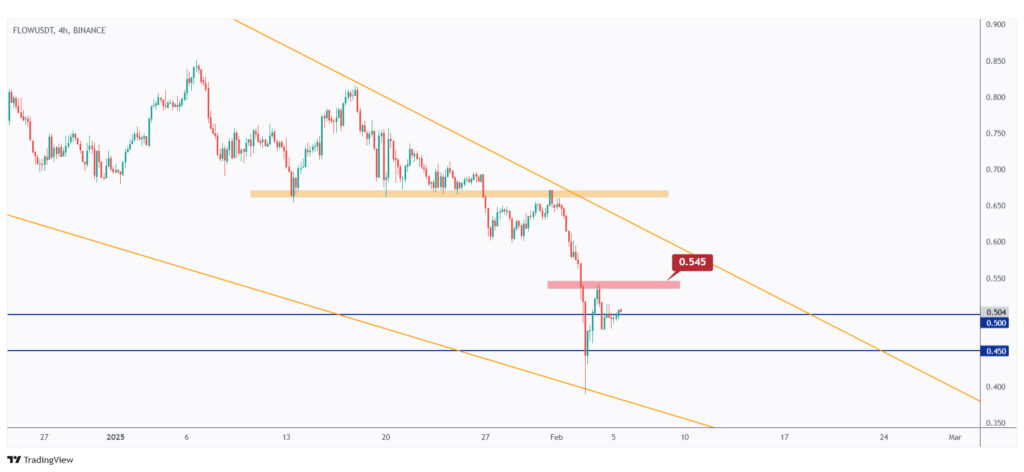
On the 4H timeframe, FLOW is rejecting the lower boundary of the daily falling wedge pattern, marked in orange.
For the bulls to gain control in the short term, a break above the last major high at $0.545 is required.
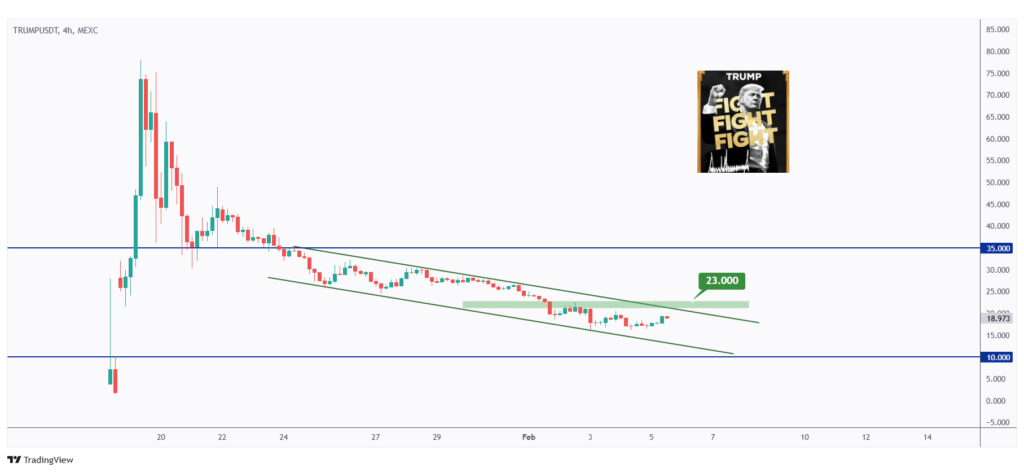
Two days after its launch, TRUMP has been in a deep bearish trend.
This week, TRUMP has been trading within a flat falling channel, marked in green.
For the bulls to shift momentum in their favor, a break above the last major high at $23 is necessary.
Until then, the bears will remain in control, with a move toward the $10 round number on the horizon.
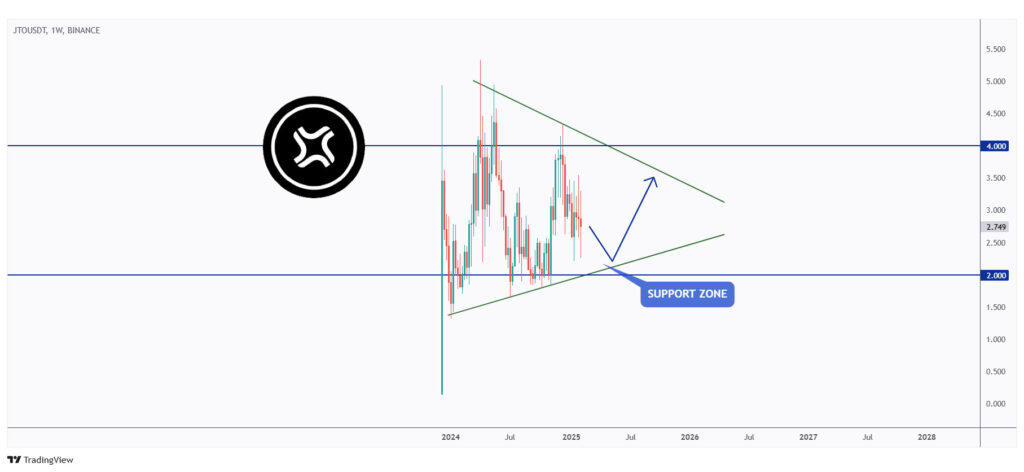
Next up is JTO, which has been consolidating within a large range forming a symmetrical triangle, marked in green.
As it approaches the lower boundary of the triangle, aligning perfectly with the $2 round number, we will be looking for medium-term long opportunities on lower timeframes.
Once the bulls take control, the first target would be the $4 mark, representing the upper boundary of the triangle.
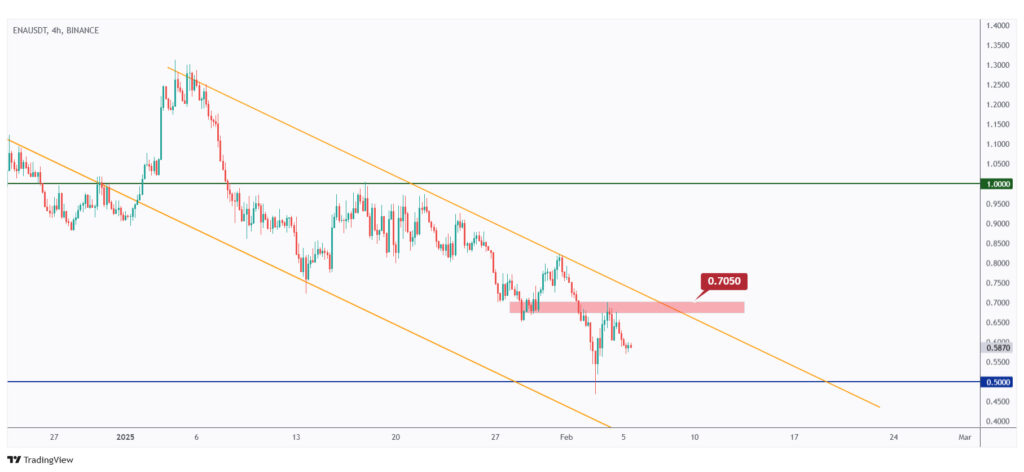
Analyzing ENA, it has been in an overall bearish trend, trading within the falling channel marked in orange.
However, it is now approaching a strong support level at the $5 round number. As long as this support holds, we will be looking for long opportunities on lower timeframes.
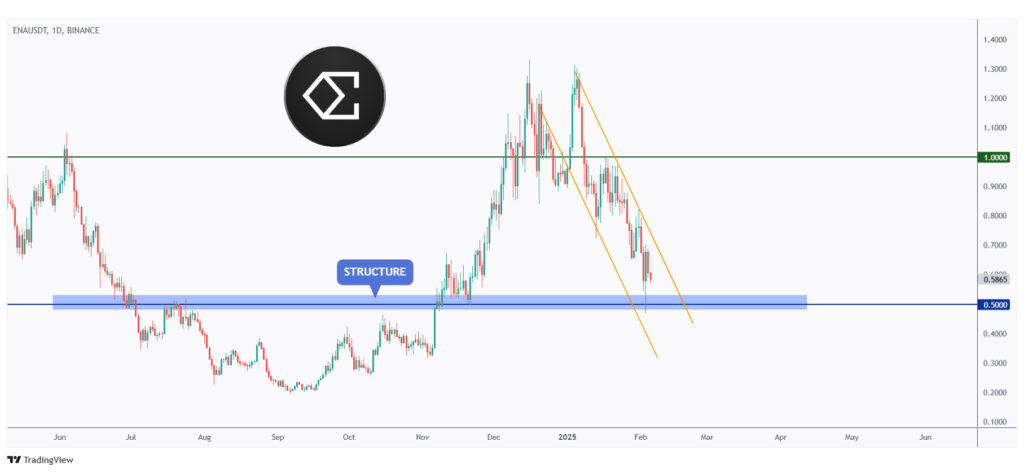
For the bulls to regain full control and shift momentum in their favor, a break above the last major high at $0.705 is required.
This would pave the way for a push toward the $1 round number.
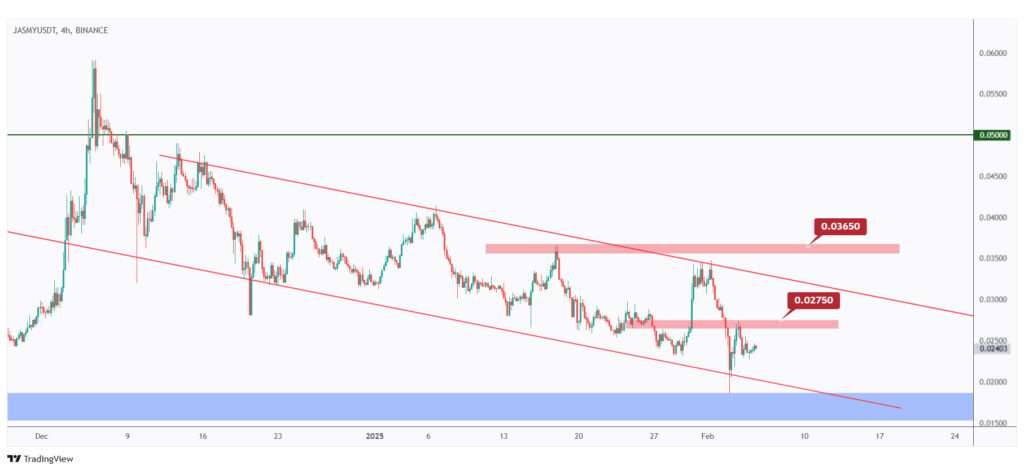
Last but not least, JASMY is rejecting a major support level at the intersection of the lower boundary of its channel and the $0.015 round number.
As long as the $0.015 level holds, the bias will remain in favor of the bulls.
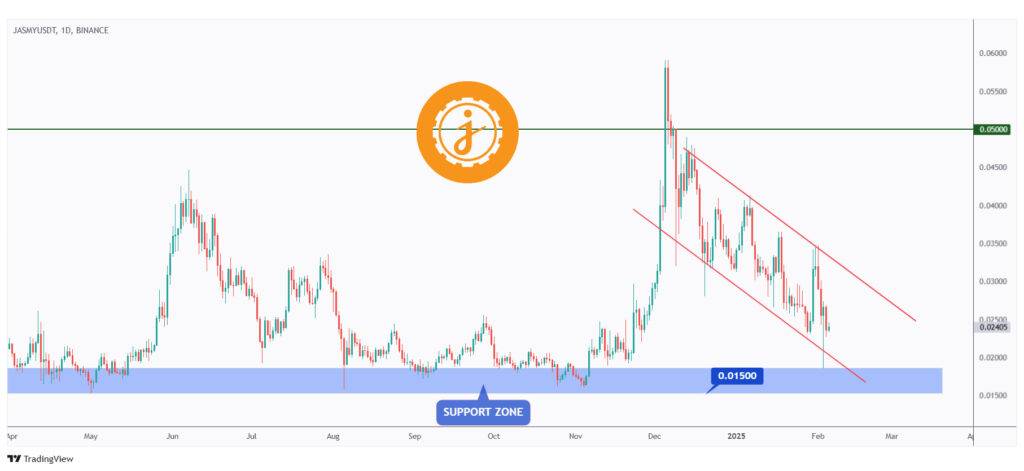
For the bulls to gain short-term control, a break above the minor structure at $0.0275 is needed.
For long-term bullish momentum to establish, a breakout above the upper red trendline and the $0.0365 level is required.
Quotes / Advices
An investor without investment objectives is like a traveler without a destination.
~ Ralph Seger
Closing Remarks
In summary, USDT.D is rejecting the upper boundary of its range and approaching an overbought zone. A bearish correction is expected, which would be beneficial for the broader crypto market.
BTC remains strong around $100,000, with a bullish bias as long as the $91,000 support holds. In the short term, a bullish breakout from the flag pattern is needed to confirm further upside.
FLOW: Hovering around a key support level at $5, with bullish potential if $4.5 holds. A breakout above $0.545 is required for short-term bullish momentum.
TRUMP: Trading in a flat falling channel. Bulls need a break above $23 to regain control; otherwise, a move toward $10 is likely.
JTO: Consolidating within a symmetrical triangle. The $2 level serves as key support, with a potential upside target at $4 if bulls take over.
ENA: Trading in a bearish channel but nearing strong support at $5. A break above $0.705 is needed to push toward the $1 round number.
JASMY: Holding key support at $0.015. A breakout above $0.0275 would signal short-term bullish momentum, while long-term strength requires a move above $0.0365.