Welcome to another crypto market outlook for the 2nd of August!
August is finally here, bringing massive long opportunities as almost all altcoins are trading at a discount. Should you panic sell, or is it time to fill your bags? Let’s go over the possibilities together.
Today, we will cover the following topics:
– Market Heatmap and Fear and Greed Index
– US500 and DXY
– USDT.D, Bitcoin and Ethereum Analysis
– Quotes / Advices
– Closing Remarks
Market Heatmap and Fear and Greed Index
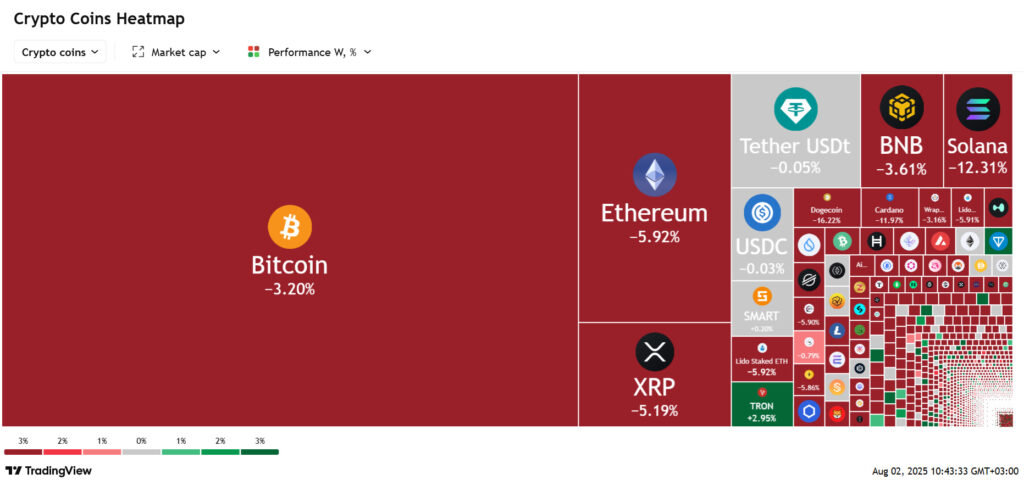
The 7-day crypto market has been bleeding this week, with BTC down over 3% and ETH around 6%, dragging the entire crypto ship down with them.
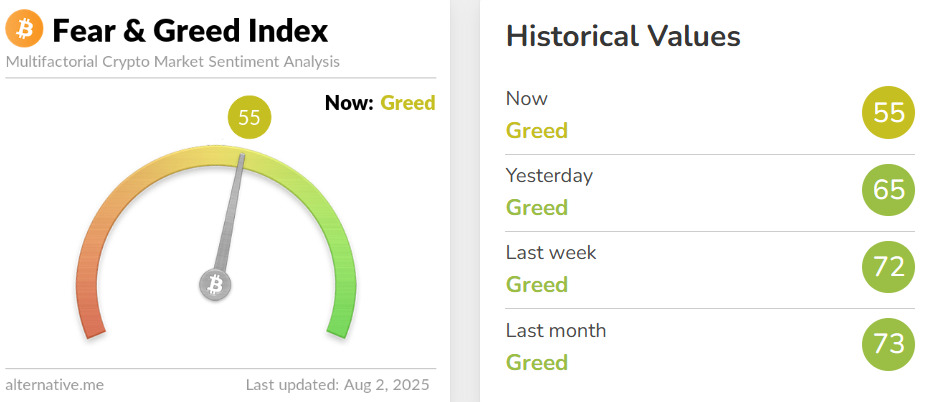
The Fear and Greed Index is still signaling “Greed,” but the meter has been dropping significantly throughout the week, indicating that traders are becoming less greedy as the market continues to dip.
US500 and DXY analysis

As per our latest US500 analysis, it has been bearish this week, retesting its previous all-time high around $6,150.
As long as the $6,000 round number and support hold, the overall bias remains bullish.
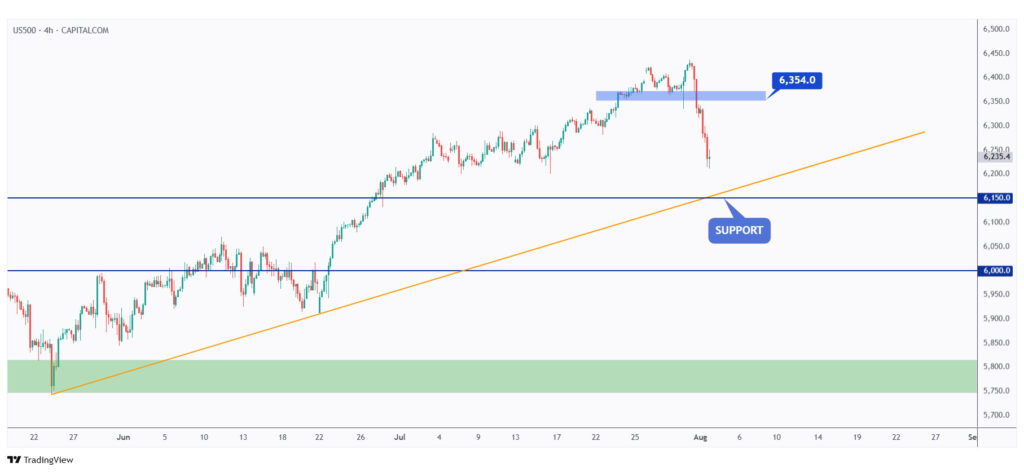
After breaking below the last major low marked in blue at $6,354, US500’s momentum has shifted from bullish to bearish.
This week, US500 is approaching a strong support zone aligned with the lower orange trendline, making it a potential rejection area where we expect the bulls to take over again.
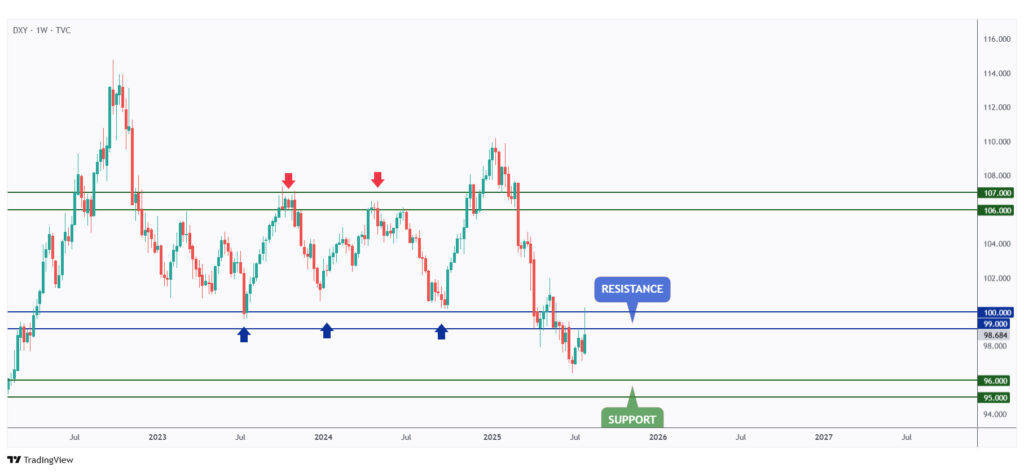
DXY rejected our $99–$100 resistance zone perfectly.
As long as this resistance holds, the only way from here is down — which would be a positive sign for the crypto market.
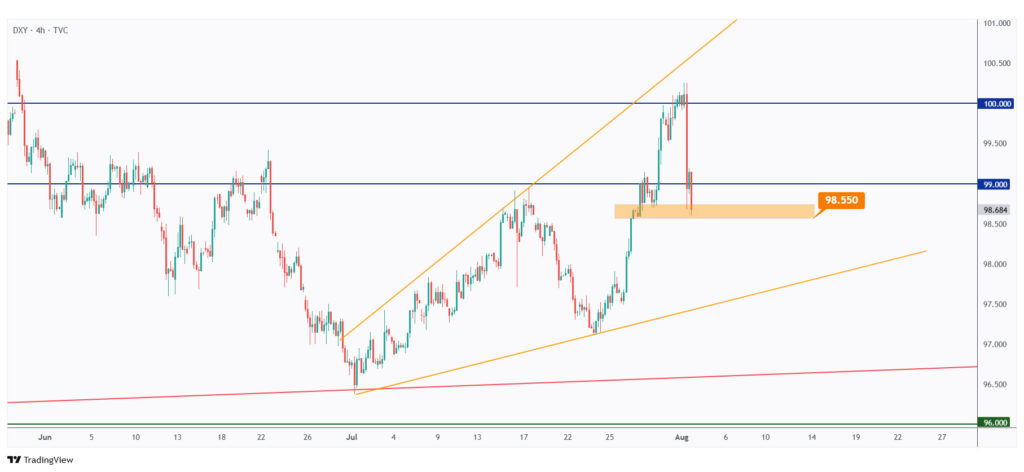
For the bears to remain in control and push toward the lower bound of the rising wedge pattern in orange, a break below the last low at $98.55 is needed.
In that case, a move toward $97.5 would be expected.
USDT.D, Bitcoin, and Ethereum analysis

As per our last market outlook, USDT.D has been retesting the upper bound of the falling orange channel.
As long as the 4.61% resistance level holds, we expect the bears to kick in soon on USDT.D — which would be bullish for crypto.

Medium-term, USDT.D has been trading within the rising wedge pattern marked in red.
The upper red trendline represents an overbought zone, so a reversal is expected soon.
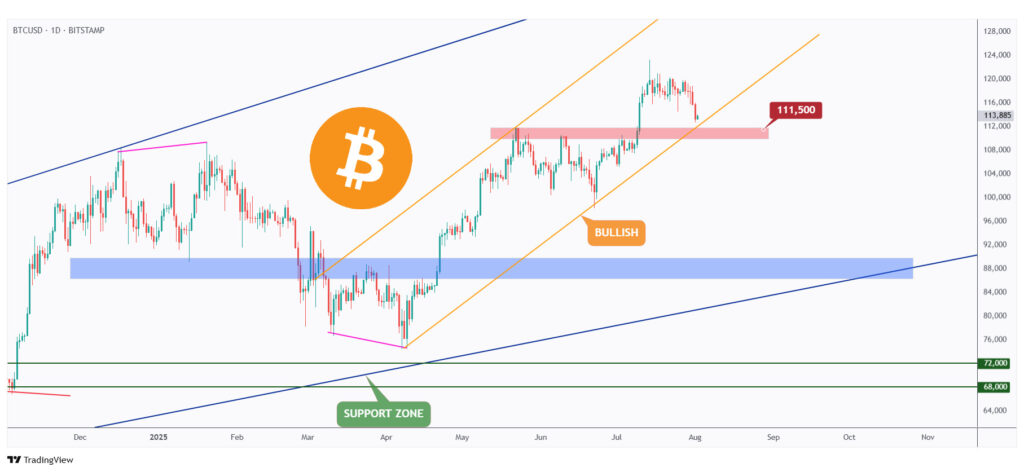
As per our last BTC update, it is still holding strong within the rising orange channel.
As long as the red-marked structure at $111,500 holds, we expect the bulls to kick in soon and start the next upward impulse movement.
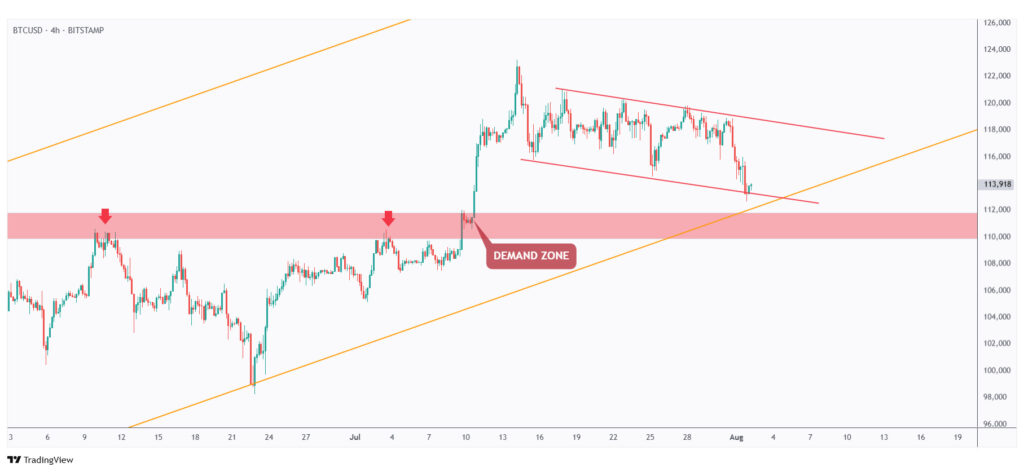
The bearish correction phase has been contained within the falling channel marked in red.
As long as the lower red trendline holds, we expect a short-term bullish movement toward the upper red trendline.
For the bulls to take over long-term and start the next major impulse movement, a break above the upper red trendline is needed.
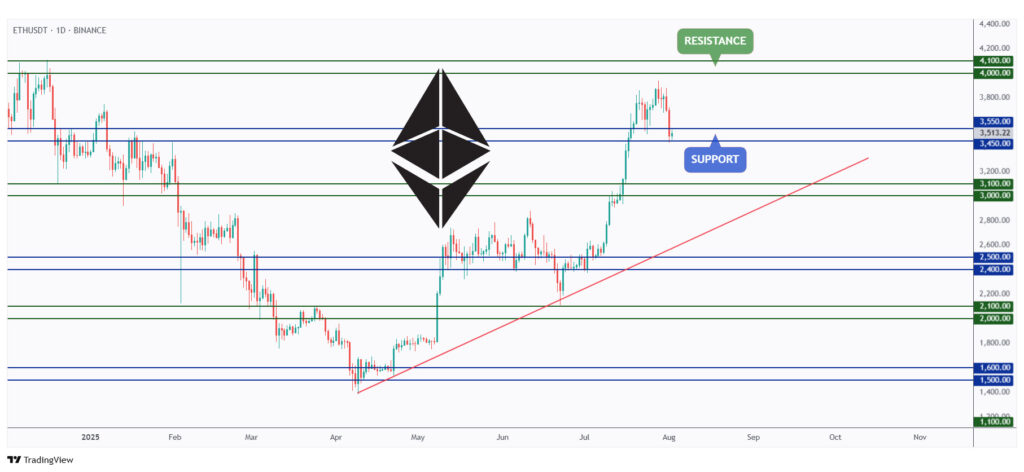
As per our last ETH analysis, it rejected the $4,000 resistance zone and traded lower throughout the week.
Today, ETH is hovering around the $3,500 support level. As long as this support holds, we expect the bulls to take over soon.

For the bulls to take over and confirm a rejection of the $3,500 support, a break above the last major high at $3,590 is needed.
In parallel, if $3,450 is broken downward, more pain can be expected in the crypto market.
Quotes / Advices
A good trader watches his capital as carefully as a professional scuba diver watches his air supply.
~ Anonymous
Closing Remarks
In summary, August kicks off with major opportunities across the crypto space, as most altcoins are trading at a discount. Despite BTC and ETH dropping by over 3% and 6% respectively, the overall market structure remains intact. The Fear and Greed Index is still showing “Greed,” though sentiment has weakened.
US500 is retesting key support, while DXY is facing rejection at resistance — both signs that could favor crypto bulls. Meanwhile, USDT.D is approaching overbought levels, suggesting a potential shift back into risk assets.
BTC continues to trade within its rising channel, and ETH is hovering at a critical $3,500 support. If support levels hold and key breakouts occur, the next impulse wave could soon begin.