

The crypto market is still melting, and it feels like the bull run is already over, as many altcoins are making lower daily lows this week. But don’t lose hope — the weekly support is still holding firmly, so you can still look for potential entries on your favorite altcoins at a discount.
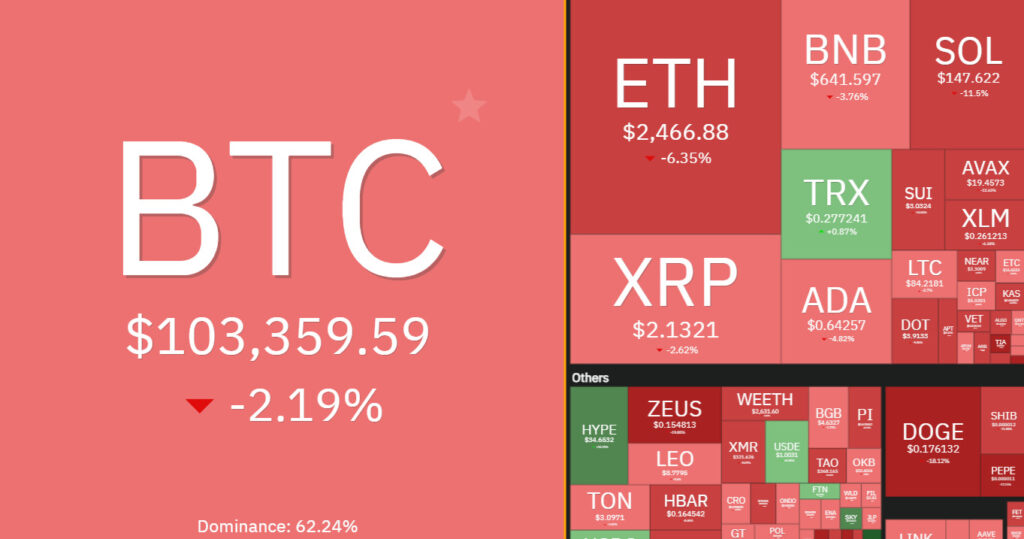
7 Days Heatmap
The crypto heatmap is still screaming red, as almost all altcoins are closing the week bearish. BTC broke its daily structure, causing ETH to dip by over 6% and dragging the entire market down with it.
BTC Analysis
As mentioned in our last BTC update, it is hovering around a make-or-break zone.
If the major low and structure marked in orange at $101,500 are broken to the downside, a larger bearish move toward the $95,000 support could be on the horizon.
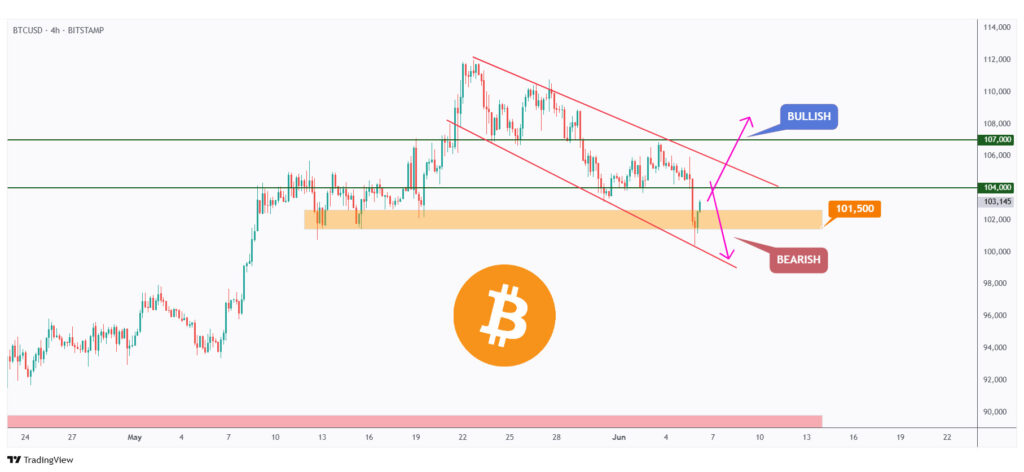
In parallel, for the bulls to take over again and ignite the next major bullish wave, a break above the upper red trendline and the $107,000 resistance level is needed.
ETH Analysis
As per our latest ETH update, it has been retesting the lower bound of its rising channel and the $2,400 support level.
As long as $2,400 holds, the bulls could still step in for another impulsive move toward the upper bound of the channel at $2,800.
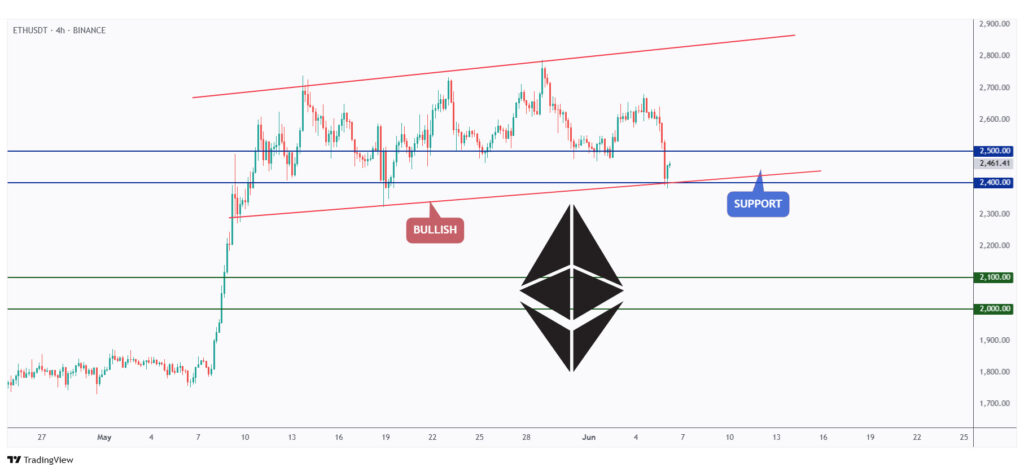
In parallel, if the $2,400 support is broken to the downside, a deeper correction toward the $2,100 level would be anticipated.
Quote of the week
I’ll tell you how to become rich: close all doors, beware when others are greedy and be greedy when others are afraid.
~ Warren Buffett
Closing Remarks
In summary, the crypto market remains under pressure, with most altcoins closing bearish and the heatmap flashing red across the board.
BTC has broken its daily structure and is now hovering around a critical make-or-break zone. A drop below $101,500 could trigger a deeper correction toward $95,000, while a breakout above $107,000 may signal a fresh bullish wave.
Meanwhile, ETH is retesting its $2,400 support within a rising channel. If this level holds, a move toward $2,800 remains in play — but if it breaks, a drop toward $2,100 could follow.