Welcome to another crypto market outlook for the 6th of July!
Altcoin season is taking longer than expected to kick off. However, traders remain optimistic, believing that summer is typically a favorable time for crypto, as people tend to travel, spend, and invest more during this period. Will this summer be any different? Let’s find out together in this article.
Today, we will cover the following topics:
– Market Heatmap and Fear and Greed Index
– US500 and DXY
– USDT.D, Bitcoin and Ethereum Analysis
– Quotes / Advices
– Closing Remarks
Market Heatmap and Fear and Greed Index
The overall sentiment remains indecisive, as the heatmap reflects a mix of red and green. While BTC has been stagnant, ETH and several altcoins are gaining strength—whereas others continue to slowly decline.

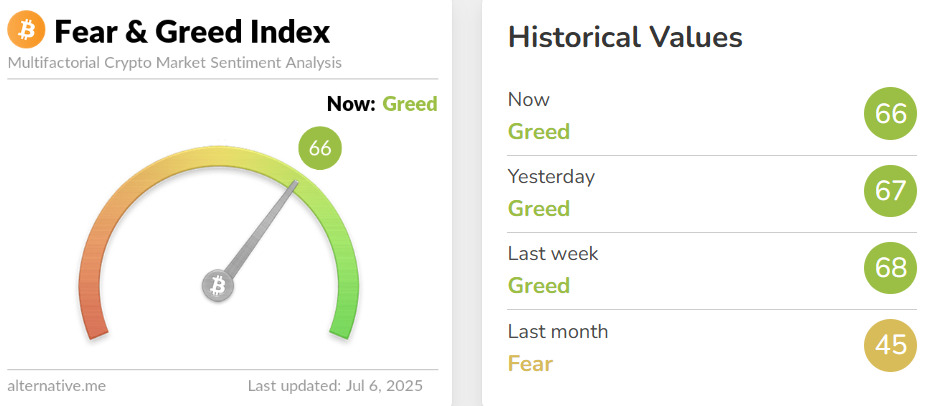
Despite the boring weeks, the Fear and Greed Index still signals Greed, indicating that investors remain persistent and are still anticipating the next big move.
US500 and DXY analysis

As mentioned in our previous market outlook, the US500 remains strong after breaking above its all-time high last week.
As long as the price holds above this previous high, the overall sentiment stays bullish.
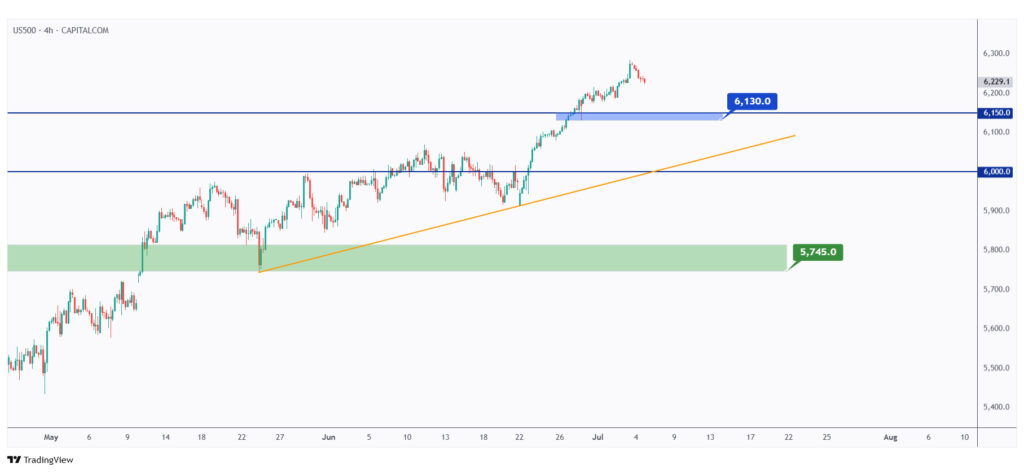
From a medium-term perspective, as long as the structure marked in blue at $6,130 holds, the overall bias remains bullish.
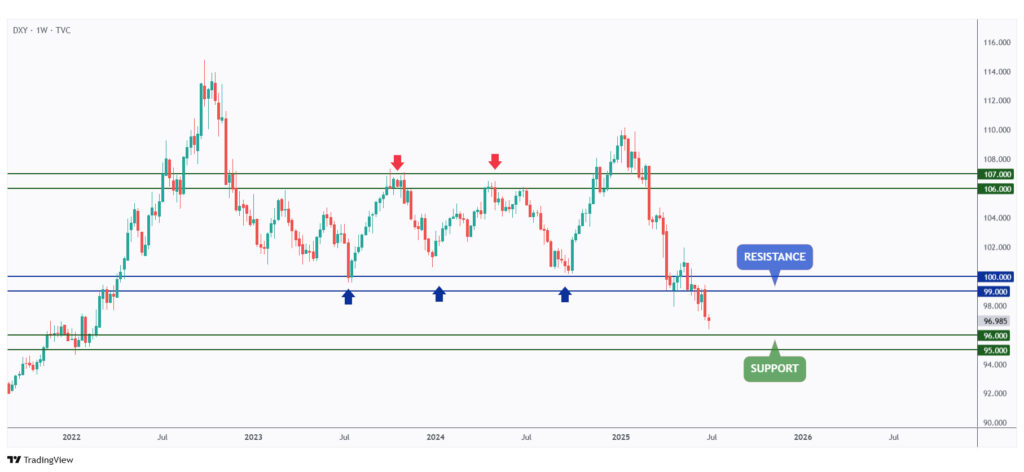
DXY remains overall bearish, trading toward the $95–$96 support zone.
This zone is acting like a magnet, drawing the price toward it, as it represents the intersection of a key demand zone, a strong horizontal support, and the lower bound of the rising channel on the monthly timeframe.

As long as DXY trades below the last major high marked in red at $97.50, the overall bias remains bearish, and a move toward the lower orange and red trendlines is expected.
USDT.D, Bitcoin, and Ethereum analysis
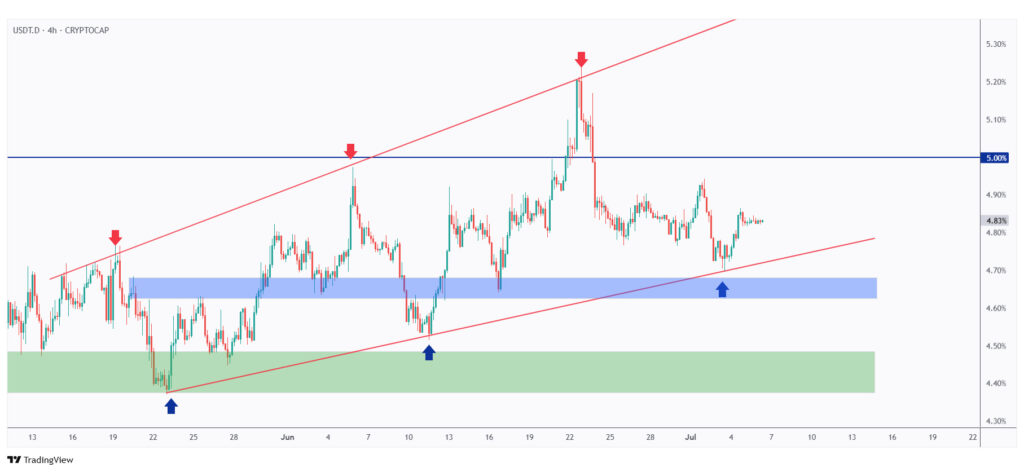
As highlighted in our latest market overview, USDT.D rejected the lower bound of the rising red channel and has been trading higher since.
As long as the blue support at 4.65% holds, the overall sentiment for USDT.D remains bullish — which in turn implies a bearish outlook for the crypto market.
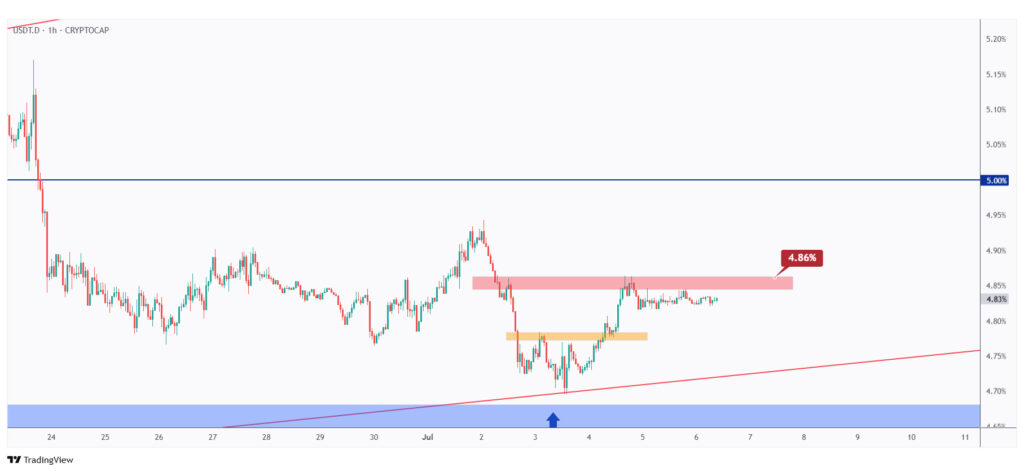
If the last major high at 4.86% is broken to the upside, the bulls will remain in control and likely push toward the 5% mark — signaling a bearish impulse for crypto.
Conversely, as long as the red-marked high holds, the bears could still take over on USDT.D, potentially triggering a bullish impulse in the crypto market.
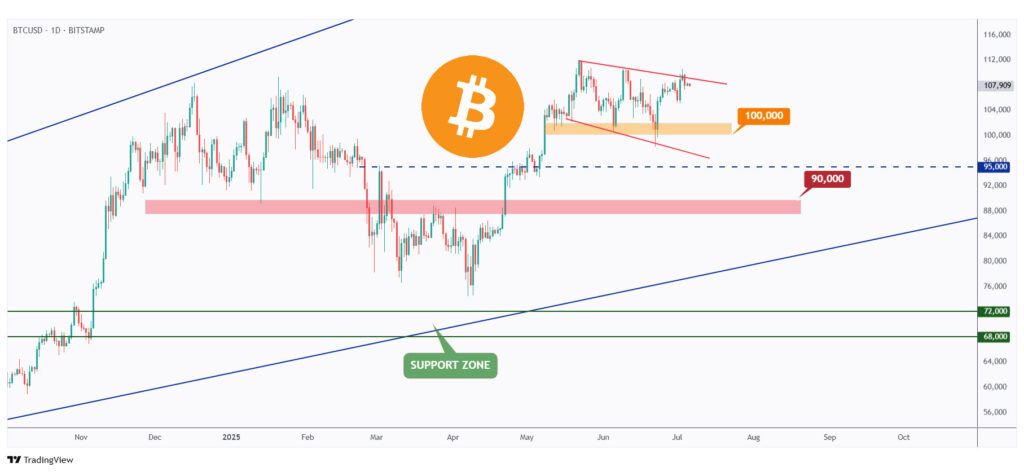
As mentioned in our last roundup article, BTC continues to reject the upper boundary of its falling channel marked in red.
As long as this upper red trendline holds as resistance, the bears will maintain the upper hand.

For the bulls to fully shift the momentum in their favor, a break above the last major high at $110,500 is required.
Meanwhile, if the last low at $107,000 is broken to the downside, a bearish correction toward the $100,000 support zone would be expected.

ETH is retesting the $2,400–$2,500 support zone this week. As long as the $2,400 level holds, we expect the bulls to regain control soon.

For the bulls to take over and initiate the next bullish impulse, a break above the last major high marked in orange at $2,532 is needed.
Meanwhile, the bears remain in short-term control, with a move toward the $2,400 support level likely.
Quotes / Advices
Do not be embarrassed by your failures, learn from them and start again.
~ Richard Branson
Closing Remarks
In summary, despite a slow start to altcoin season, market participants remain hopeful as summer unfolds. The overall sentiment is mixed, with BTC showing stagnation, ETH gaining strength, and altcoins moving in both directions.
Key indicators like the Fear and Greed Index still show investor optimism. The US500 remains bullish above its all-time high, while DXY is heading toward critical support.
USDT.D is gaining, signaling short-term pressure on crypto, and both BTC and ETH are at key technical levels that could soon determine the next major move.