
Welcome to our latest crypto market outlook for August 19th!
The crypto market has been in a correction phase for the second week in a row. But don’t worry — it’s completely normal to see a bearish move after a strong pump. This is actually the perfect time to look for potential entries on your favorite tokens. Here are the ones on my watchlist this week: HYPE, POL, TEL, XMR, and ZRO.
Today, we will cover the following topics:
– BTC Analysis
– 5 Altcoins Analysis
– Quotes / Advices
– Closing Remarks
BTC analysis
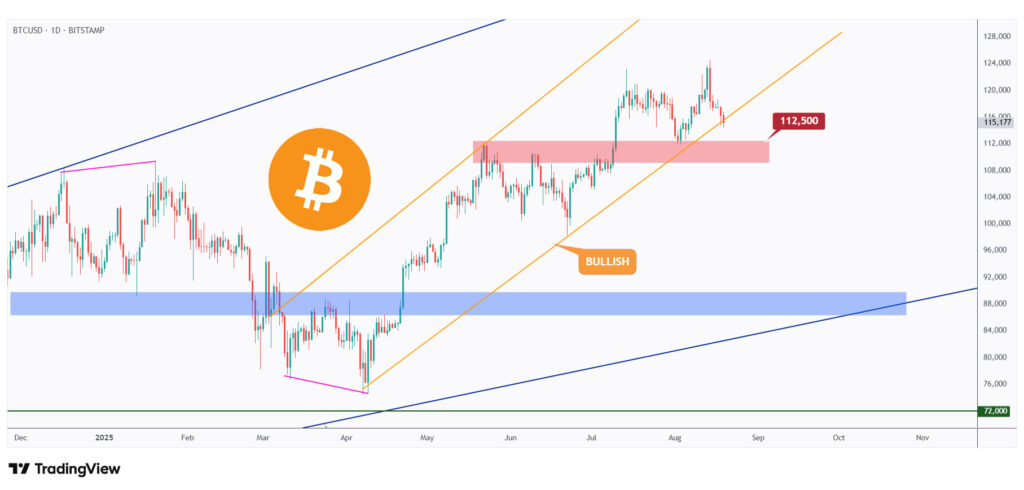
As per our latest BTC analysis, it has been in a correction phase for nearly two weeks.
However, the overall outlook remains bullish as long as the $110,000 – $112,500 support zone holds.
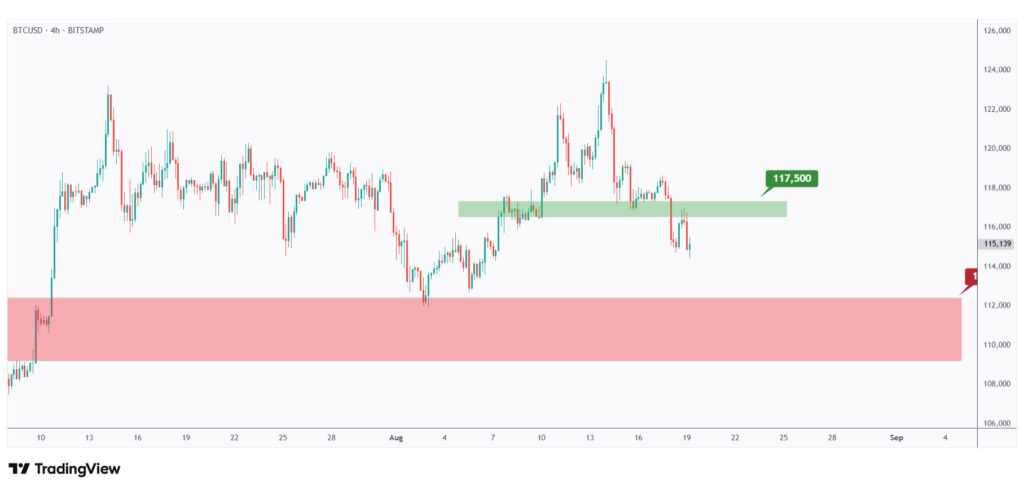
For the bulls to take control again and trigger the next impulse move, a break above $117,500 is needed.
In the meantime, BTC remains bearish in the short term and could still dip deeper into the support zone toward the $110,000 level.
5 Altcoins Analysis
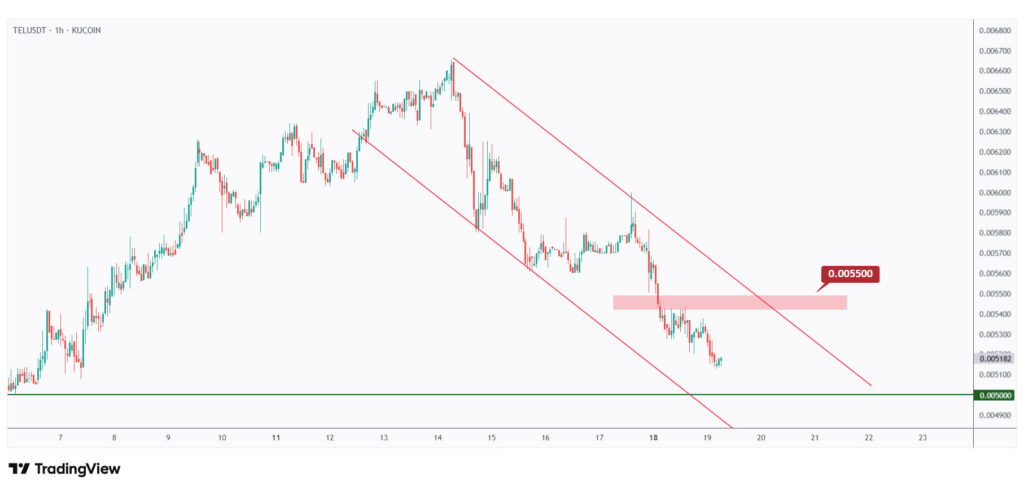
TEL is currently bouncing off a strong support zone around the $0.005 round number.
As long as the lower bound of support at $0.0045 holds, we will continue looking for trend-following longs on lower timeframes.
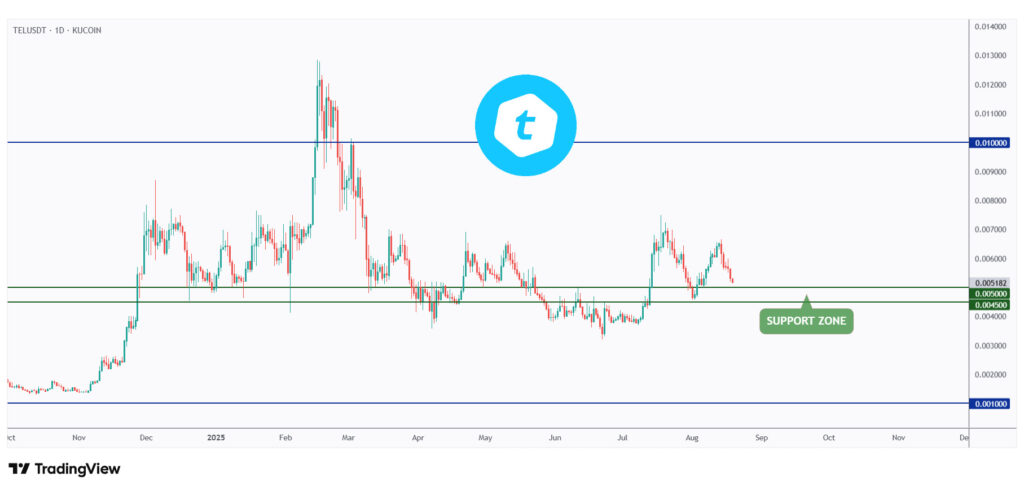
In the short term, TEL has been bearish, trading within the falling channel marked in red.
For the bulls to take over again and shift momentum in their favor, a break above the upper red trendline and the last major high at $0.0055 is needed.
XMR has been overall bullish from a macro perspective, trading above the rising orange trendline that is acting as dynamic support.
Moreover, it is currently retesting a strong structure marked in green, so we will be looking for trend-following longs.
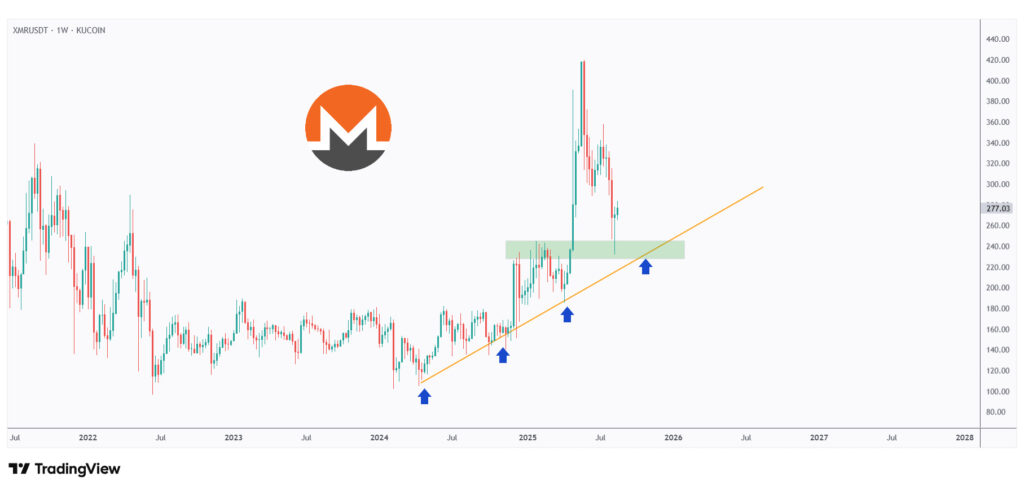
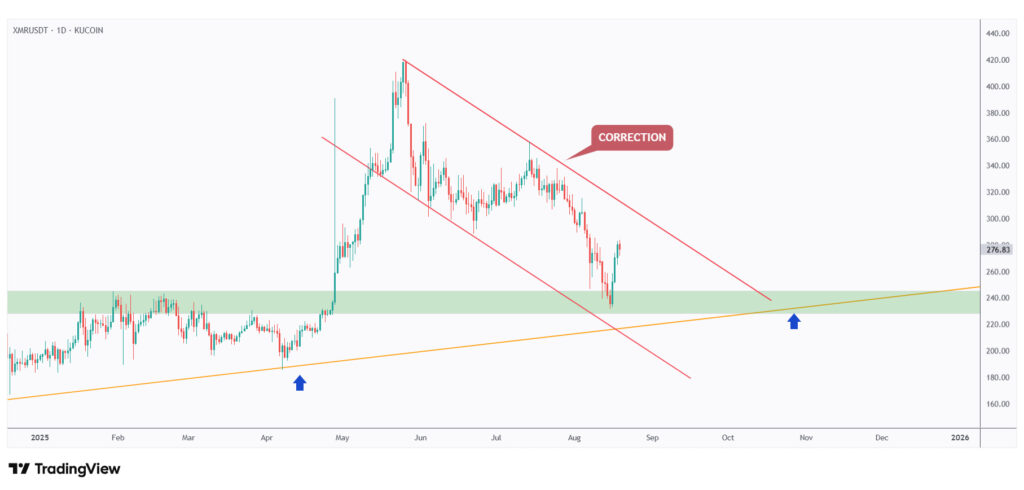
For the bulls to regain control long term and ignite the next big impulse move toward the $500 round number, a break above the falling red channel is needed.
In the meantime, as XMR retests the green support around $250, we will be looking for short-term trend-following longs, targeting the upper bound of the channel.
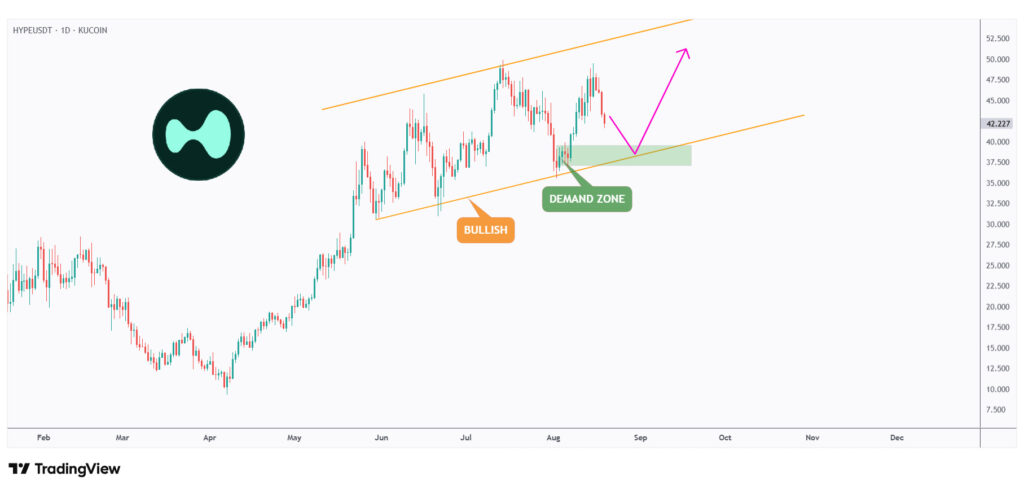
Next on the list is HYPE. It has been overall bullish, trading within the flat rising channel marked in orange.
It is currently retesting the lower bound of the channel, which perfectly intersects with the demand zone marked in green.
As long as the lower orange trendline holds as support, we will be looking for longs, anticipating the next bullish phase to begin.
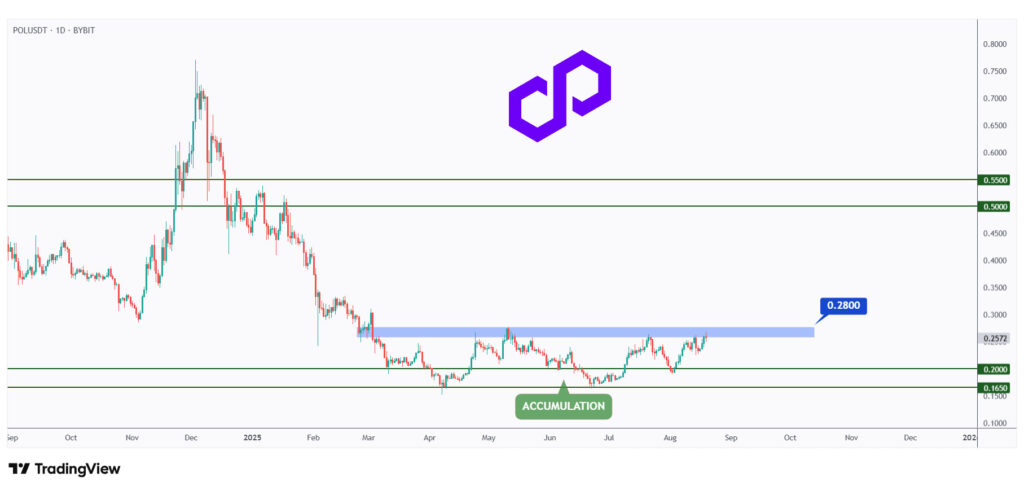
After rejecting the $0.20 support zone, as highlighted in our last market outlook, POL has been consolidating within a range, forming a major accumulation phase.
For the bulls to take over and trigger the next markup phase, a break above the $0.28 structure is needed.
In the meantime, as POL retests the $0.20 support, we will be looking for new short-term longs.
As per our last ZRO update, it is currently in a correction phase, retesting the lower bound of the channel and the $1.8 demand zone.
As long as this support holds, we will be looking for longs, anticipating the next impulse move to begin.
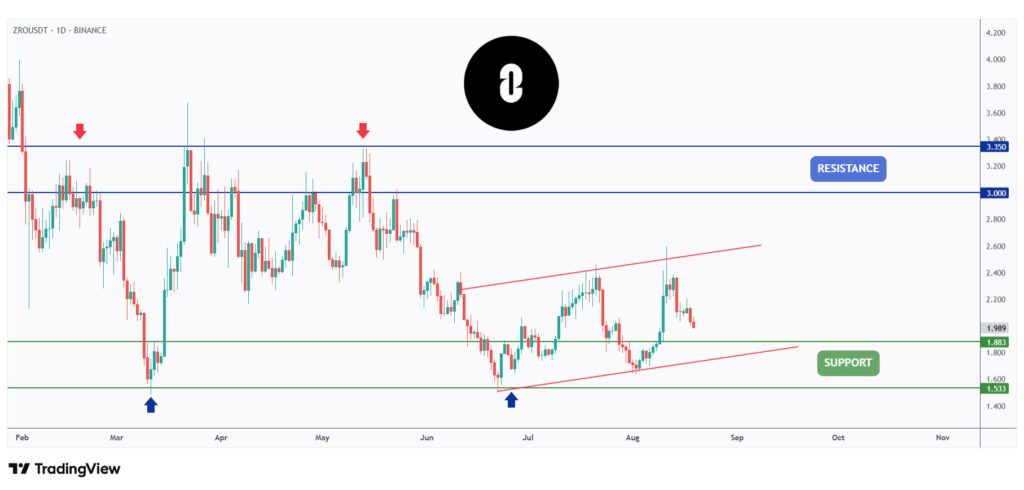
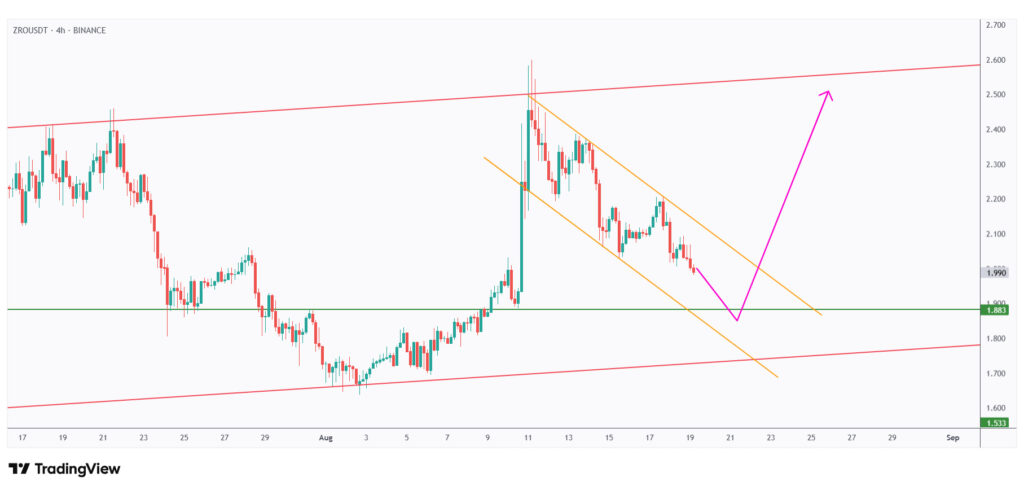
For the bulls to finally take over and kick off the bullish phase, a break above the falling orange channel is needed.
In the meantime, ZRO remains bearish in the short term and could still dip further within the daily support zone before pushing higher.
Quotes / Advices
Every trader has strengths and weaknesses. Some are great forecasters, others are good at execution. Learn what your strengths are and build on them.
~ Michael Marcus
Closing Remarks
In summary, the crypto market is still in a correction phase, which is a healthy pause after recent rallies and an opportunity to prepare for the next moves.
BTC remains bullish overall as long as the $110,000 – $112,500 support holds, with $117,500 being the key breakout level for a new impulse.
TEL is holding key support and needs a breakout above $0.0055 to confirm bullish momentum.
XMR remains bullish long-term, with $500 in sight once it clears its falling channel.
HYPE is retesting demand within its rising channel, keeping the bullish outlook intact.
POL is consolidating in an accumulation phase, with $0.28 as the breakout trigger for the markup phase.
ZRO is retesting the $1.8 support while still short-term bearish, but a break above the falling channel could kick off the next bullish phase.