

The crypto market isn’t looking good so far as the bleeding continues. However, BTC is retesting a weekly support zone. Will it hold or break? Let’s find out together.
7 Days Heatmap
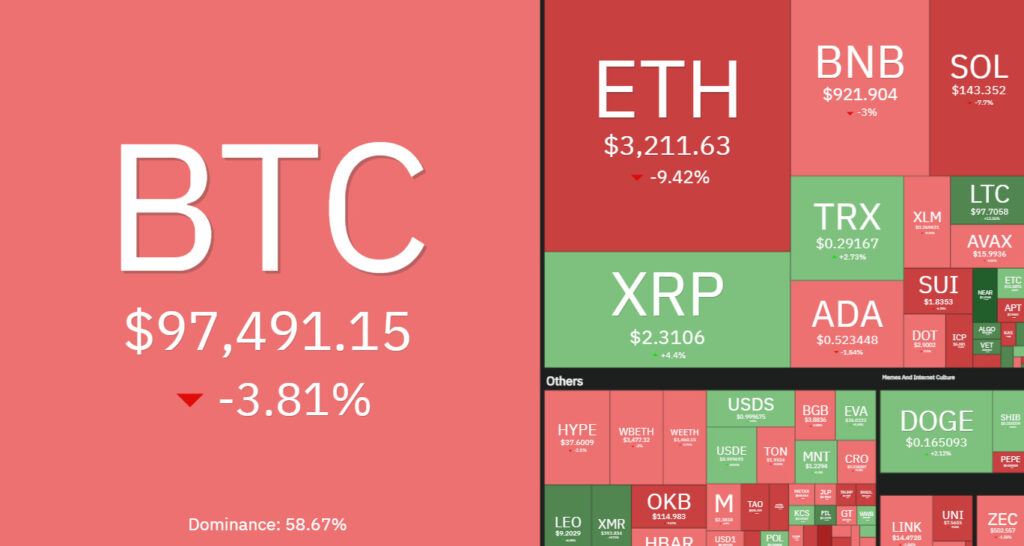
The 7-day crypto heatmap is showing all red, with BTC down over 3% and ETH down almost 10%.
BTC Analysis
As per our previous BTC update, it has been in a correction phase after breaking below its major low marked in red.
However, it remains overall bullish from a long-term perspective, as it is still trading within the rising wedge pattern marked in blue.
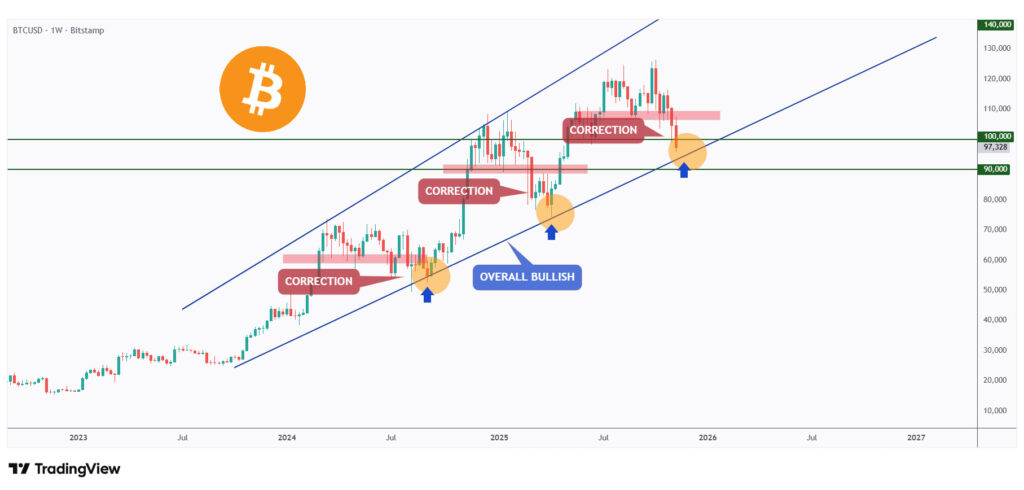
As long as the $90,000 level and the lower blue trendline hold, we will be looking for trend-following longs on lower timeframes.
ETH Analysis
As per our latest ETH analysis, it has been bearish, trading within a falling wedge pattern marked in red.
This week, ETH is retesting the lower bound of the wedge, which lines up perfectly with the $3,000 round number.
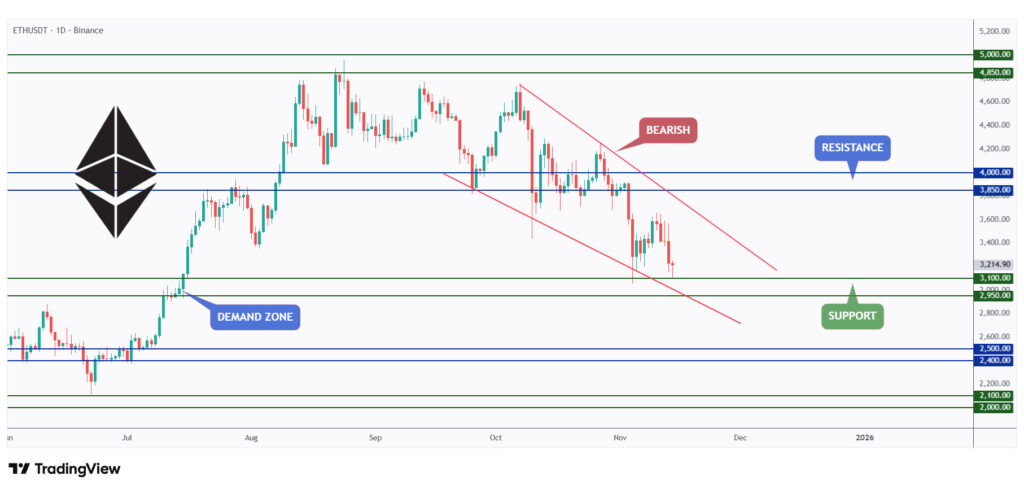
As long as the $2,950–$3,000 support zone holds, we will be looking for longs targeting the upper bound of the wedge.
Quote of the week
Hope is a bogus emotion that only costs you money.
~ Jim Cramer
Closing Remarks
In summary, the market remains under pressure, with most assets showing weakness on the 7-day heatmap.
BTC is still in a broader bullish structure despite its ongoing correction, and its $90,000 support zone will determine the next move.
ETH is also testing a critical support area within its falling wedge, with the $2,950 – $3,000 zone acting as a key catalyst. As long as these major supports hold, both BTC and ETH may offer short-term long opportunities on lower timeframes.