elcome to another crypto market outlook for the 1st of May!
In today's market analysis, we will dive into the current state of the crypto market. BTC is breaking below the $60,000 support, while USDT.D is hovering near the 5.45% resistance.
Furthermore, we will cover five altcoins (INJ, RNDR, ARB, DUSK, OCEAN), highlighting their key levels and potential trading setups.
Are you ready?
Today, we will cover the following topics:
- USDT.D and BTC Analysis
- 5 Altcoins Analysis
- Quotes / Advices
- Closing Remarks
USDT.D and BTC analysis
As usual, I always start my analysis with USDT.D as it serves as an indicator of traders' sentiment. USDT.D reflects whether traders are optimistic (investing in cryptocurrencies) or pessimistic (shifting towards stablecoins).
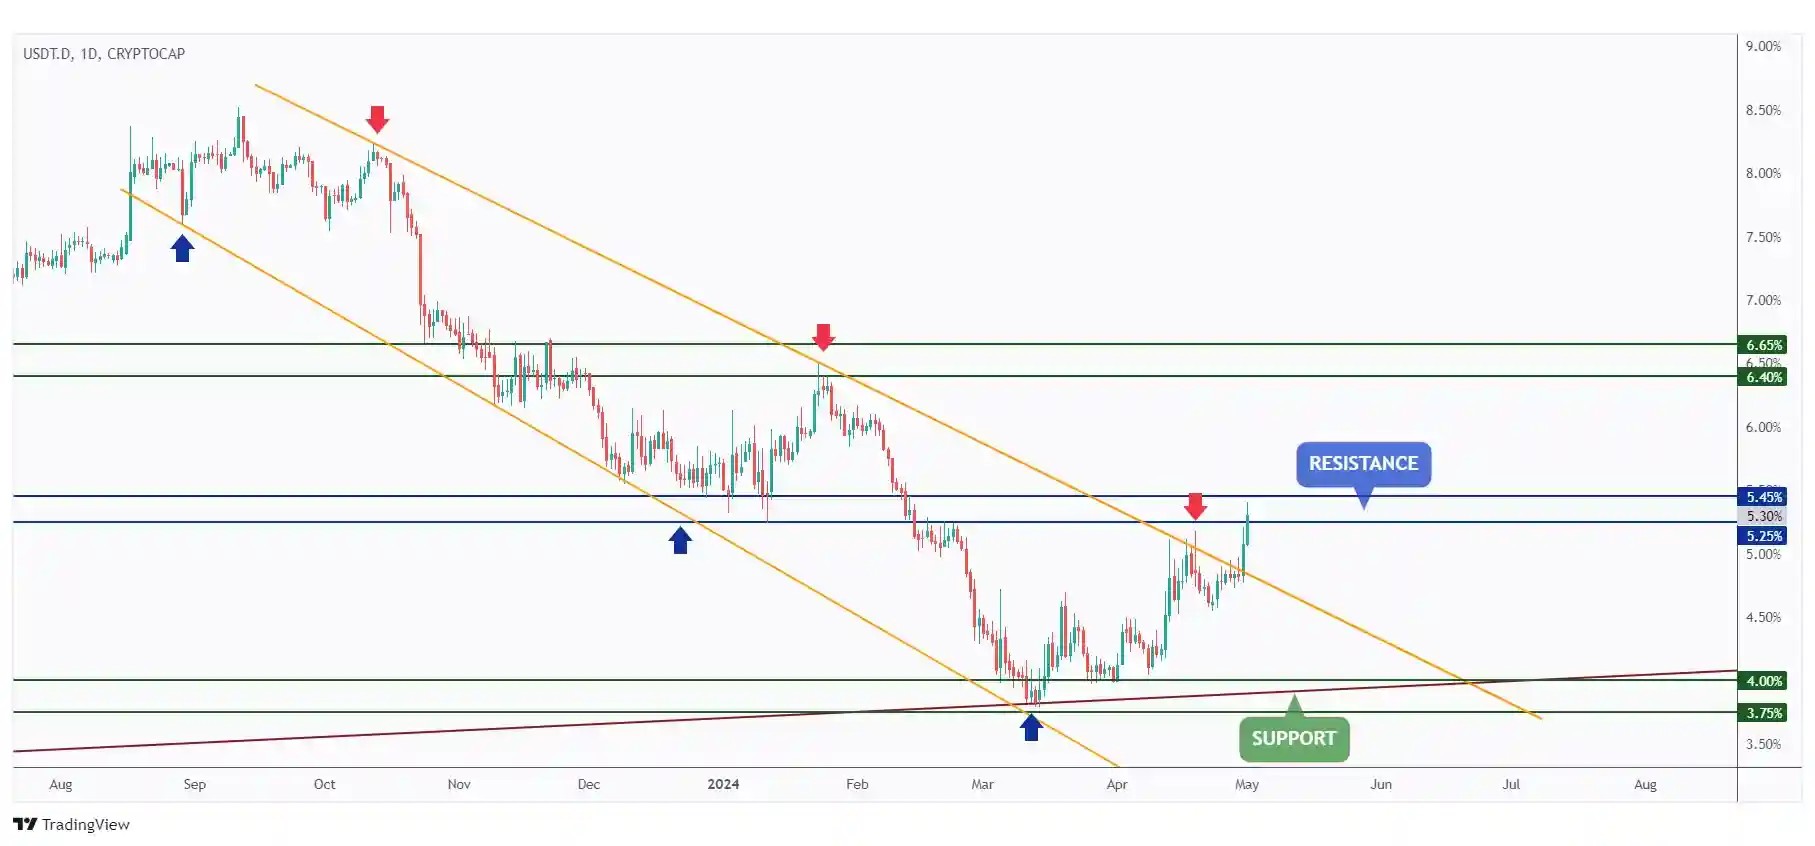
USDT.D has maintained an overall bullish trend for the past few weeks, employing bearish pressure on the crypto market.
However, it is currently hovering around a strong resistance zone.
As long as the 5.45% resistance level remains intact, there's potential for bearish momentum.
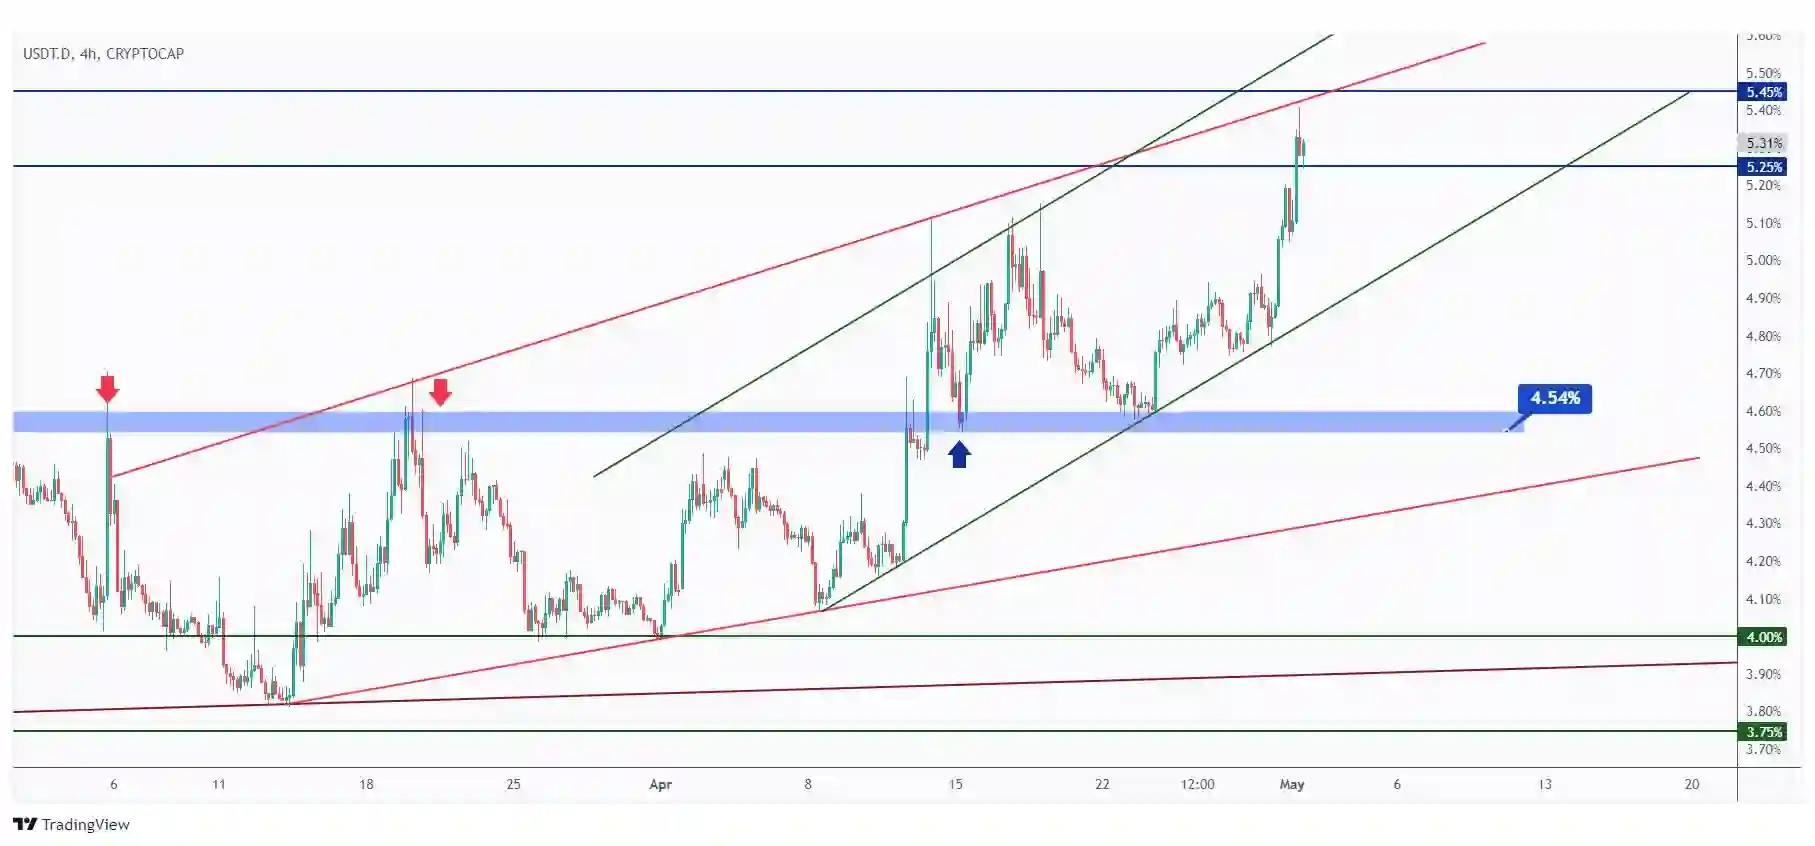
In the 4-hour timeframe, USDT.D is nearing a major resistance level where the 5.45% resistance intersects with two trendlines in blue and green.
Therefore, we will be on the lookout for any bearish reversal patterns to confirm the start of a bearish correction phase, which could have a positive impact on the crypto market.
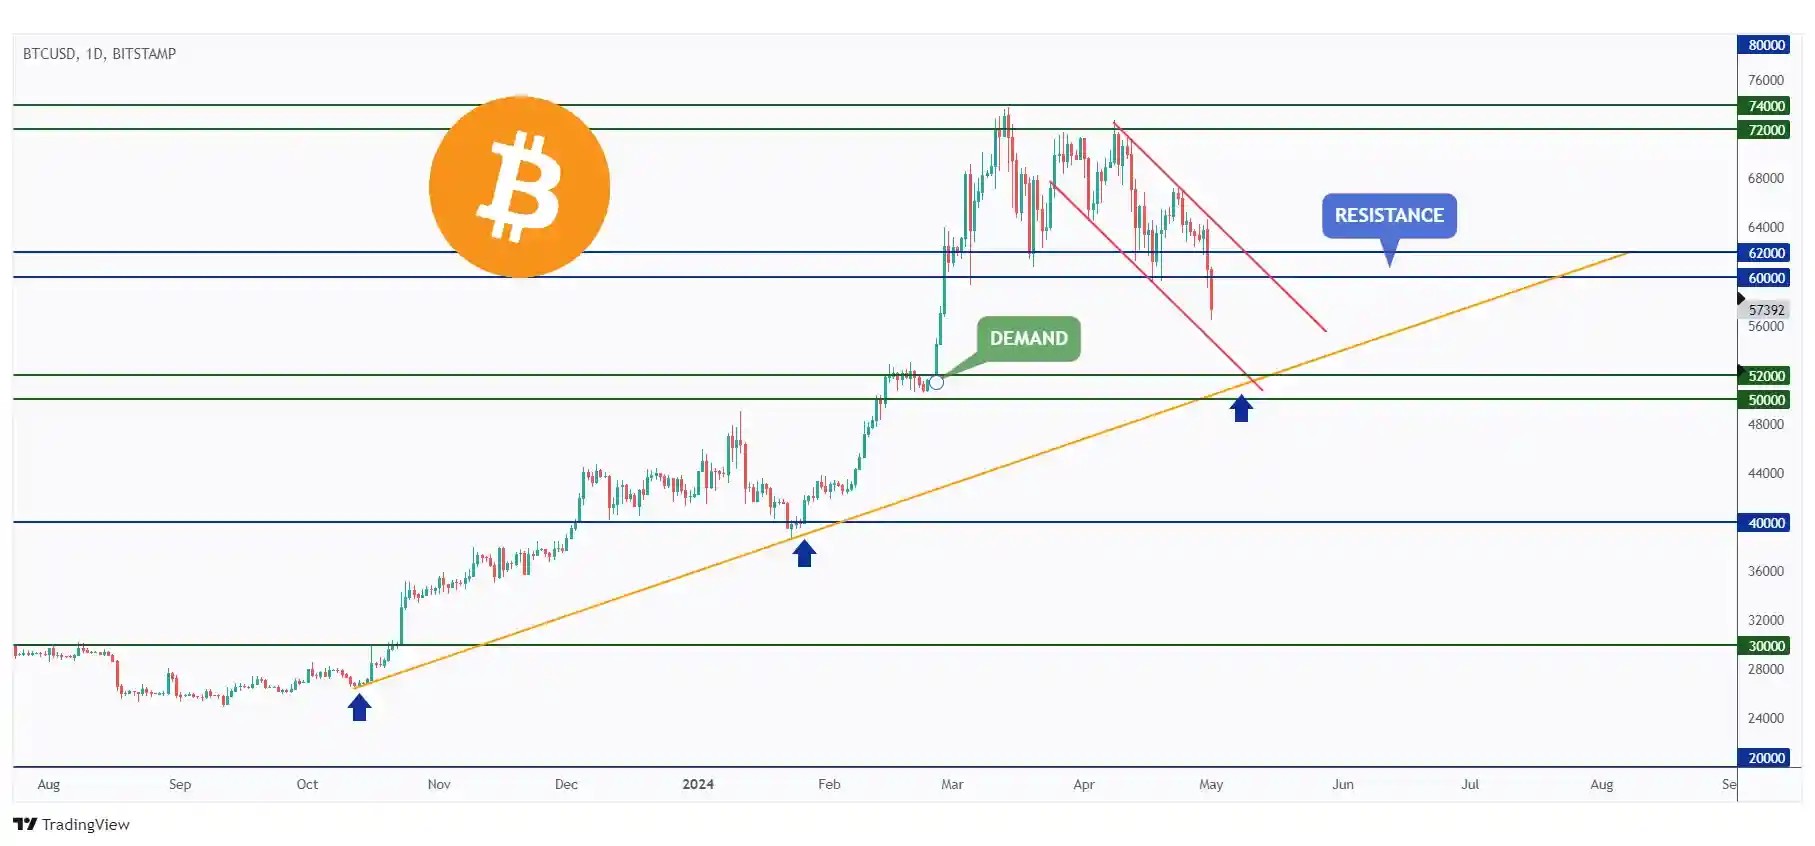
BTC has broken below the $60,000 support level, signaling a shift in momentum from bullish to bearish.
As long as the bears maintain control, we anticipate a continuation towards the $50,000 - $52,000 demand zone, which intersects with the lower red and orange trendlines.
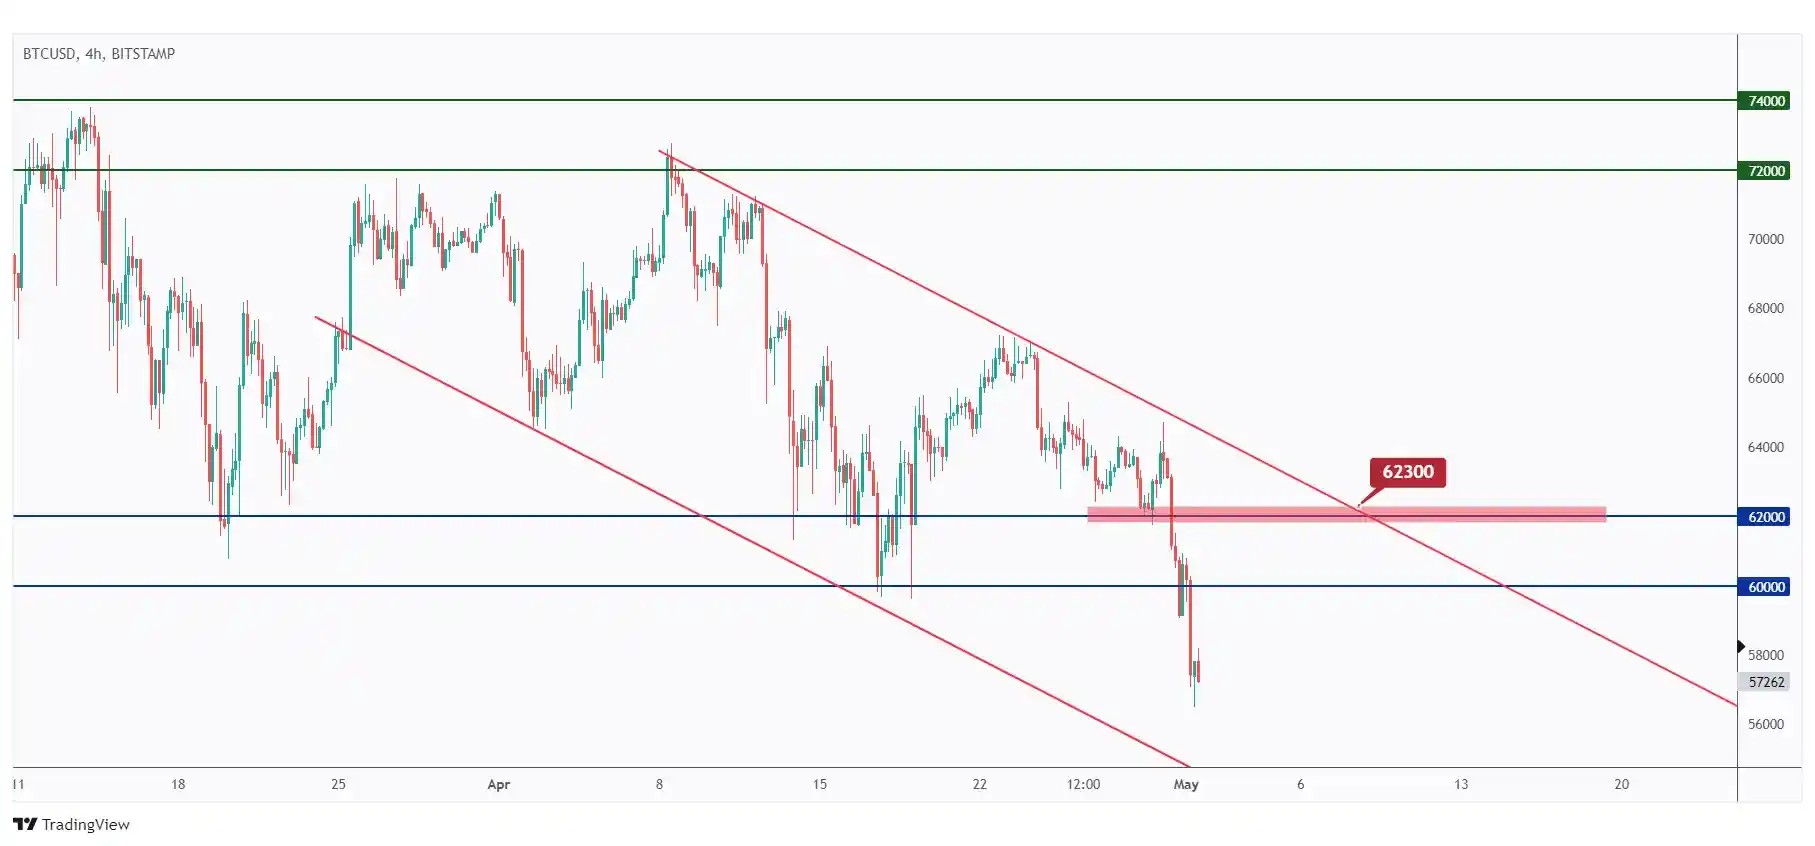
In parallel, for the bulls to regain control, a breakthrough above the upper red trendline and the last major high at $62,300 is needed.
Meanwhile, the bears are expected to maintain control, leading to further downward movement towards the lower red trendline.
5 Altcoins Analysis
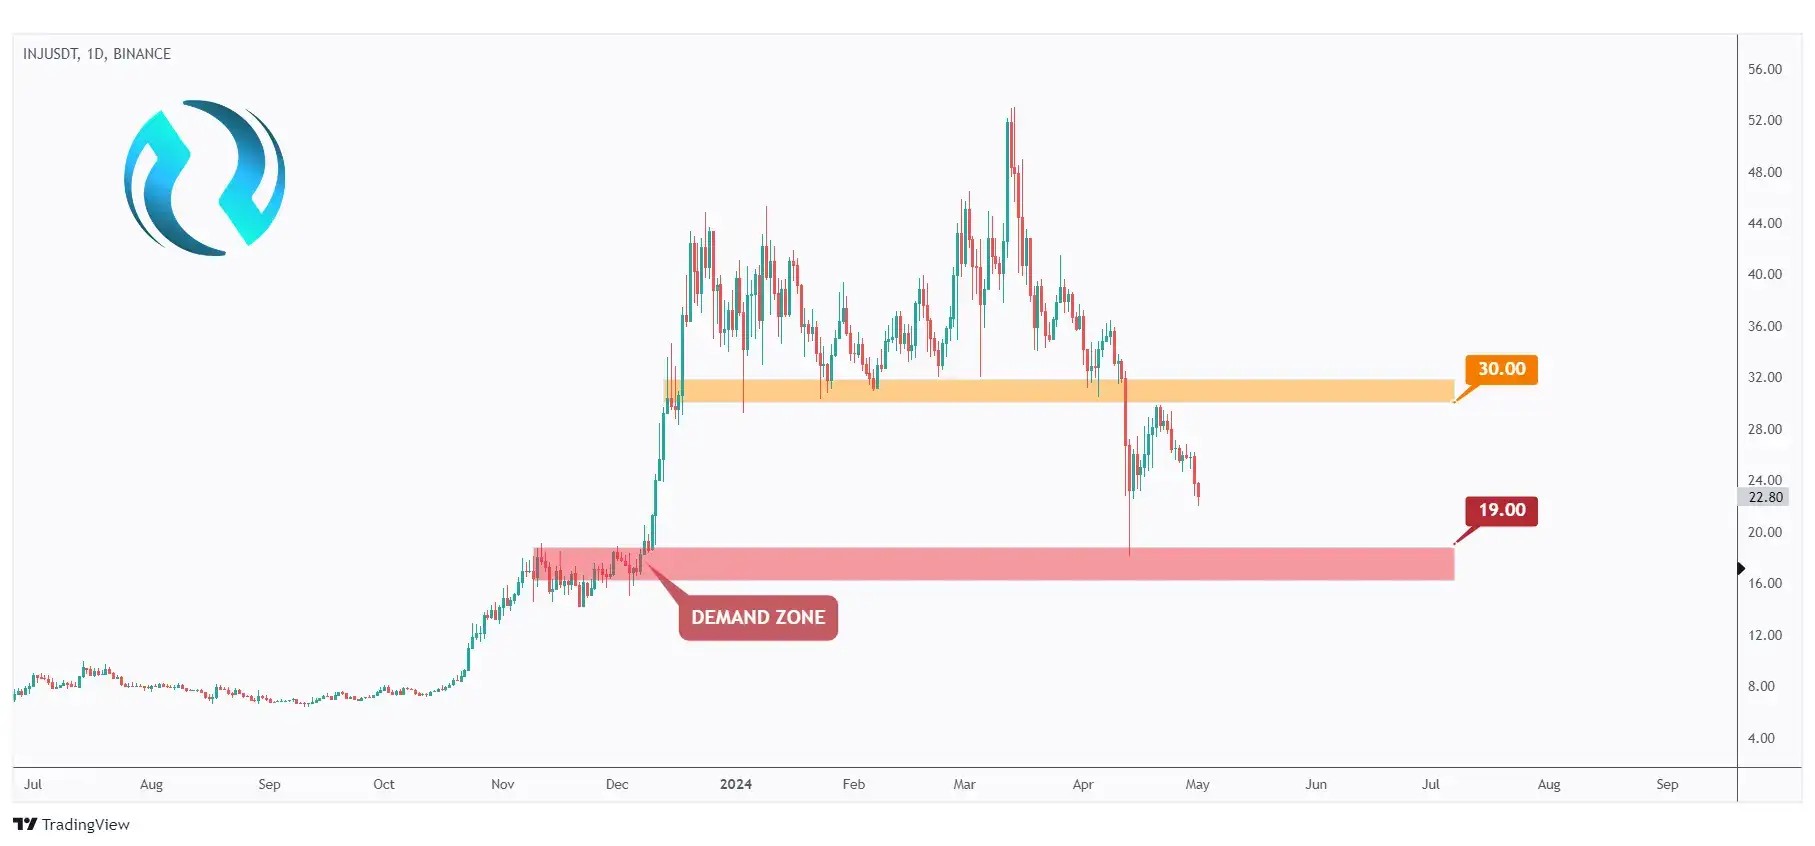
Let's start with INJ. After breaking below the $30 support level, INJ has been trading lower.
However, it is currently nearing a strong demand zone marked in red, so we will be looking for buy setups on lower timeframes.
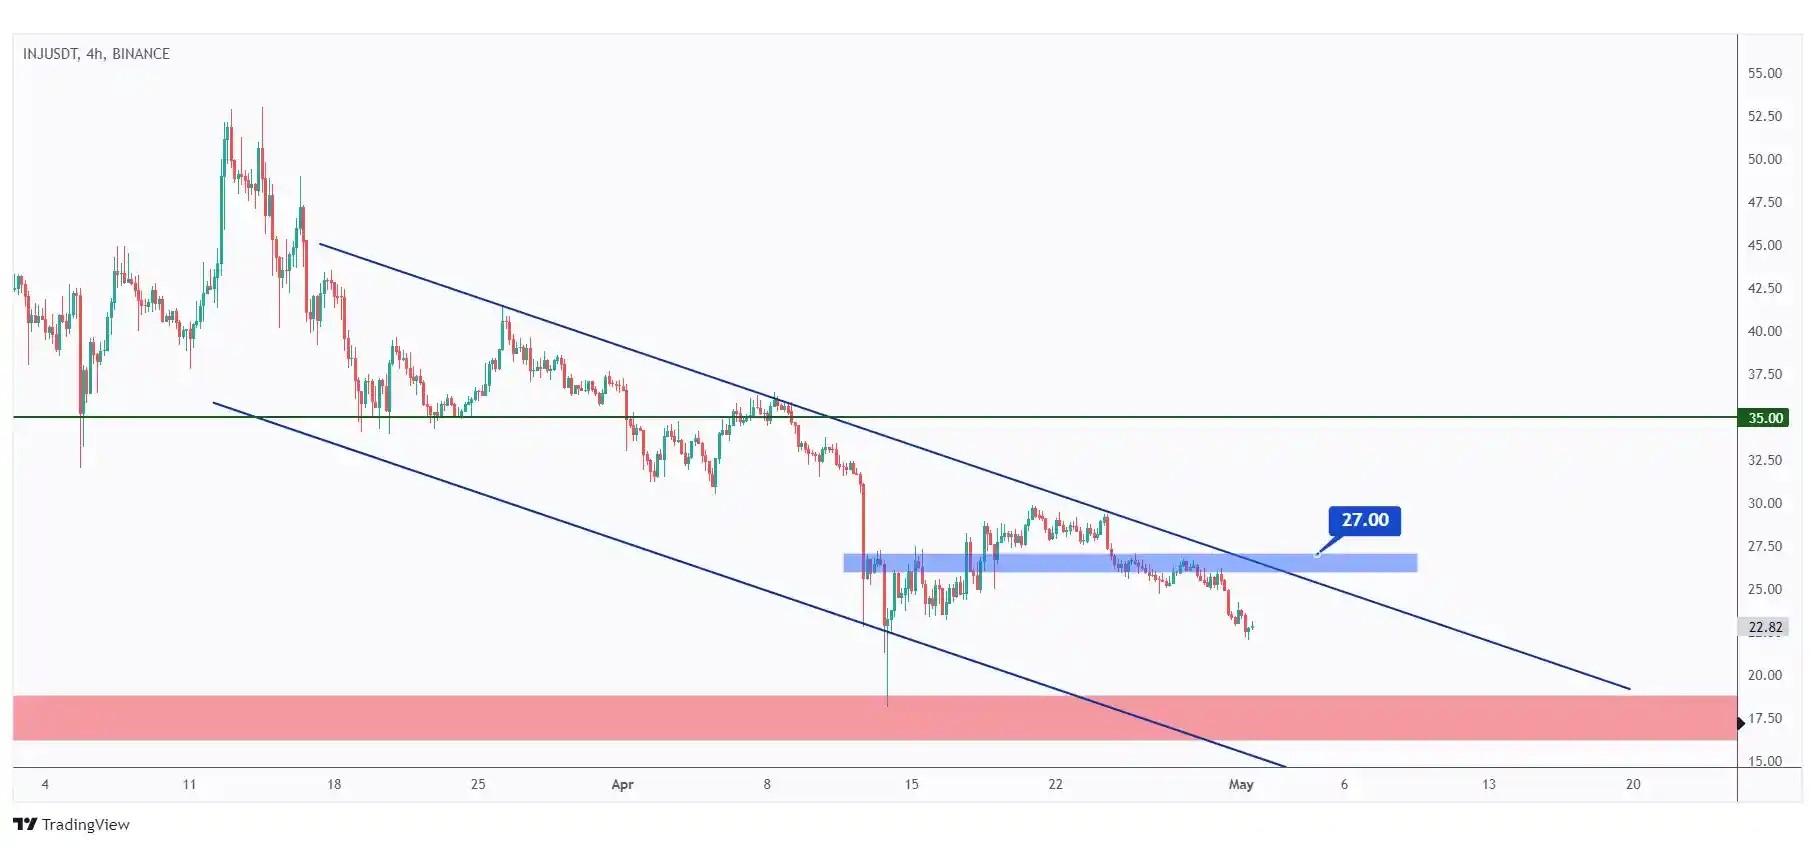
In the 4-hour timeframe, INJ has been bearish from a medium-term perspective, trading within the falling channel outlined in blue.
For the bulls to take over, a breakout above the last major high at $27, highlighted in blue, is required.
In such a scenario, a movement towards the $35 resistance level would be anticipated.
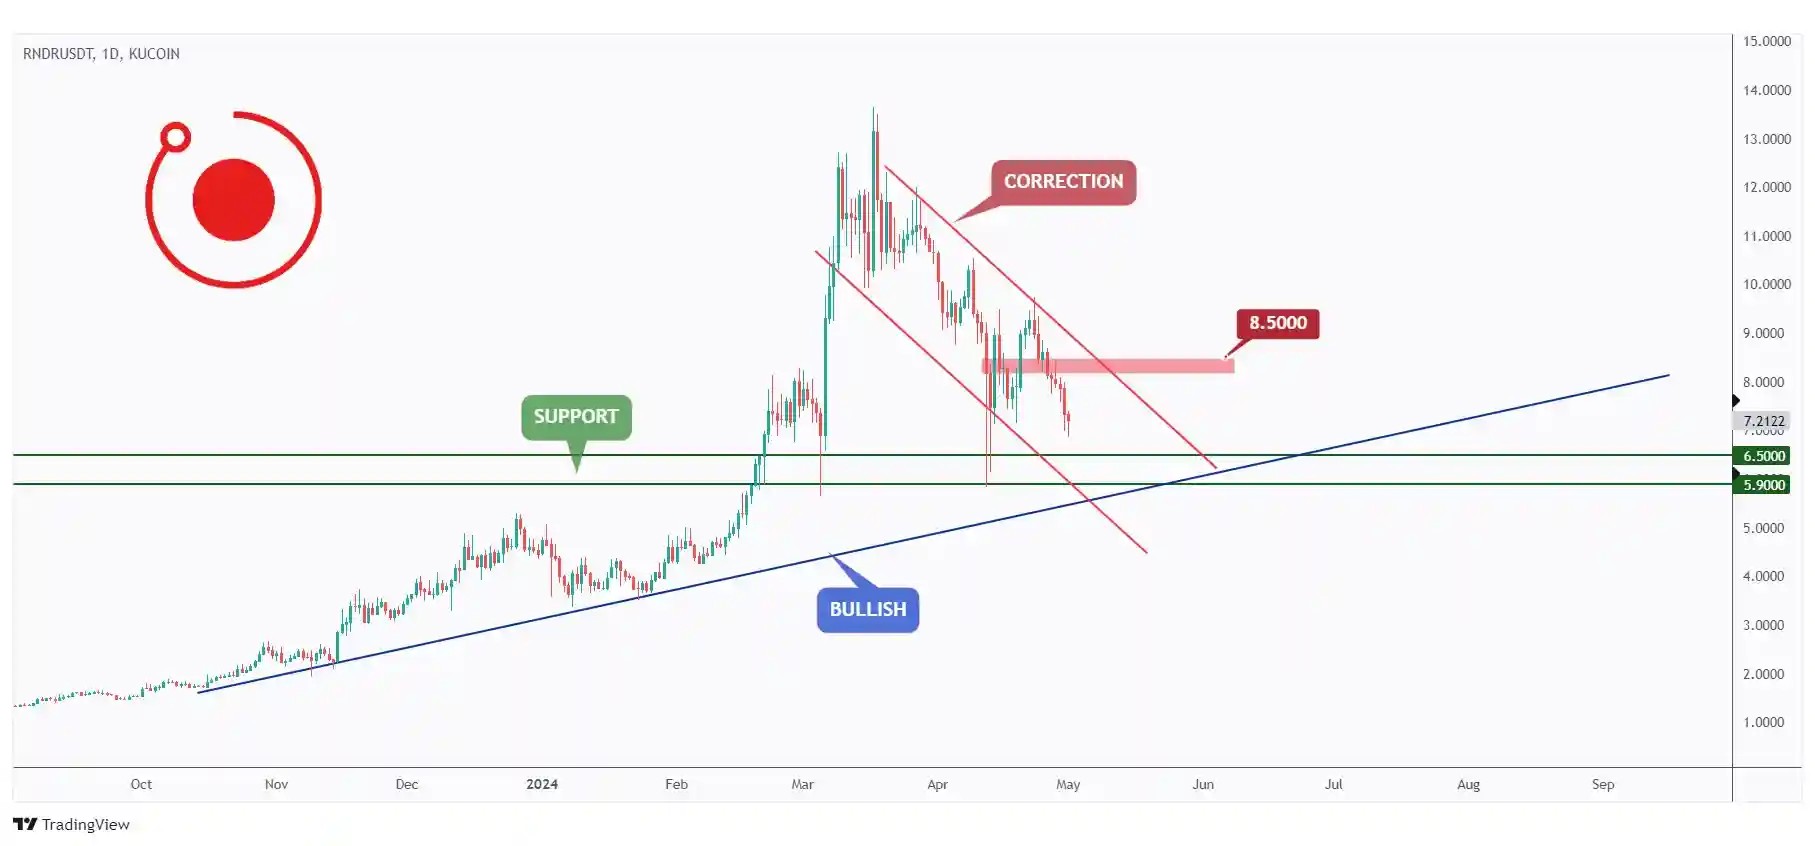
Turning our attention to RNDR. It has been overall bullish trading above the rising trendline outlined in blue.
Currently, RNDR is undergoing a corrective phase from a short-term perspective, trading within the descending channel highlighted in red.
For the bulls to take over, and start the next impulse movement upward, a break above the upper red trendline and last major high at $8.5 marked in red is needed.
Meanwhile, RNDR may still decline to test the $6 support level before resuming its upward trajectory.
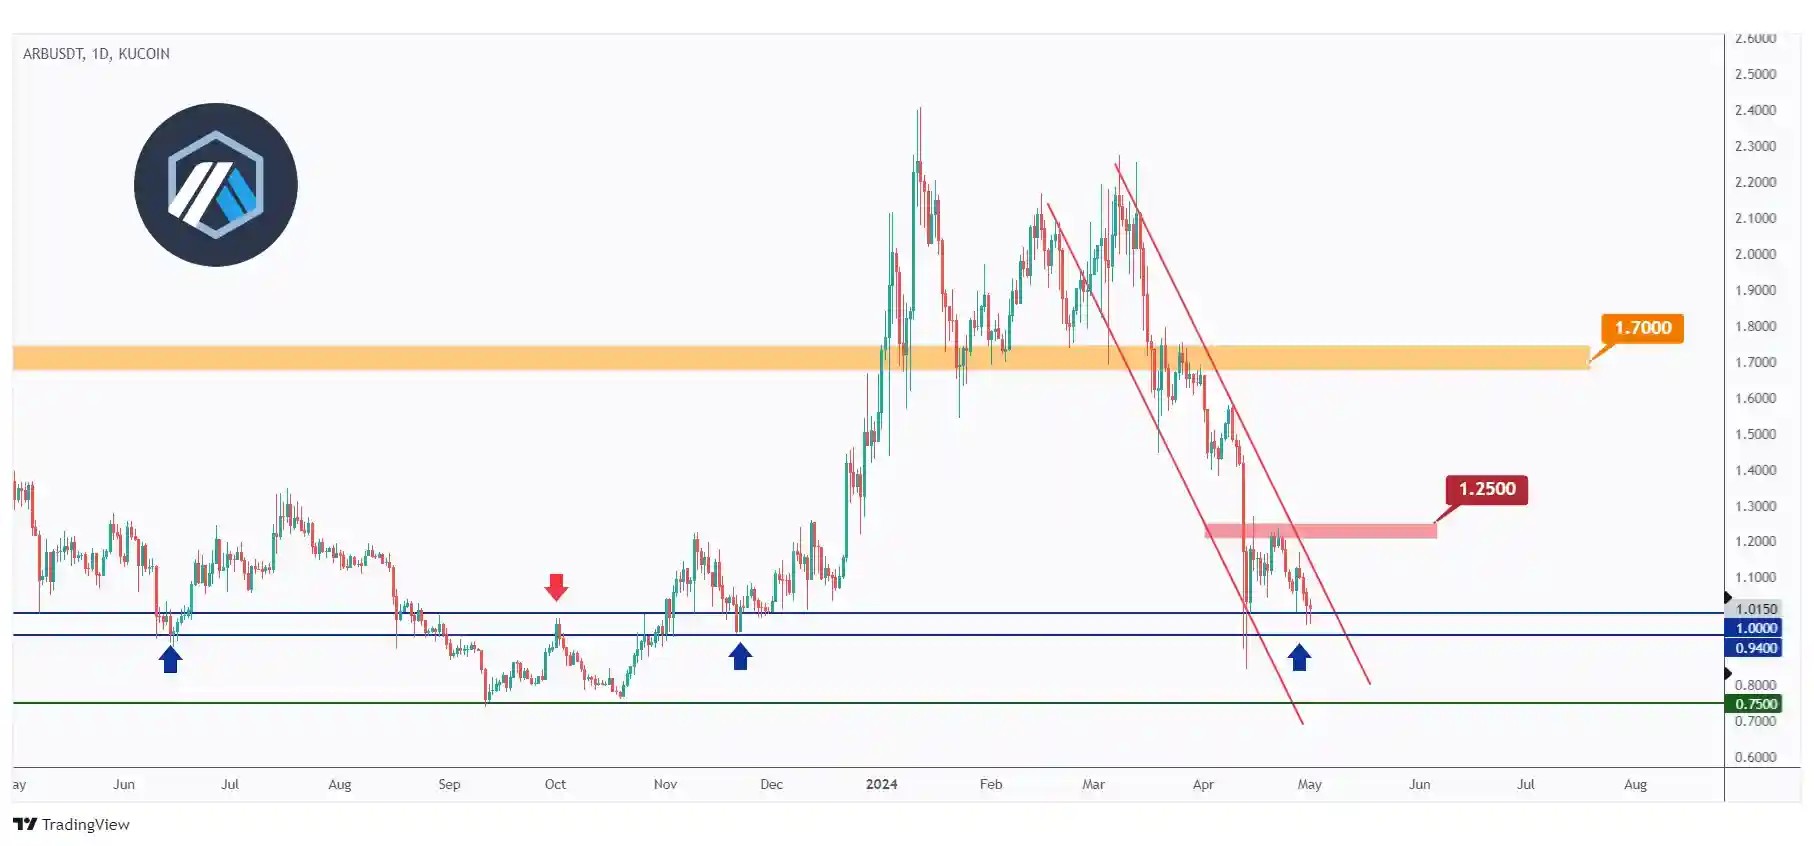
Next on the agenda is ARB. It has been bearish for a couple of months trading within the falling channel marked in red.
However, ARB is currently hovering around a strong support level and round number at $1. As long as the support holds, we will be looking for buy setups.
For the bulls to take control and initiate the next impulse movement aiming for $1.7, a breakout above the last major high marked in red at $1.25 is needed.
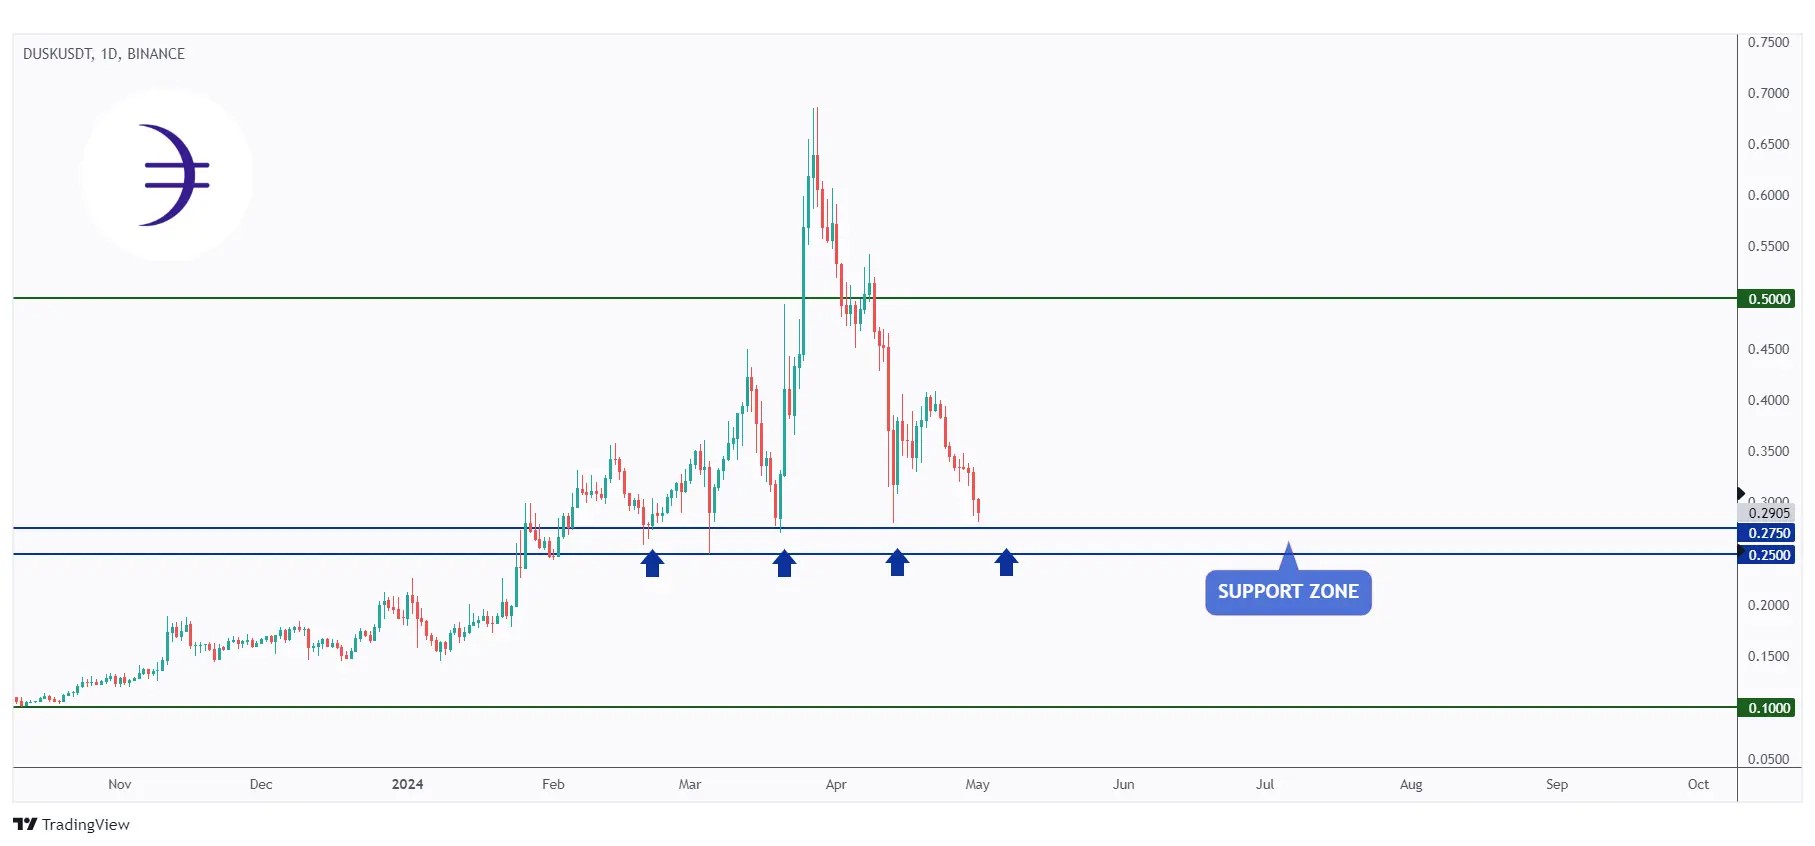
Analyzing DUSK, it has been overall bearish, particularly following its break below the $0.5 mark.
This week, DUSK is nearing a major support zone between $0.25 and $0.275. Thus, we will be looking for buy setups as long as this support holds.
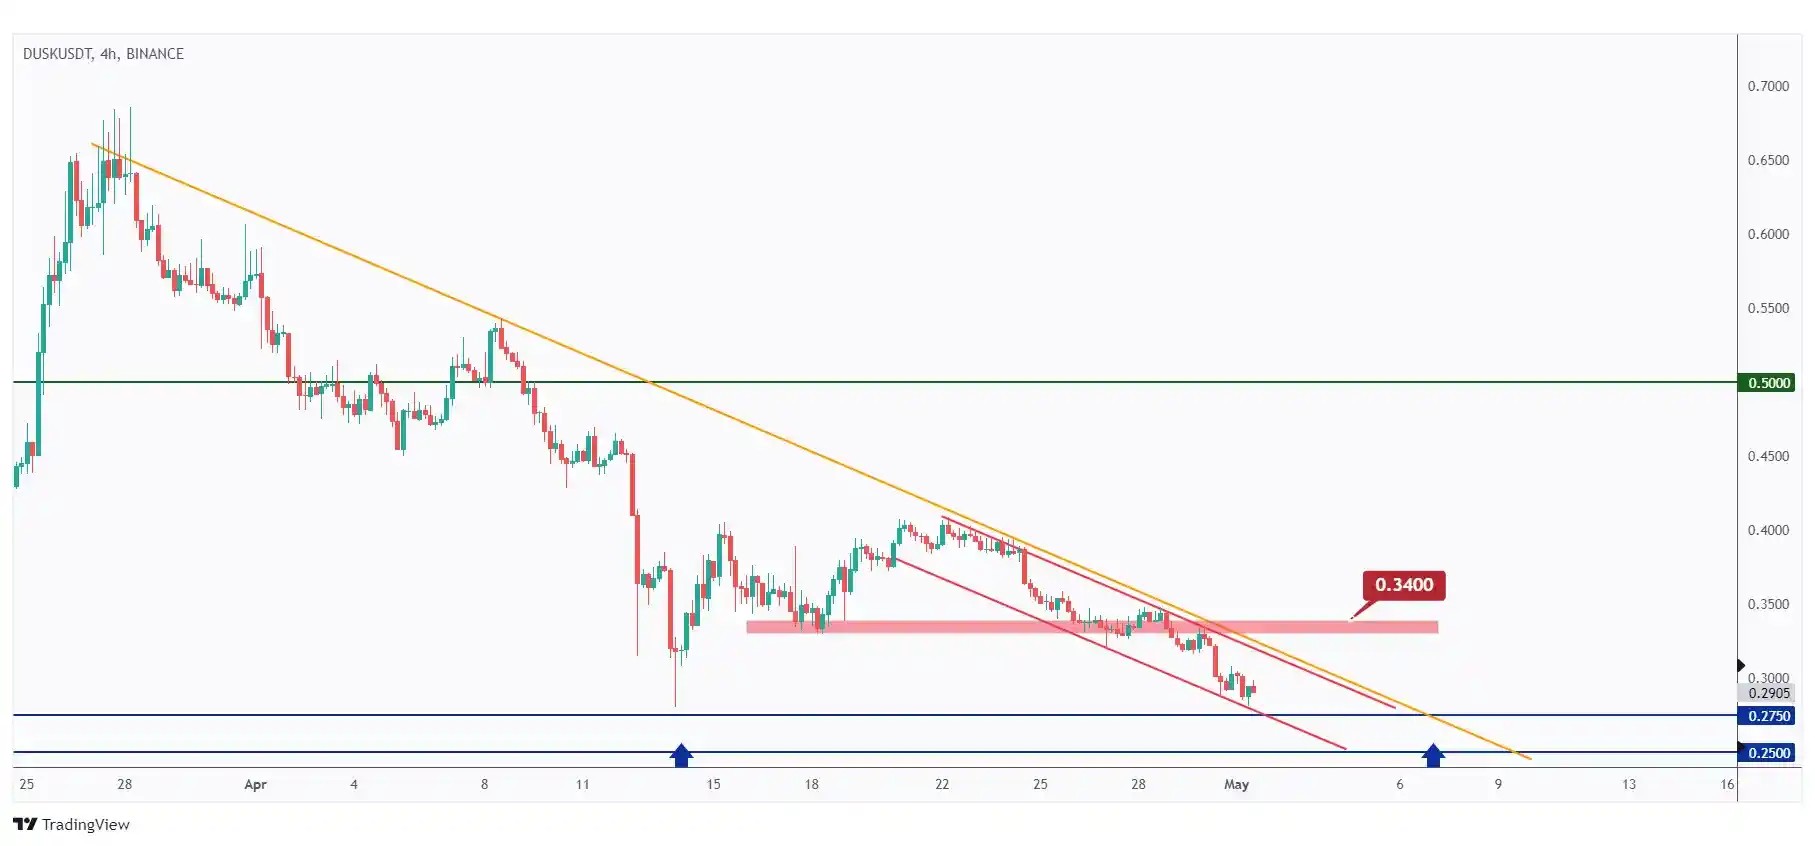
In the 4-hour timeframe, DUSK has been bearish from a medium-term perspective, trading within the falling channel marked in red.
For the bulls to take control, a breakout above the last major high marked in red at $0.34 is needed.
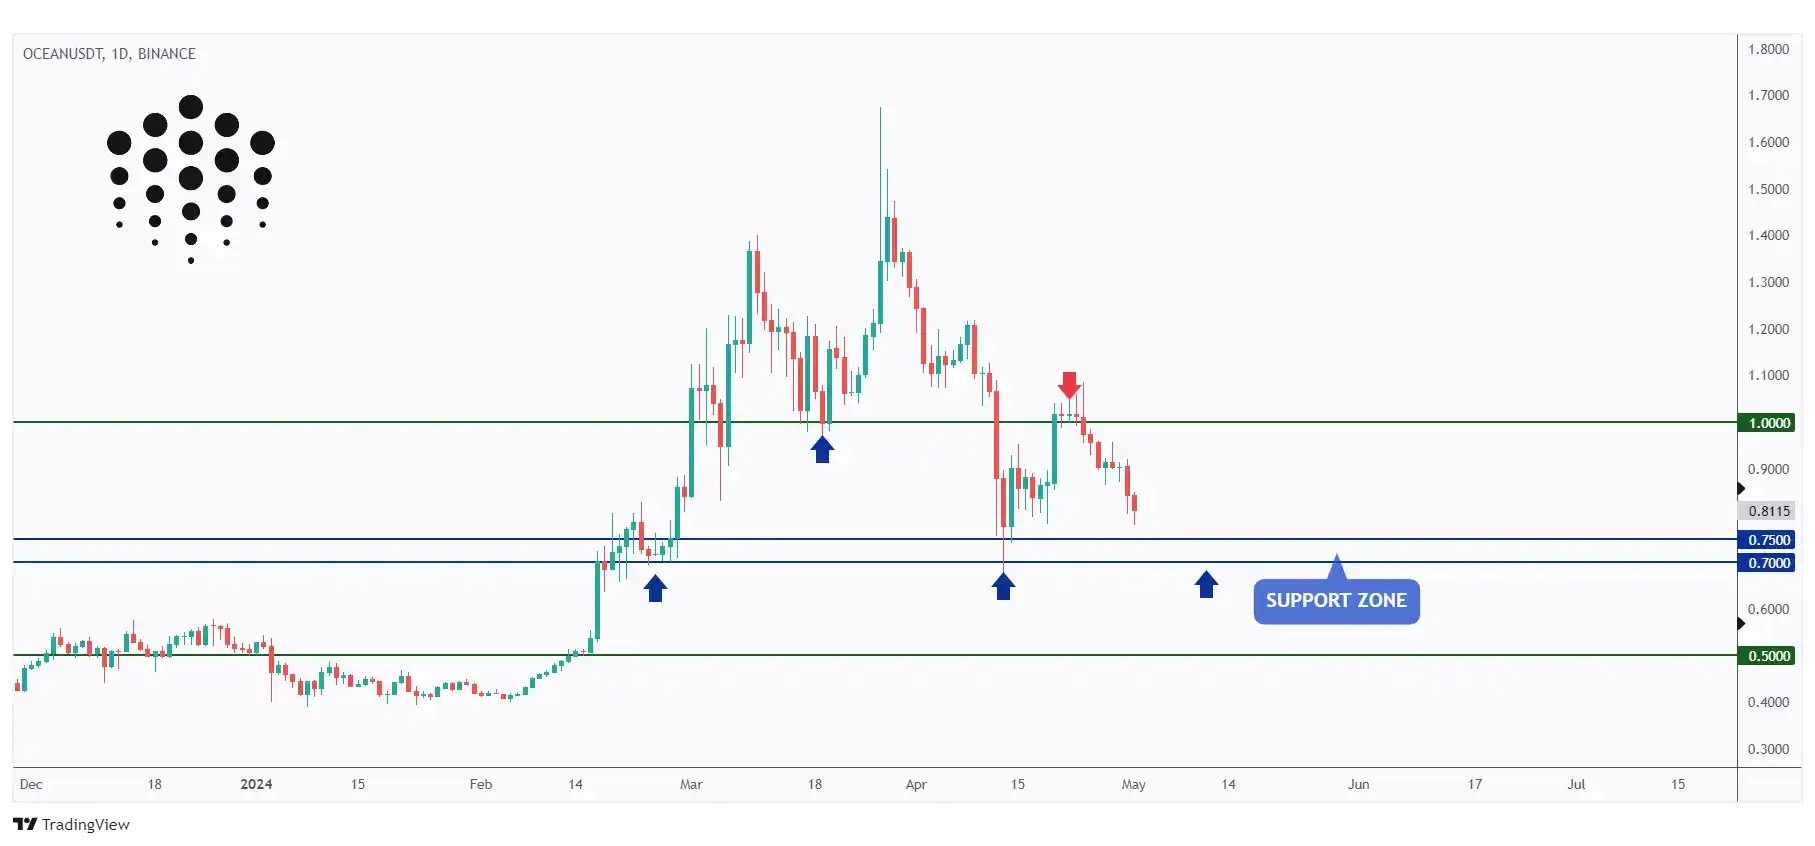
OCEAN has been hovering within a big range, bounded by the $0.7 support and $1 resistance levels.
Currently, it is testing the lower bound of the range, prompting us to search for buy setups on lower timeframes.
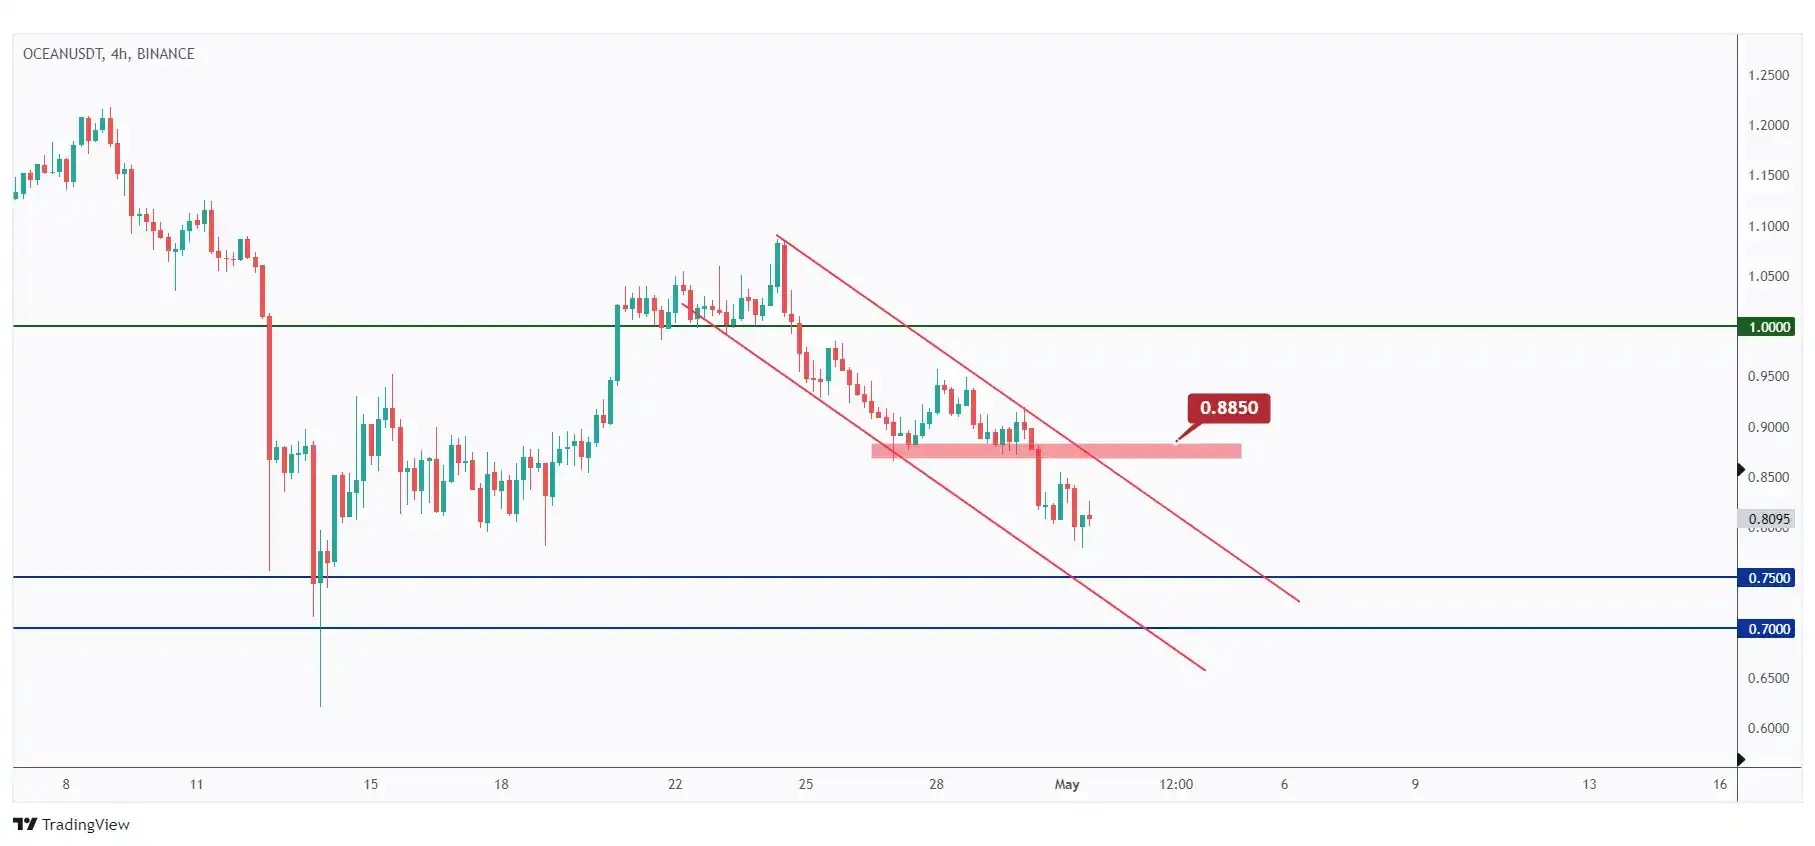
In the 4-hour timeframe, OCEAN has been bearish, trading within a falling channel marked in red.
For the bulls to take control and initiate the next upward impulse movement, a breakout above the last major high marked in red at $0.885 is required.
In such a scenario a movement towards the $1 round number would be anticipated.
Quotes / Advices
In crypto trading, fear and greed are your worst enemies. Master your emotions, and you'll master the market.
The trend is your friend until it bends. In crypto, ride the trend, but always be prepared for a reversal.
And most importantly, it's not about being right, it's about being profitable. Cut your losses quickly and let your winners run.
Closing Remarks
In summary, USDT.D maintains a bullish trend but faces resistance at 5.45%, indicating potential bearish pressure.
BTC's shift below $60,000 signals a bearish momentum, targeting a demand zone at $50,000 - $52,000.
INJ trades near a strong demand zone marked in red, presenting potential buy setups on lower timeframes.
RNDR undergoes a corrective phase within a descending channel, with a breakout above $8.5 signaling upward momentum.
ARB hovers around a robust support at $1, anticipating bullish setups if the $1.25 resistance is breached.
DUSK approaches a significant support zone between $0.25 and $0.275, warranting buy considerations.
OCEAN tests the lower bound of its range at $0.7, with potential buy setups on lower timeframes if it breaks above $0.885 resistance.