
elcome to another crypto market outlook for the 31st of March!
In this edition, we'll delve into major assets such as US500, DXY, Gold, Bitcoin, and Ethereum, highlighting critical levels and potential trade setups.
From Bitcoin hovering around the $70,000 resistance, to Ethereum maintaining a narrow range, and the Fear & Greed Index signaling 'Greed' for an entire week, this article covers it all.
Are you ready?
Today, we will cover the following topics:
- Market Heatmap and Fear and Greed Index
- US500, DXY and Gold Analysis
- USDT.D, Bitcoin and Ethereum Analysis
- Quotes / Advices
- Closing Remarks
Market Heatmap and Fear and Greed Index
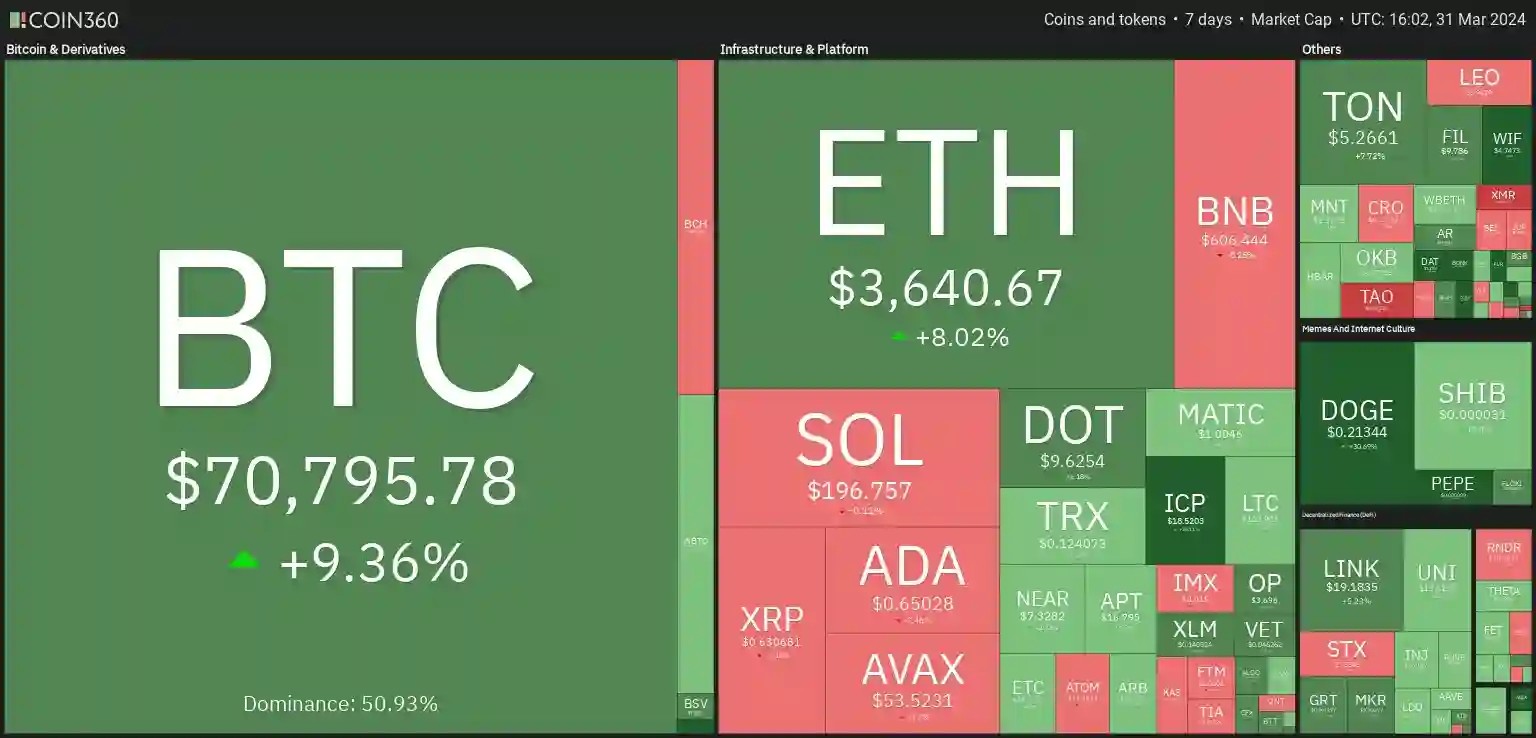
To initiate my research, I delved into the analysis by examining the market heatmap, which provided a comprehensive overview of the entire cryptocurrency market.
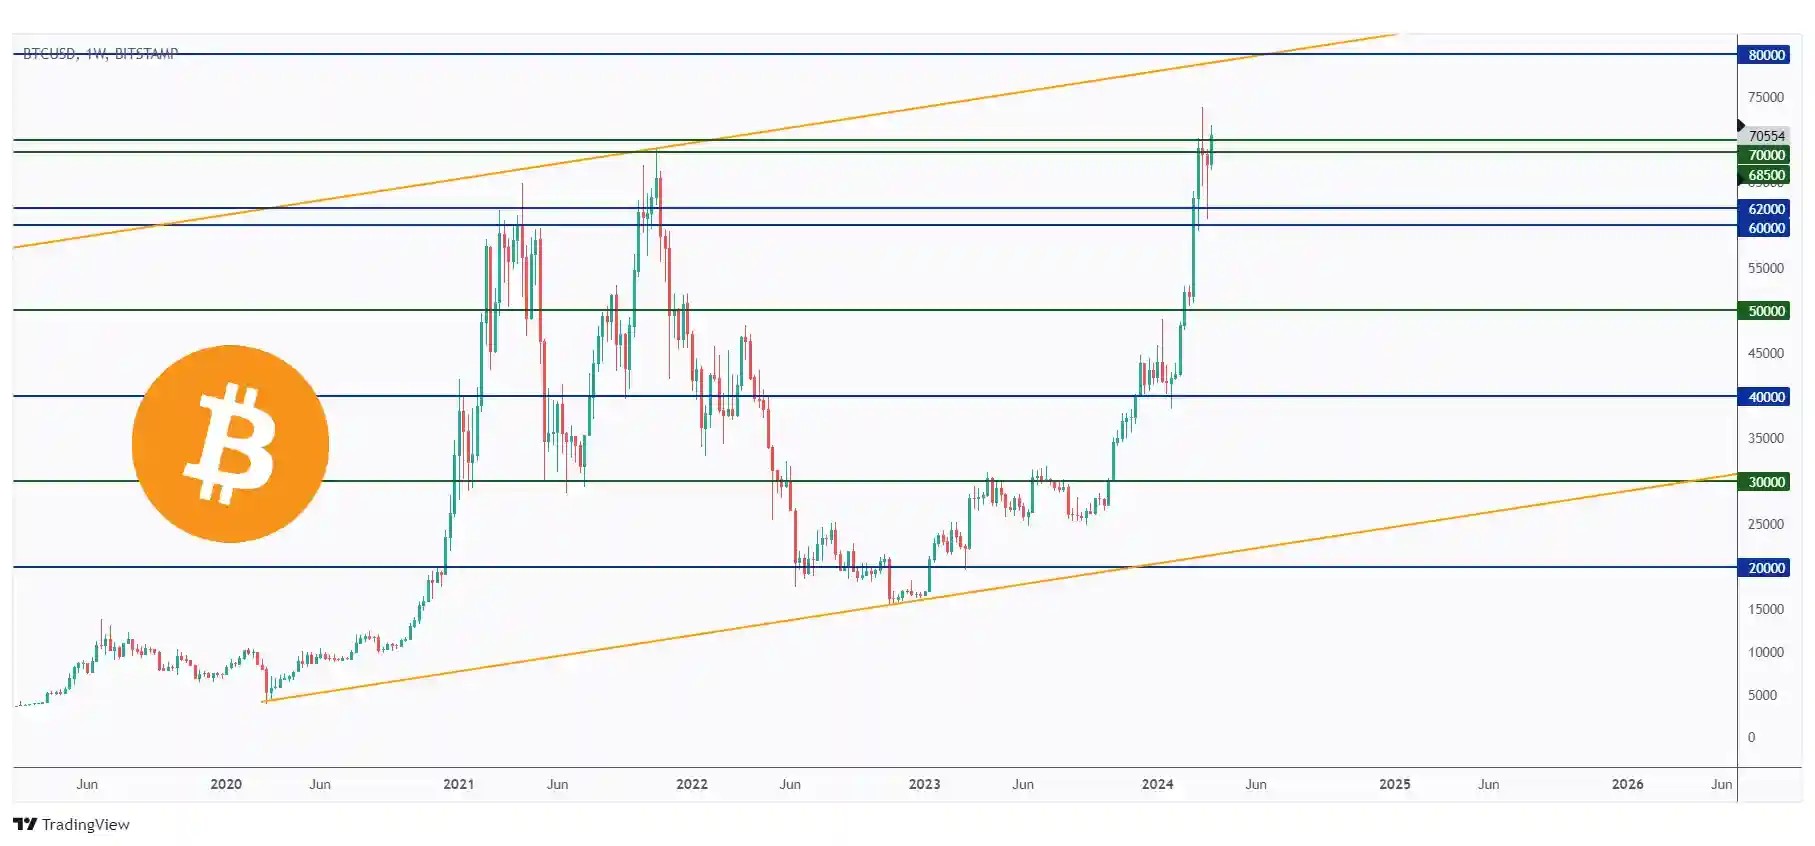
After rejecting the $70,000 resistance, BTC has been hovering within a narrow range between $68,500 and $71,600.
This ranging week got reflected on the entire crypto market, as we can see a mixture of bearish and bullish trends.
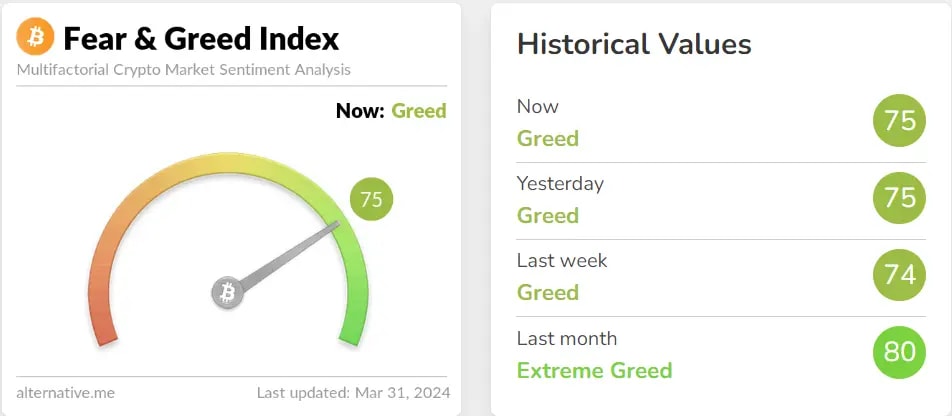
The Fear & Greed Index has dropped from "Extreme Greed" to “Greed”, indicating that traders are still optimistic but not with the same intensity as before.
This is quite normal after a massive surge.
US500, DXY and Gold analysis
We consistently monitor the US500 index to assess the current market sentiment. This practice is crucial because the cryptocurrency market often exhibits a significant correlation with the stock market, and this interconnection can impact its fluctuations.
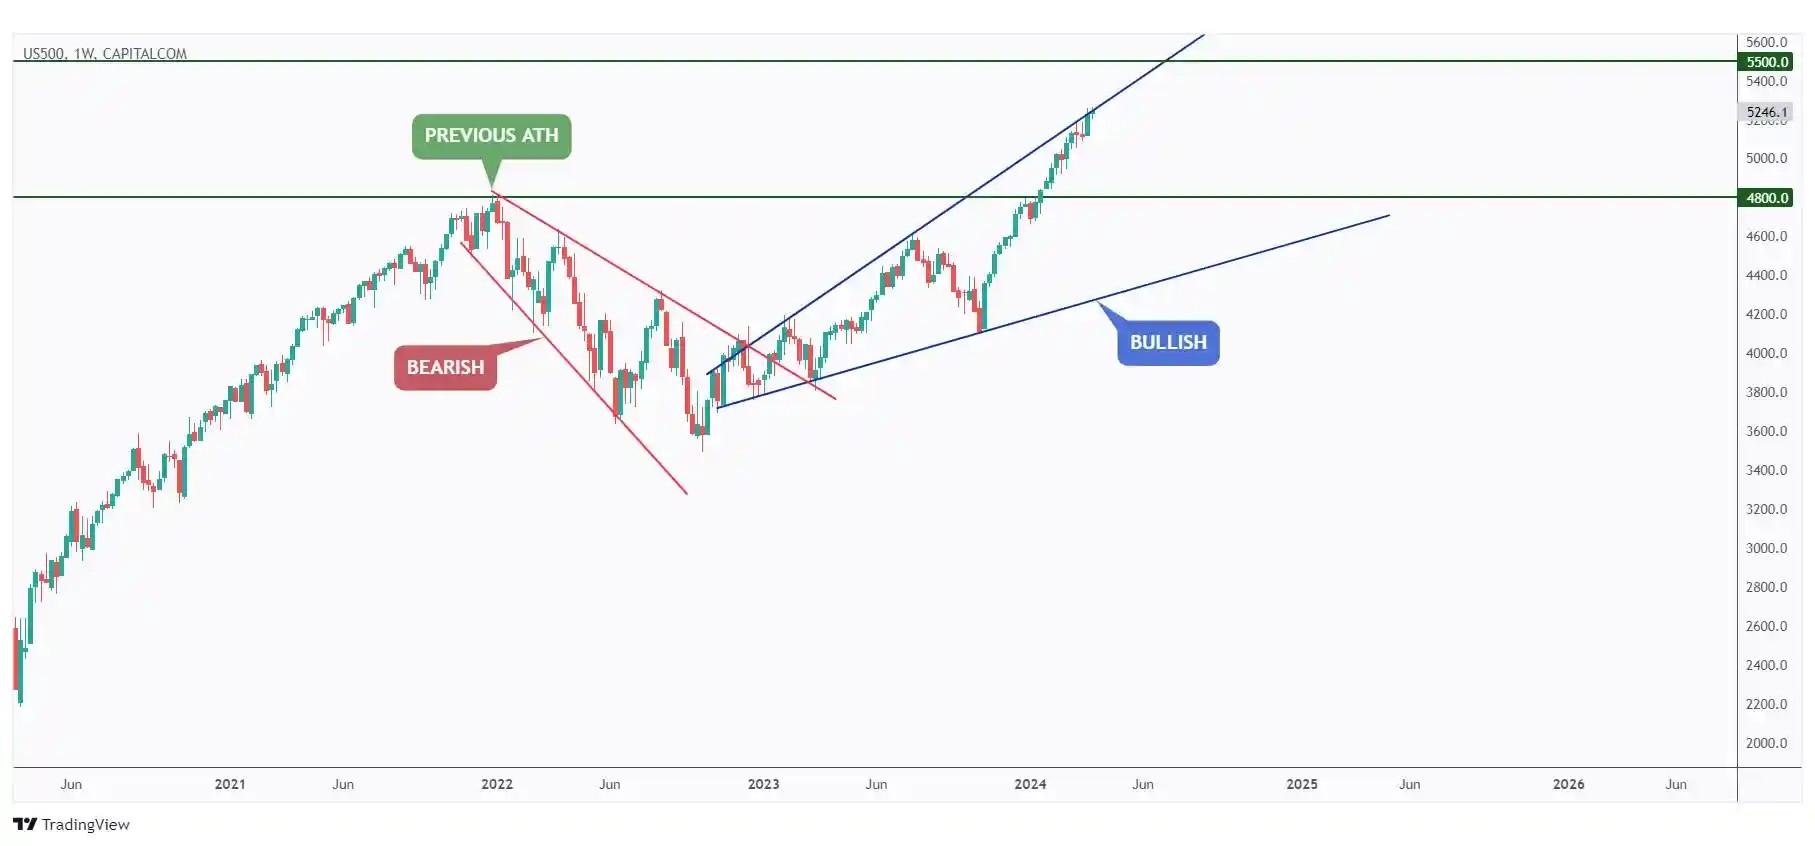
The US500 remains near the upper limit of the blue wedge pattern, indicating an overbought condition.
While the bulls maintain dominance, we expect a continuation towards the $5500 level.
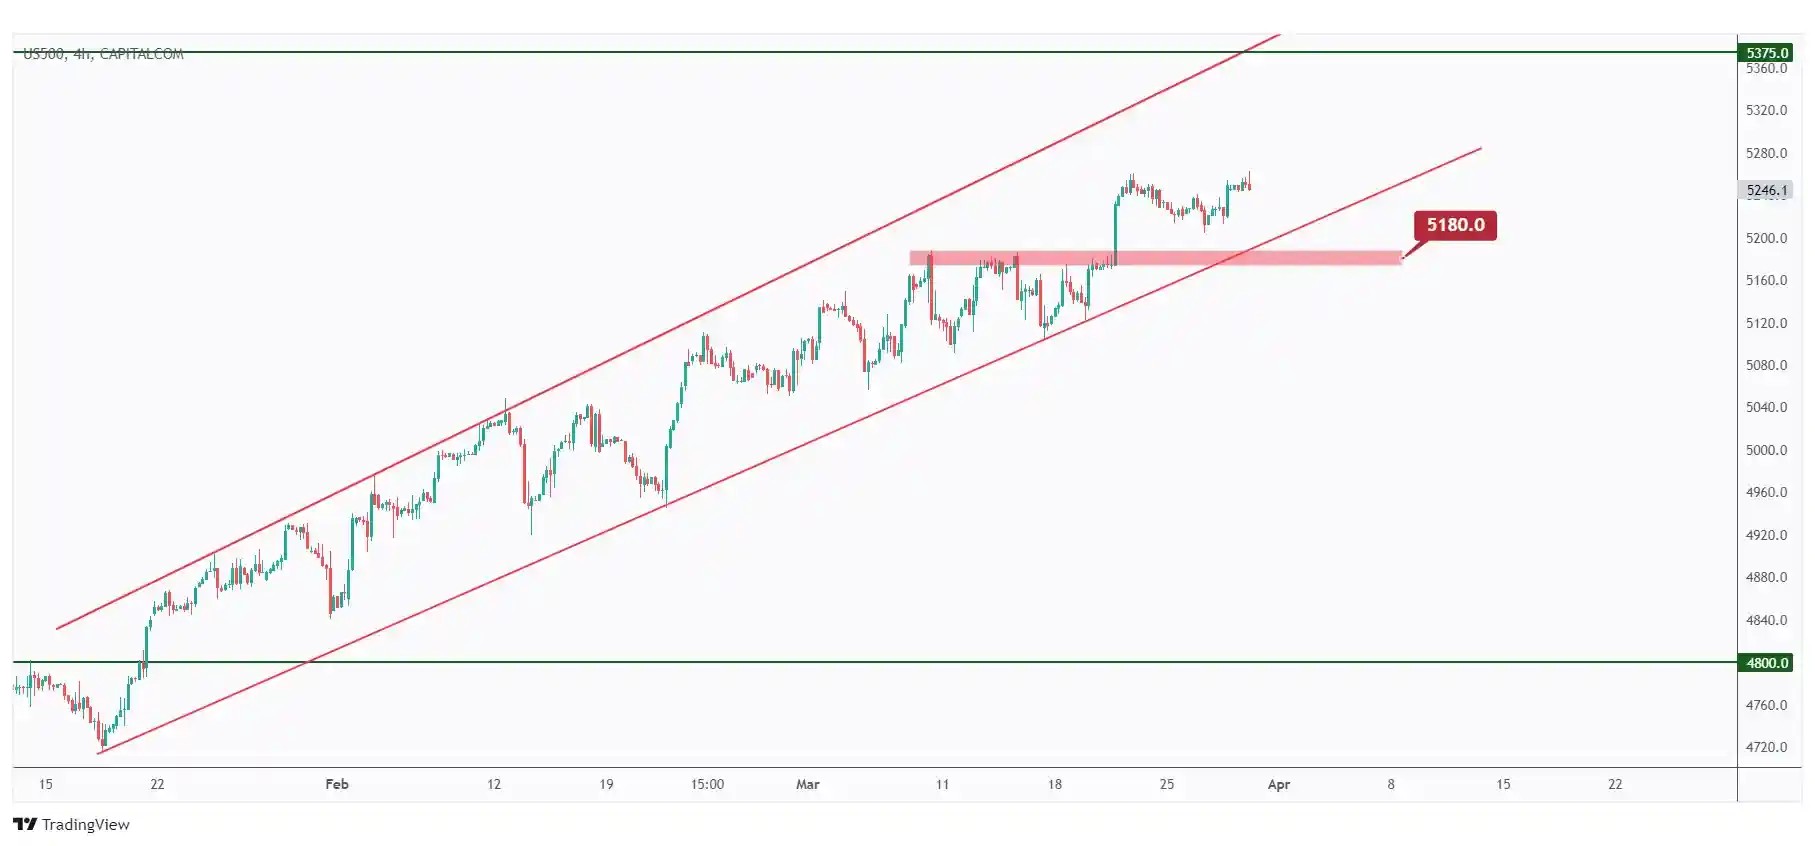
In the 4-hour timeframe, the US500 is still overall bullish, trading within the rising broadening wedge highlighted in red.
The bulls are expected to maintain control in the short term unless the last major low marked in red at $5180 is breached downward.
Meanwhile, we anticipate a continuation towards the upper red trendline and $5375.
We consistently monitor the DXY - USD Index as part of our routine analysis. This is crucial because the value of nearly all assets, including BTC/USD, is closely tied to the USD, which serves as the benchmark currency in the financial market.
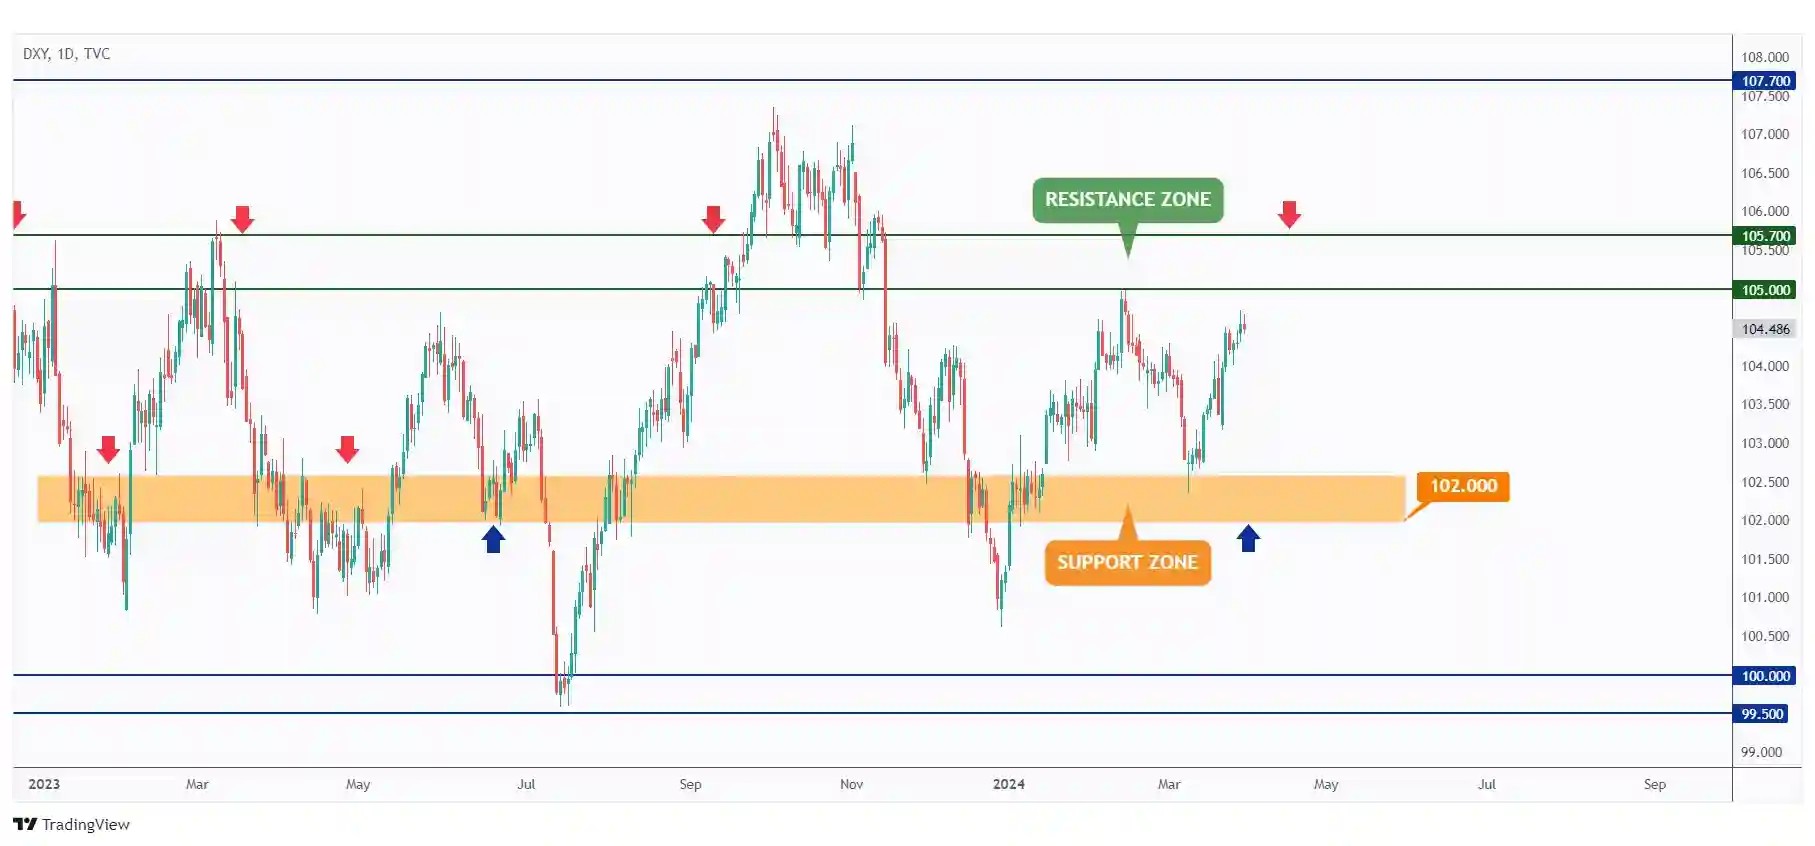
As per our previous analysis, DXY has remained bullish, and it is nearing the $105 resistance level, signaling a potential bearish reversal in the near future.
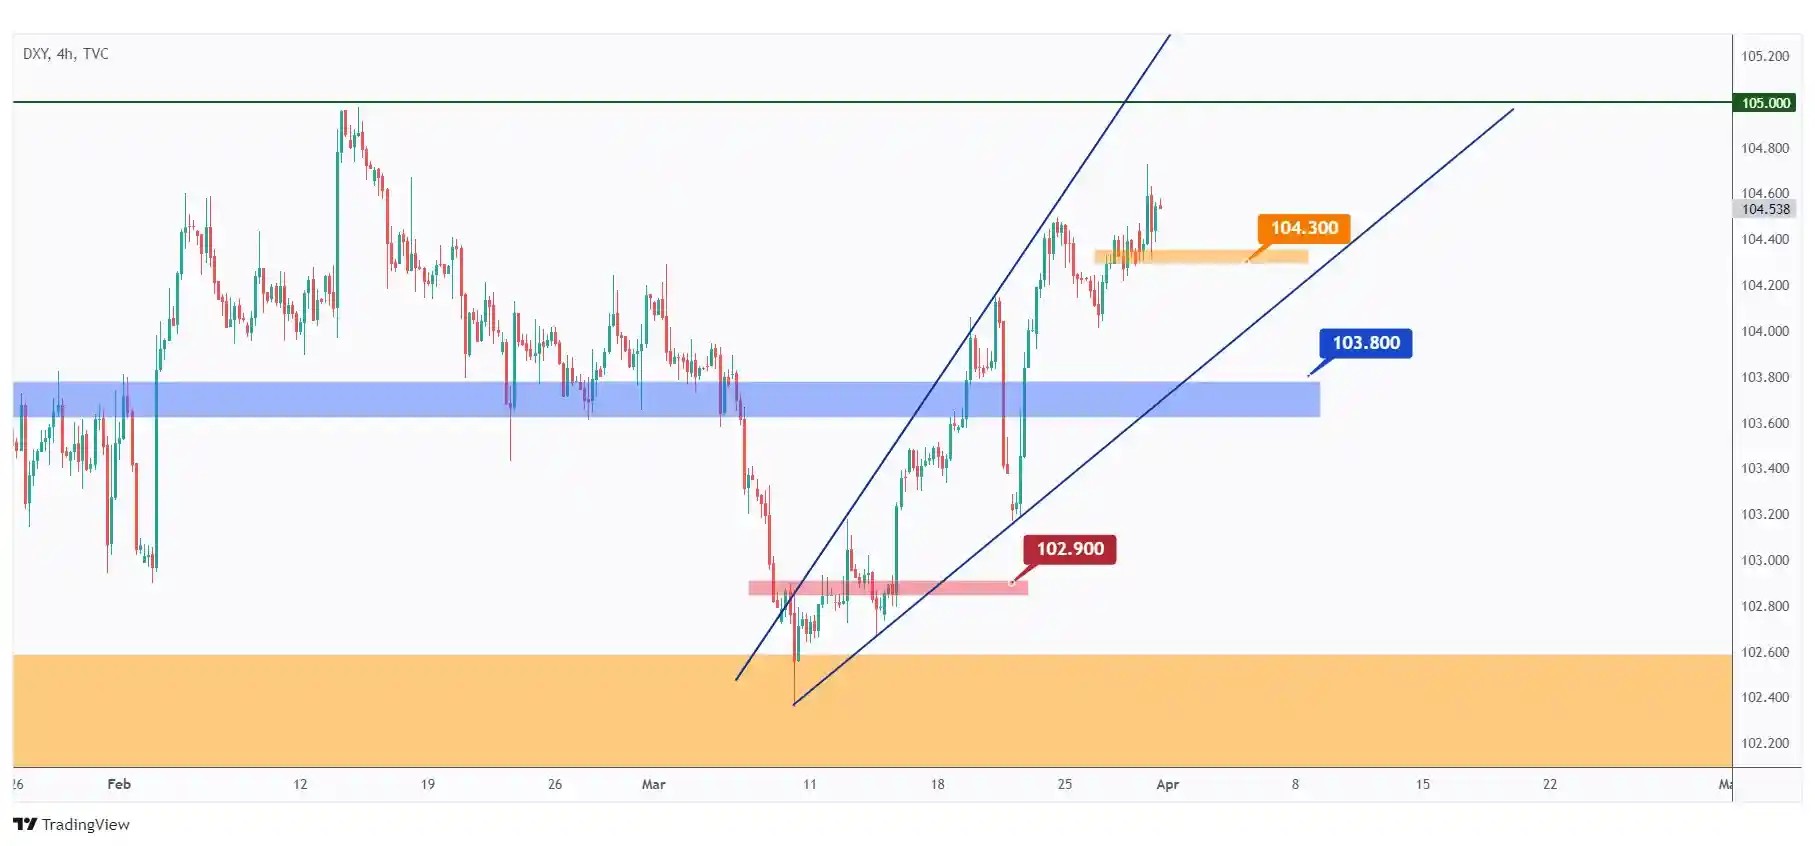
For the bears to take over and initiate the short-term correction phase towards the lower blue trendline, a break below the last low in orange at $104.3 is needed.
Meanwhile, DXY would remain bullish and could still trade higher to test the $105 resistance and upper blue trendline.
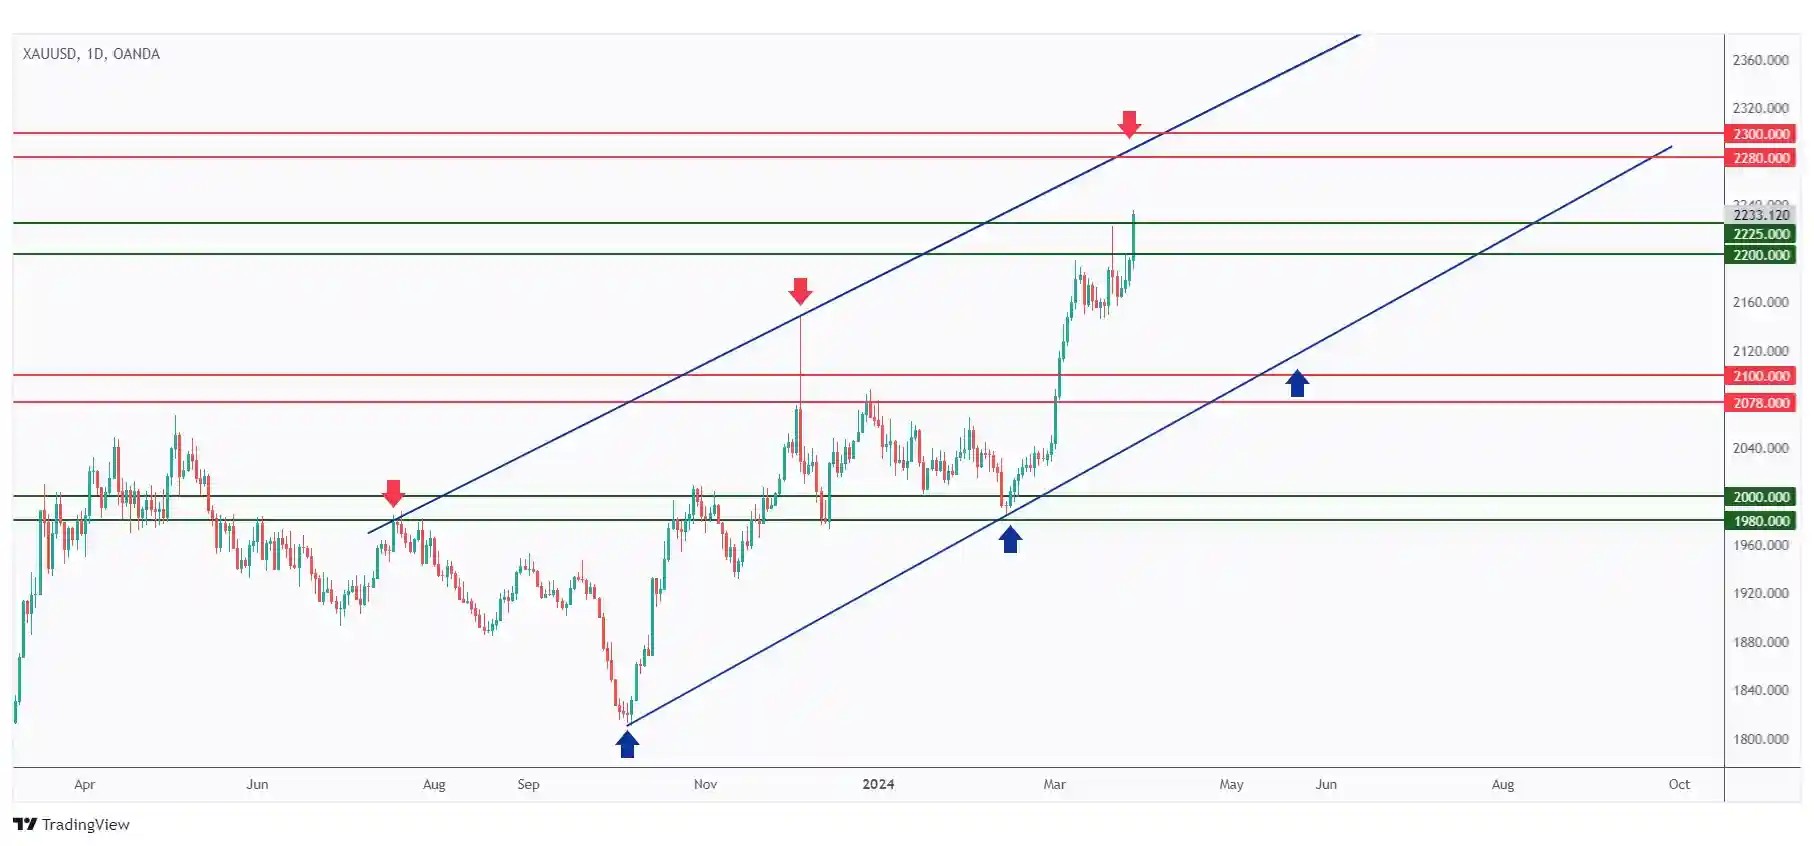
Gold remains overall bullish, trading within the rising channel outlined in blue.
Currently, Gold is breaking above the $2225 resistance, so we anticipate further upward movement towards the $2280 resistance and the upper bound of the channel.
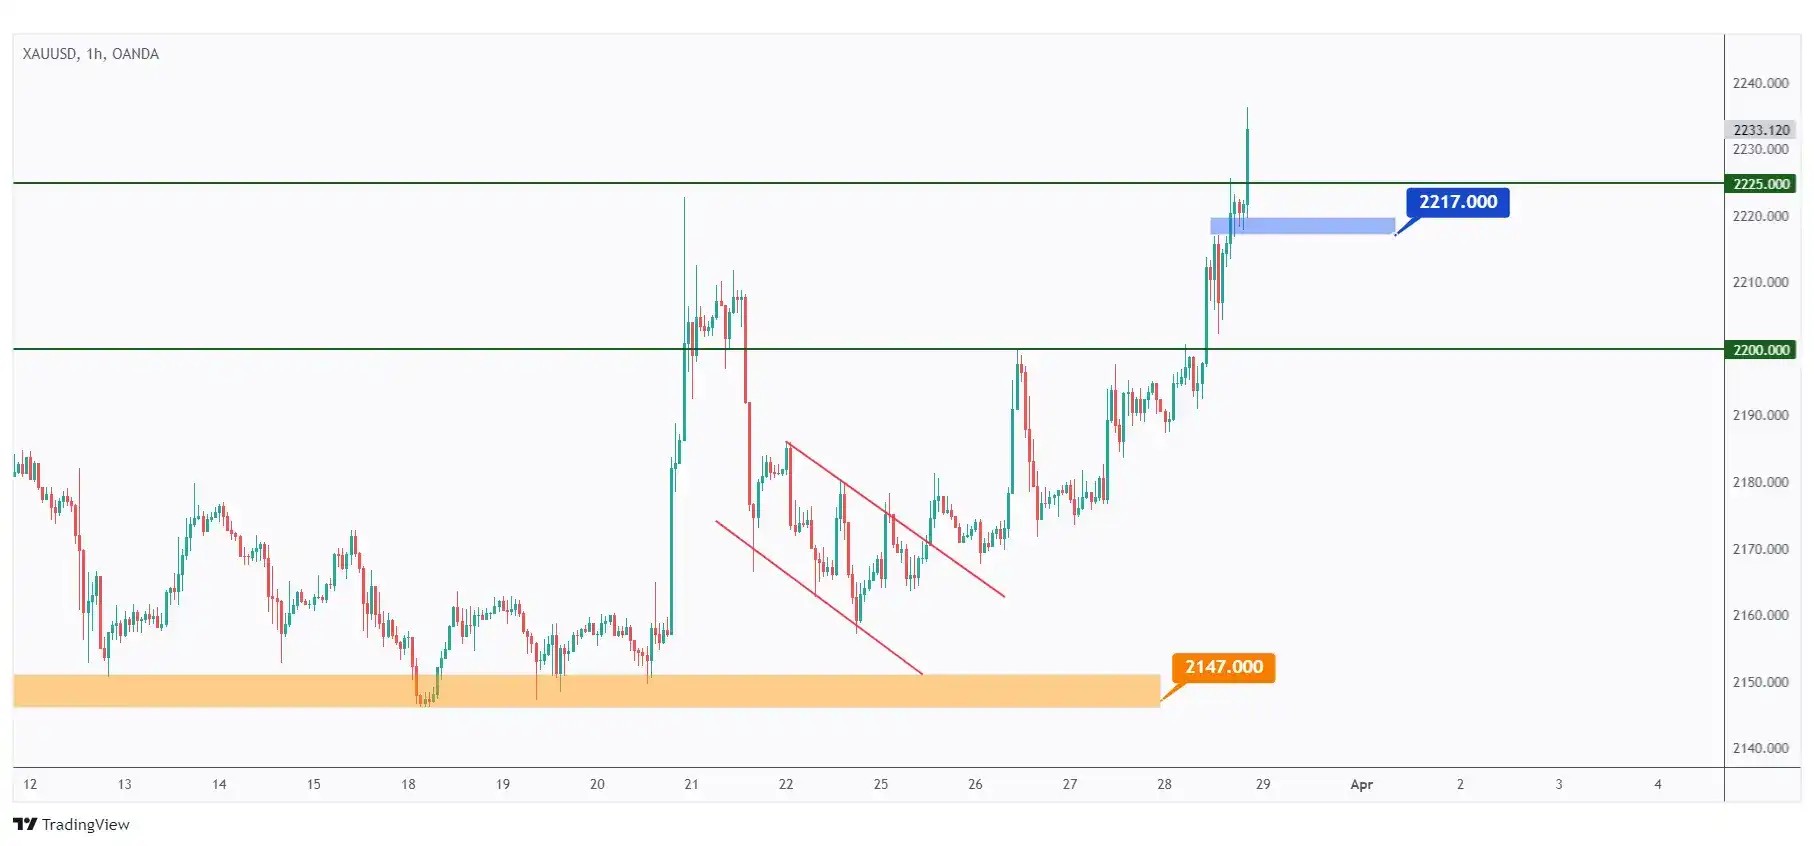
In the 1-hour timeframe, as per our previous analysis, Gold broke above the descending red channel and traded higher to reach our target around the $2225 resistance.
The bulls will continue to maintain control unless the last low in blue at $2217 is broken downward.
USDT.D, Bitcoin and Ethereum analysis
As a standard practice, I begin my analysis with USDT.D as it serves as a critical indicator of traders' sentiment. USDT.D provides valuable insights into whether traders are optimistic, signaling increased investment in cryptocurrencies, or pessimistic, indicating a shift towards stablecoins.
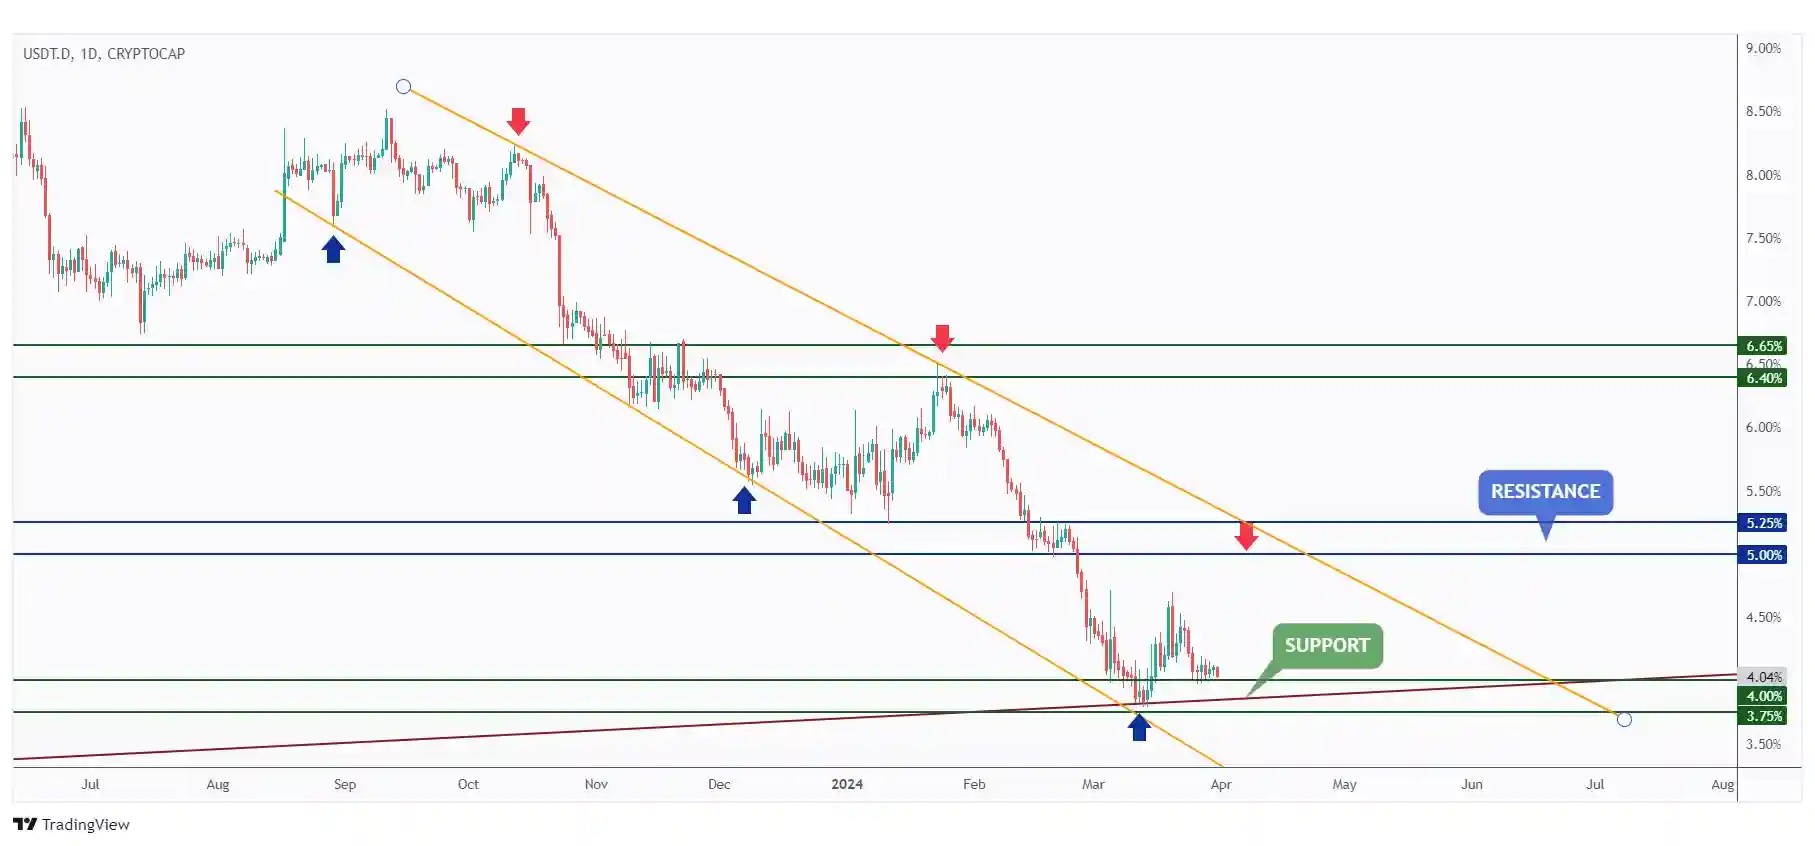
USDT.D is currently retesting the support zone between 3.75% and 4%.
As long as the support holds, we anticipate the bulls to take control soon, which wouldn't be healthy for the crypto market.
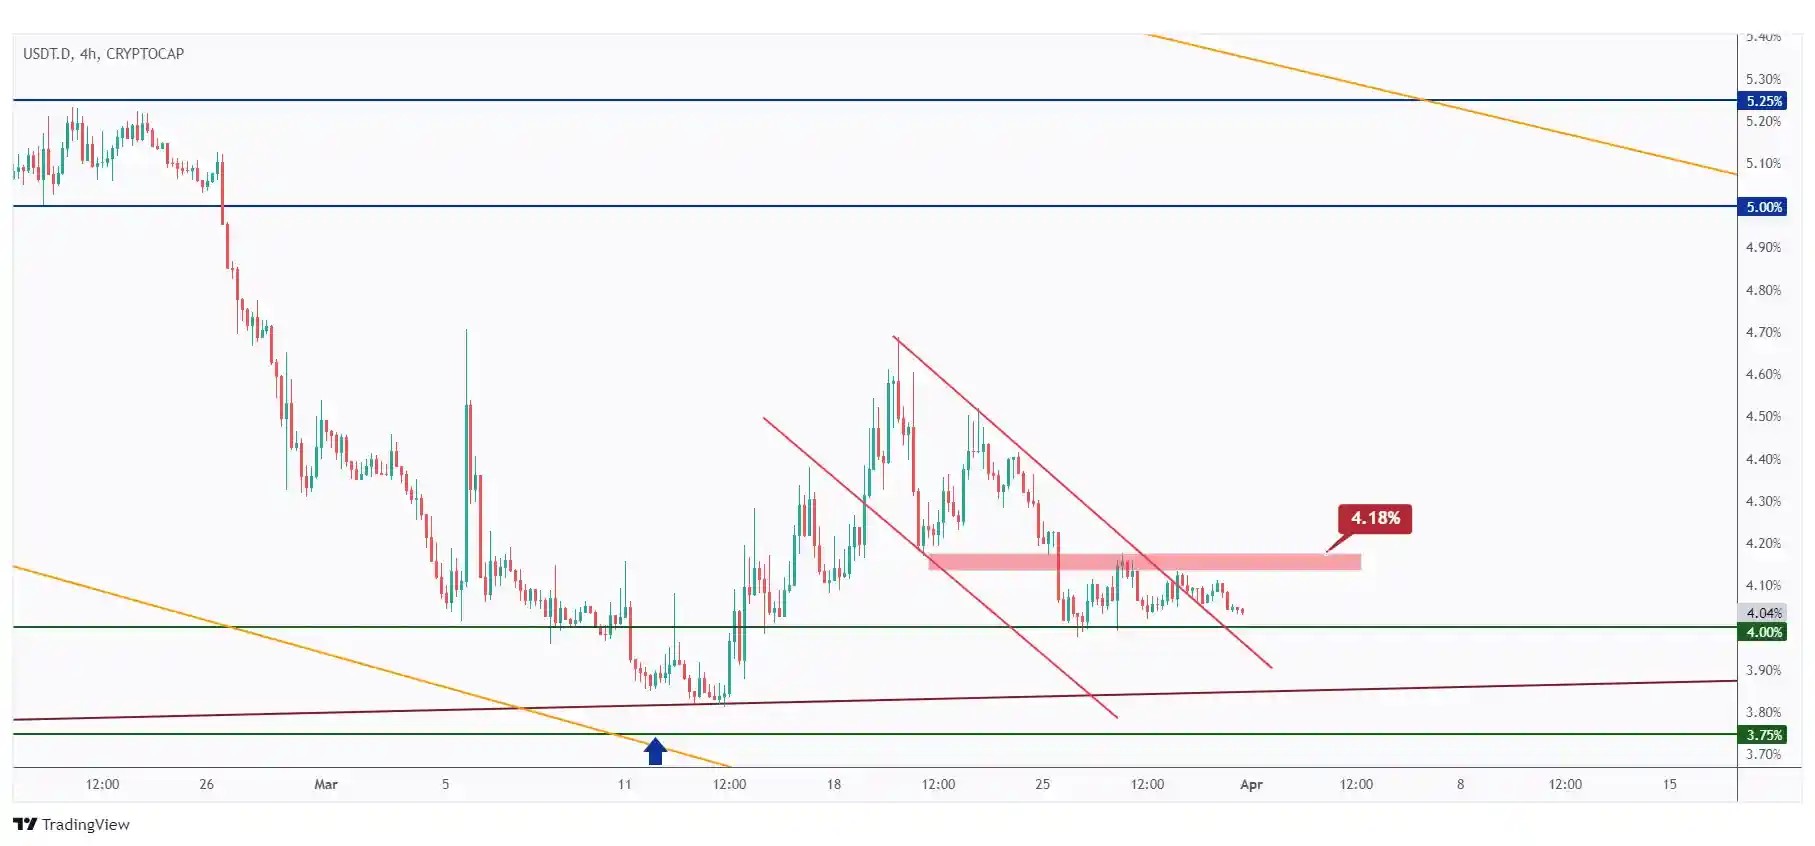
In the 4-hour timeframe, for the bulls to regain control and confirm the start of the correction phase, a breakout above the last major high marked in red at 4.18% is needed.
Meanwhile, USDT.D remains bearish, with the potential to continue trading lower within the support zone until 3.75%.
BTC had a relatively uneventful week, remaining within a narrow range between $68,500 and $71,600.
For the bulls to maintain control from a long-term perspective, a weekly candle close above the $71,000 resistance is necessary.
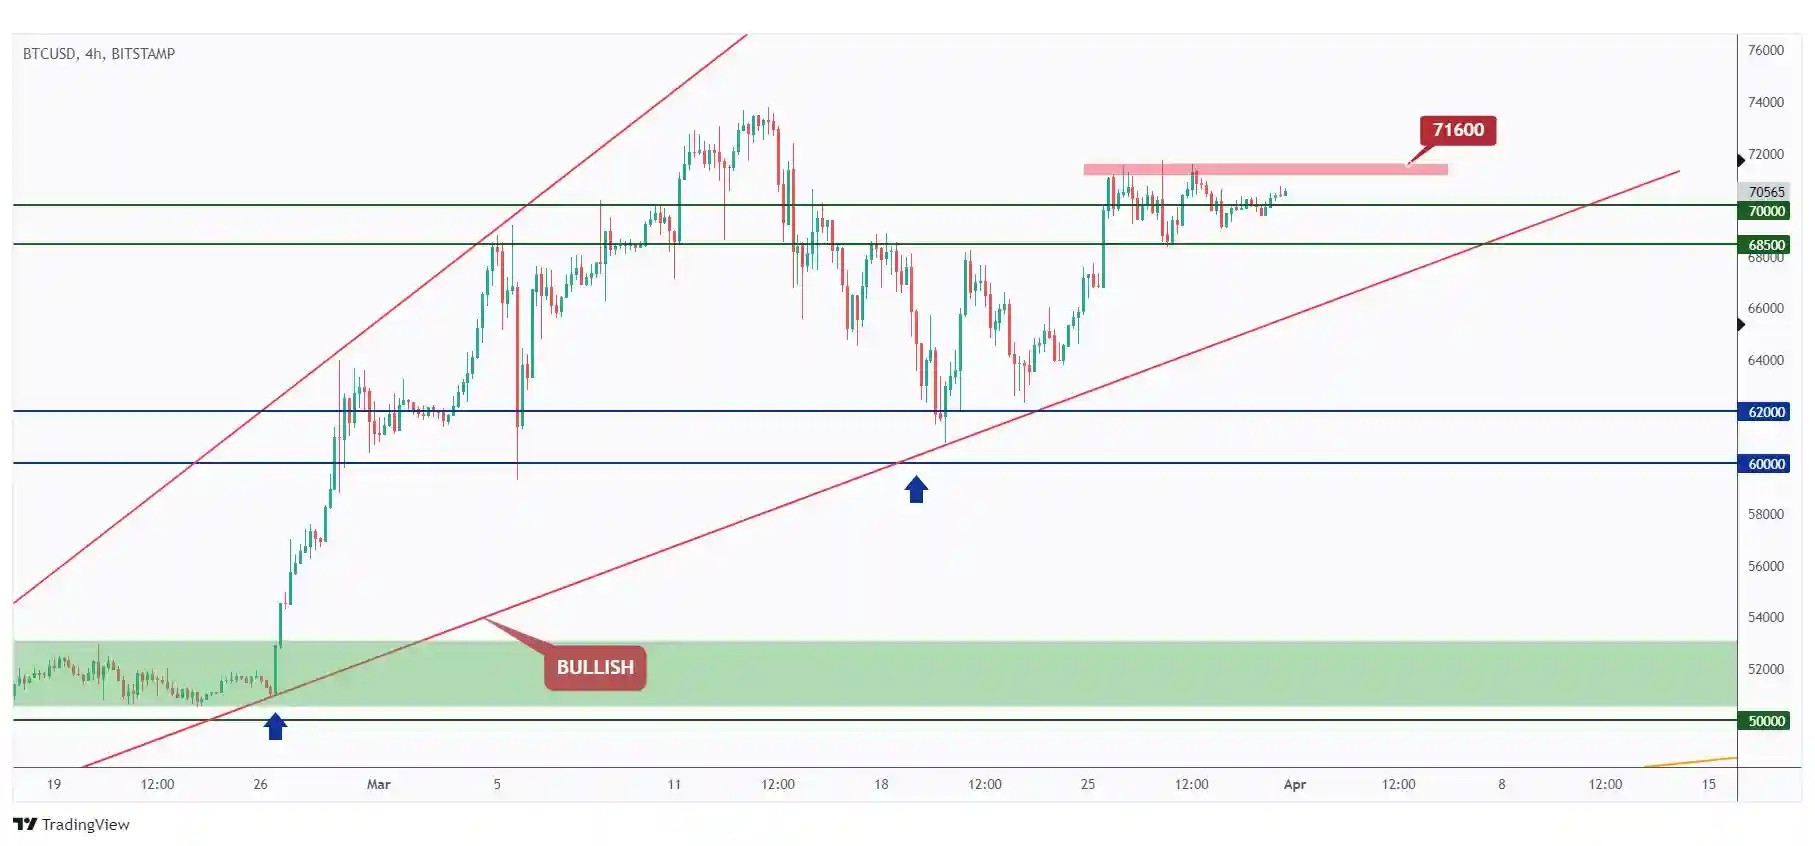
For the bulls to regain control in the short term, a break above the upper bound of the range marked in red at $71,600 is required.
In parallel, if the $68,500 mark is broken downward, we will expect the beginning of the bearish correction phase towards the lower red trendline.
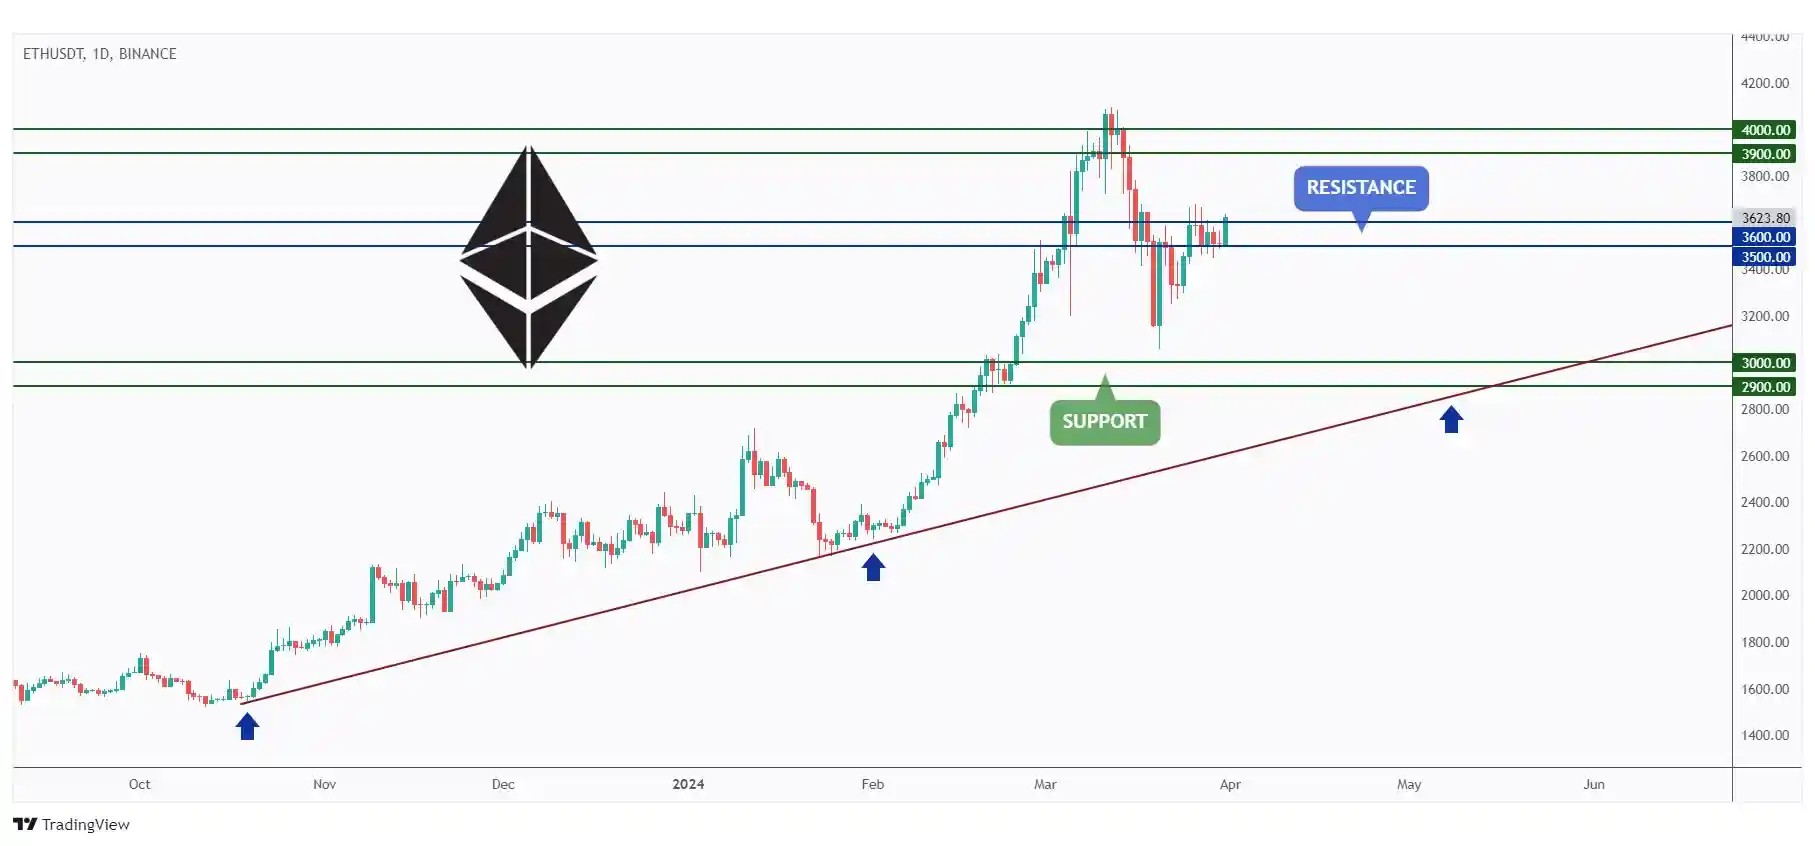
ETH has also been hovering within a narrow range this entire week.
For the bulls to regain control and initiate the next impulse movement towards $4000, a break above $3680 is needed.
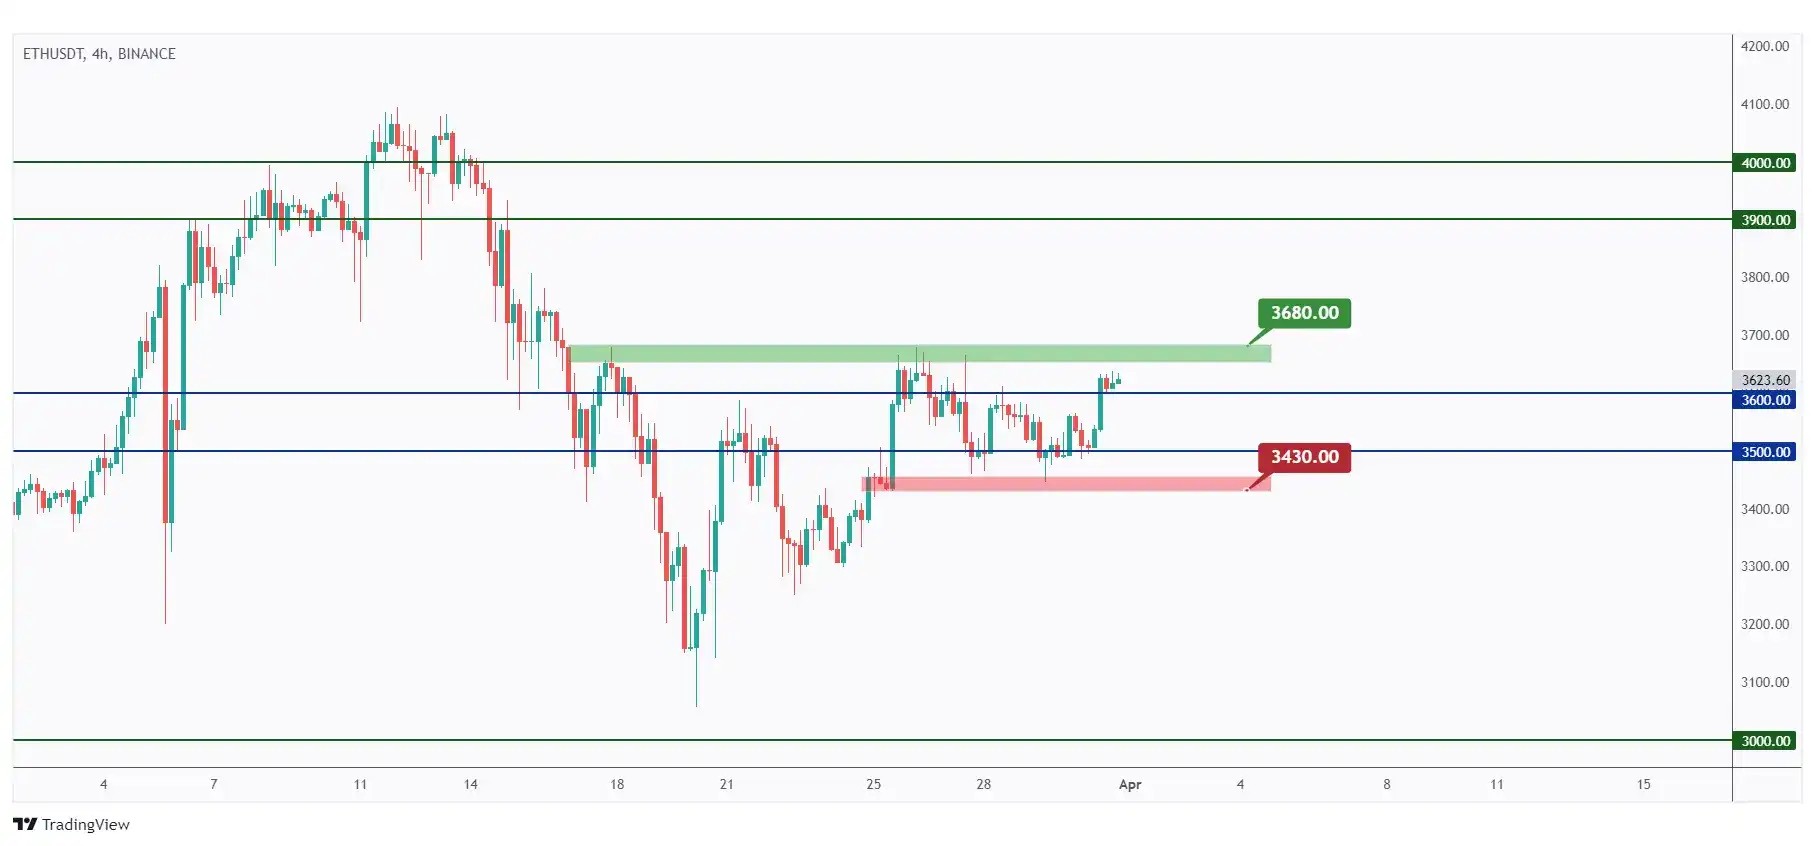
In parallel, if the last major low in red at $3430 is broken downward, we anticipate the start of a correction phase, potentially triggering a bearish movement towards the $3200 demand zone.
Quotes / Advices
To trade like a pro in crypto, employ strategic risk management, diversify your portfolio across different assets, and stay informed about market trends and news.
Develop a solid trading plan with predefined entry and exit points, and stick to it religiously.
Avoid emotional decision-making by setting aside predetermined trading capital and using stop-loss orders.
Continuously educate yourself, adapt to changing market conditions, and never stop refining your trading strategy.
Closing Remarks
In summary, the crypto market reflects a consolidation phase, with BTC ranging between $68,500 and $71,600, displaying mixed trends.
The US500 index leans bullish, targeting $5500 with support at $5180.
DXY's bullish stance towards $105 contrasts Gold's resistance at $2225.
USDT.D's rejection of support suggests an upward trend towards 5%.
Bitcoin stabilizes between $68,500 - $71,600, vulnerable to a shift towards $50,000 or $71,600.
Ethereum's recovery above $3680 hints at a bullish trend, backed by support at $3200.