
elcome to another crypto market outlook for the 24th of March!
In this edition, we'll delve into major assets such as US500, DXY, Gold, Bitcoin, and Ethereum, highlighting critical levels and potential trade setups.
From Bitcoin hovering within a narrow range, to Ethereum maintaining a bearish trend below $3600, and the Fear & Greed Index shifting from 'Extreme Greed' to 'Greed', this article covers it all.
Are you ready?
Today, we will cover the following topics:
- Market Heatmap and Fear and Greed Index
- US500, DXY and Gold Analysis
- USDT.D, Bitcoin and Ethereum Analysis
- Quotes / Advices
- Closing Remarks
Market Heatmap and Fear and Greed Index
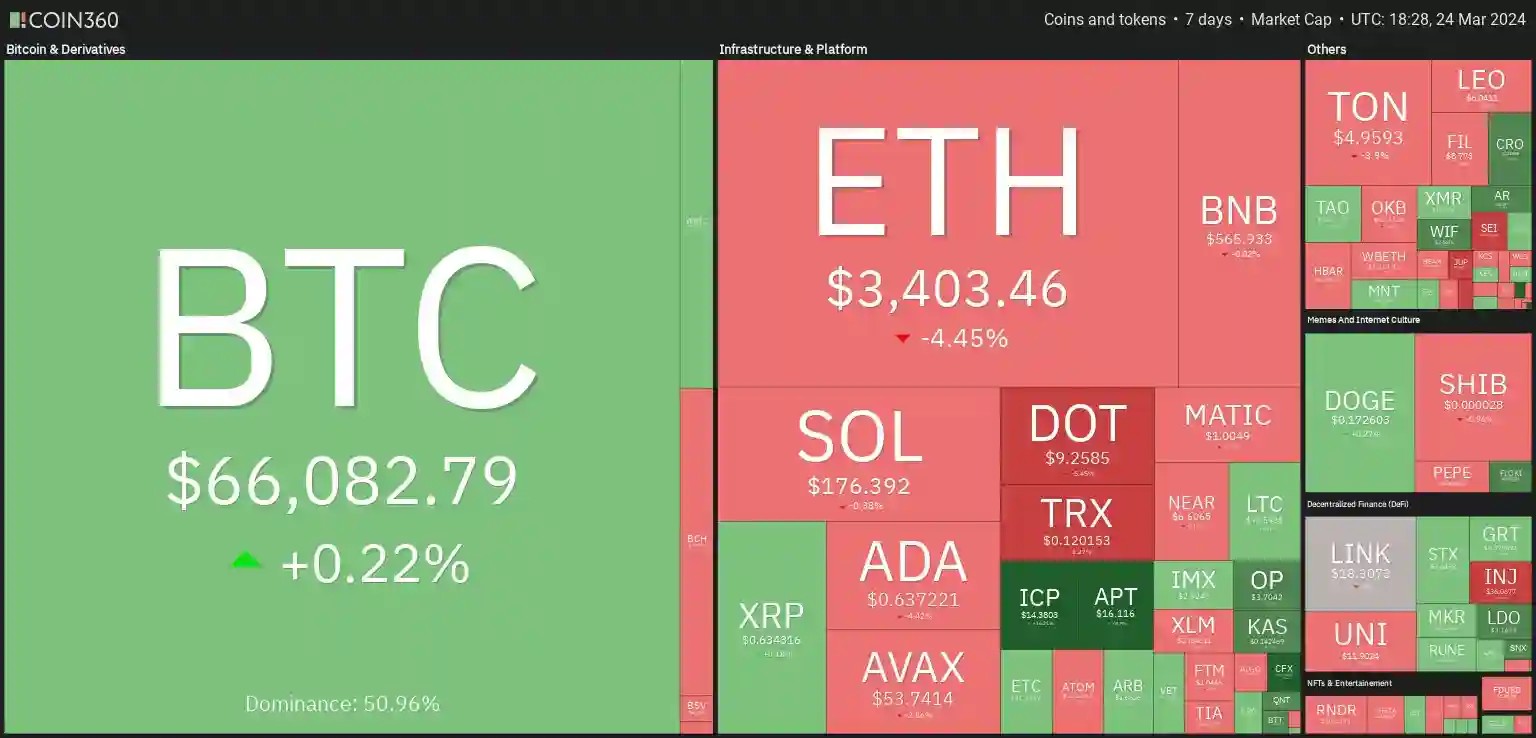
To initiate my research, I delved into the analysis by examining the market heatmap, which provided a comprehensive overview of the entire cryptocurrency market.
After rejecting the $60,000 support, BTC has been hovering within a narrow range between $62,000 and $66,500.
This ranging week got reflected on the entire crypto market, as we can see a mixture of bearish and bullish trends.
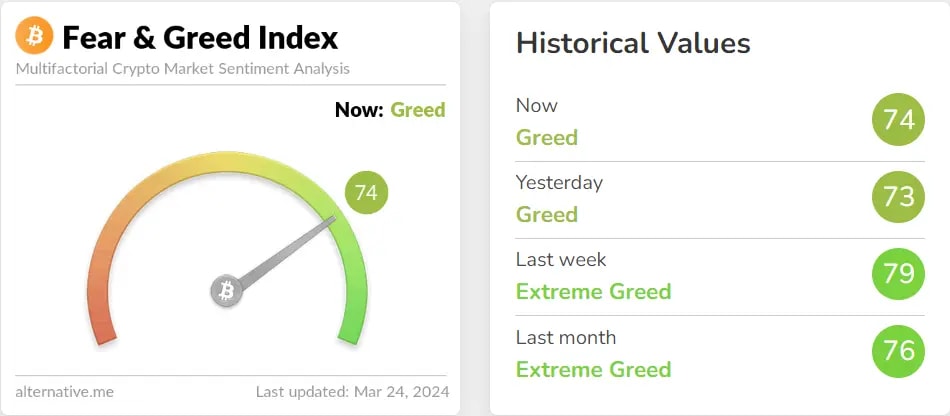
The Fear & Greed Index has dropped from "Extreme Greed" to “Greed”, indicating that traders are still optimistic but not with the same intensity as before.
This is quite normal during a correction phase.
US500, DXY and Gold analysis
We consistently monitor the US500 index to assess the current market sentiment. This practice is crucial because the cryptocurrency market often exhibits a significant correlation with the stock market, and this interconnection can impact its fluctuations.
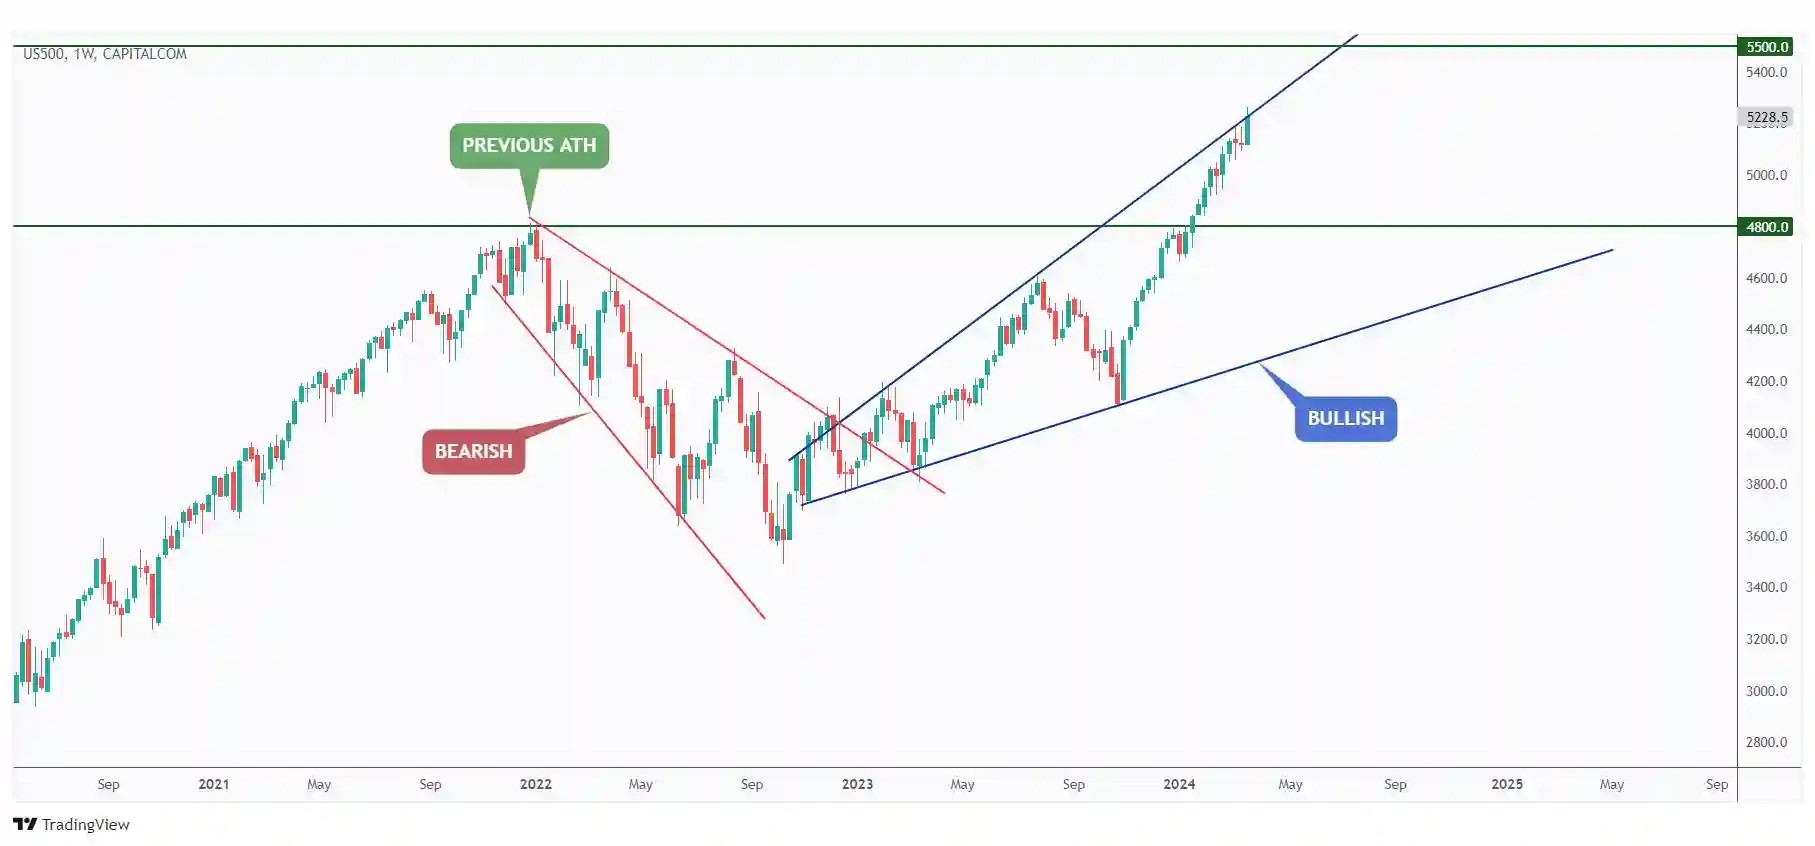
The US500 continues to hover around the upper boundary of the blue wedge pattern, serving as an overbought zone.
As long as the bulls remain in control, we anticipate a continuation towards the $5500 mark.
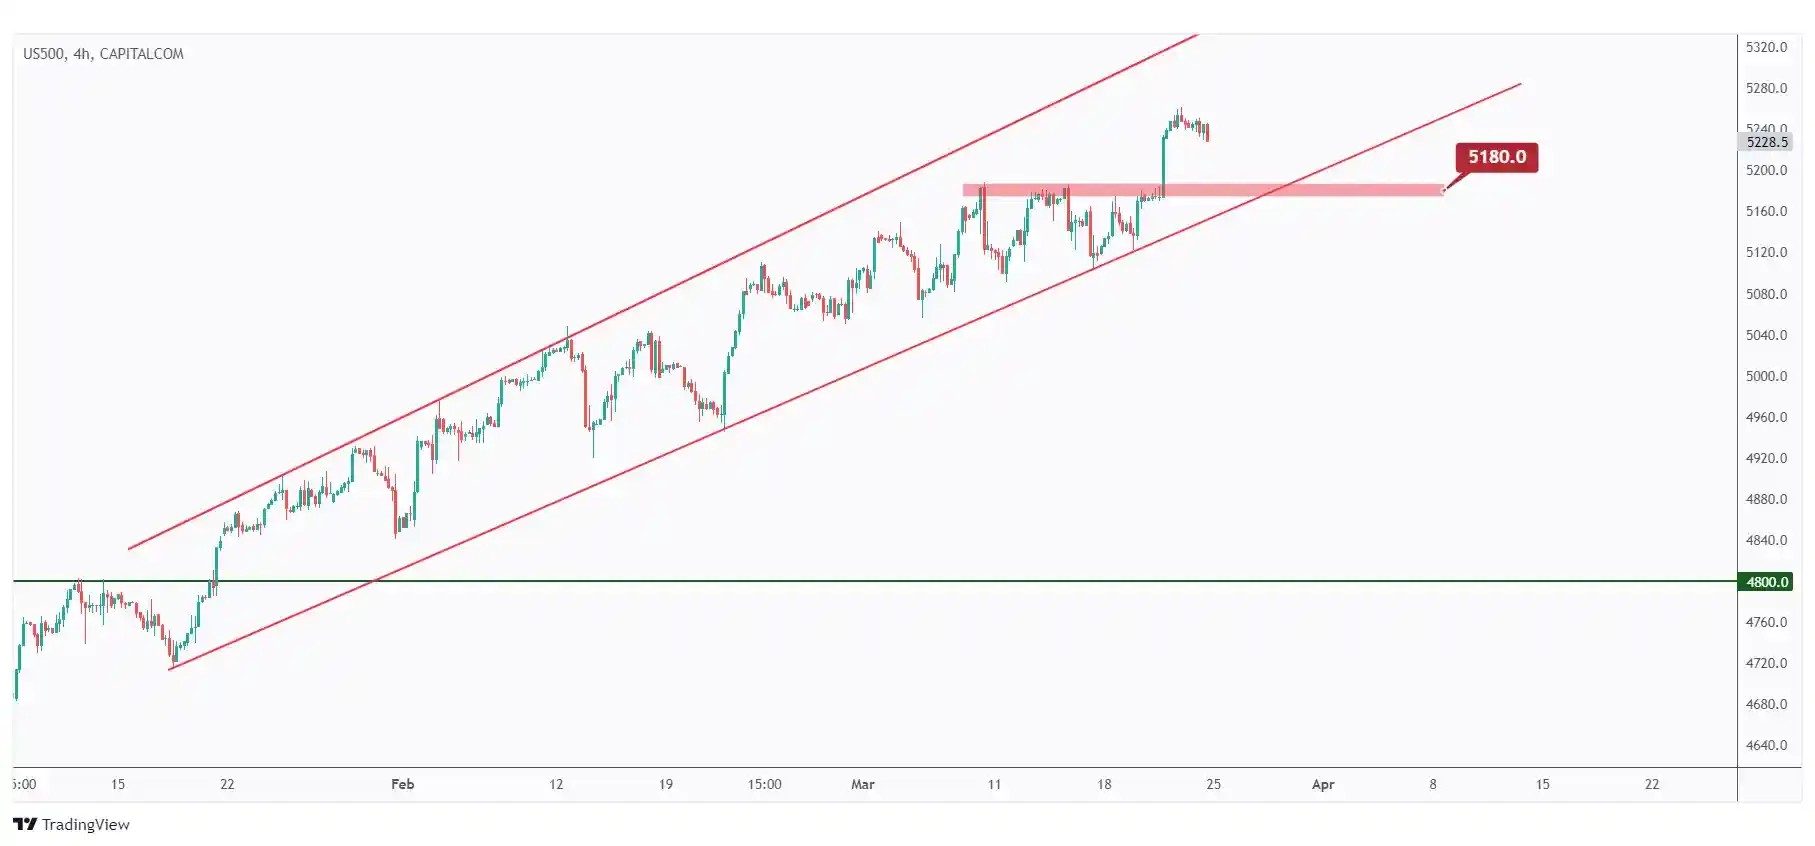
In the 4-hour timeframe, the US500 has shown an overall bullish trend, trading within the rising broadening wedge highlighted in red.
The bulls are expected to maintain control in the short term unless the last major low marked in red at $5180 is breached downward.
In such a scenario, a bearish correction towards the $5000 round number would be anticipated.
We consistently monitor the DXY - USD Index as part of our routine analysis. This is crucial because the value of nearly all assets, including BTC/USD, is closely tied to the USD, which serves as the benchmark currency in the financial market.
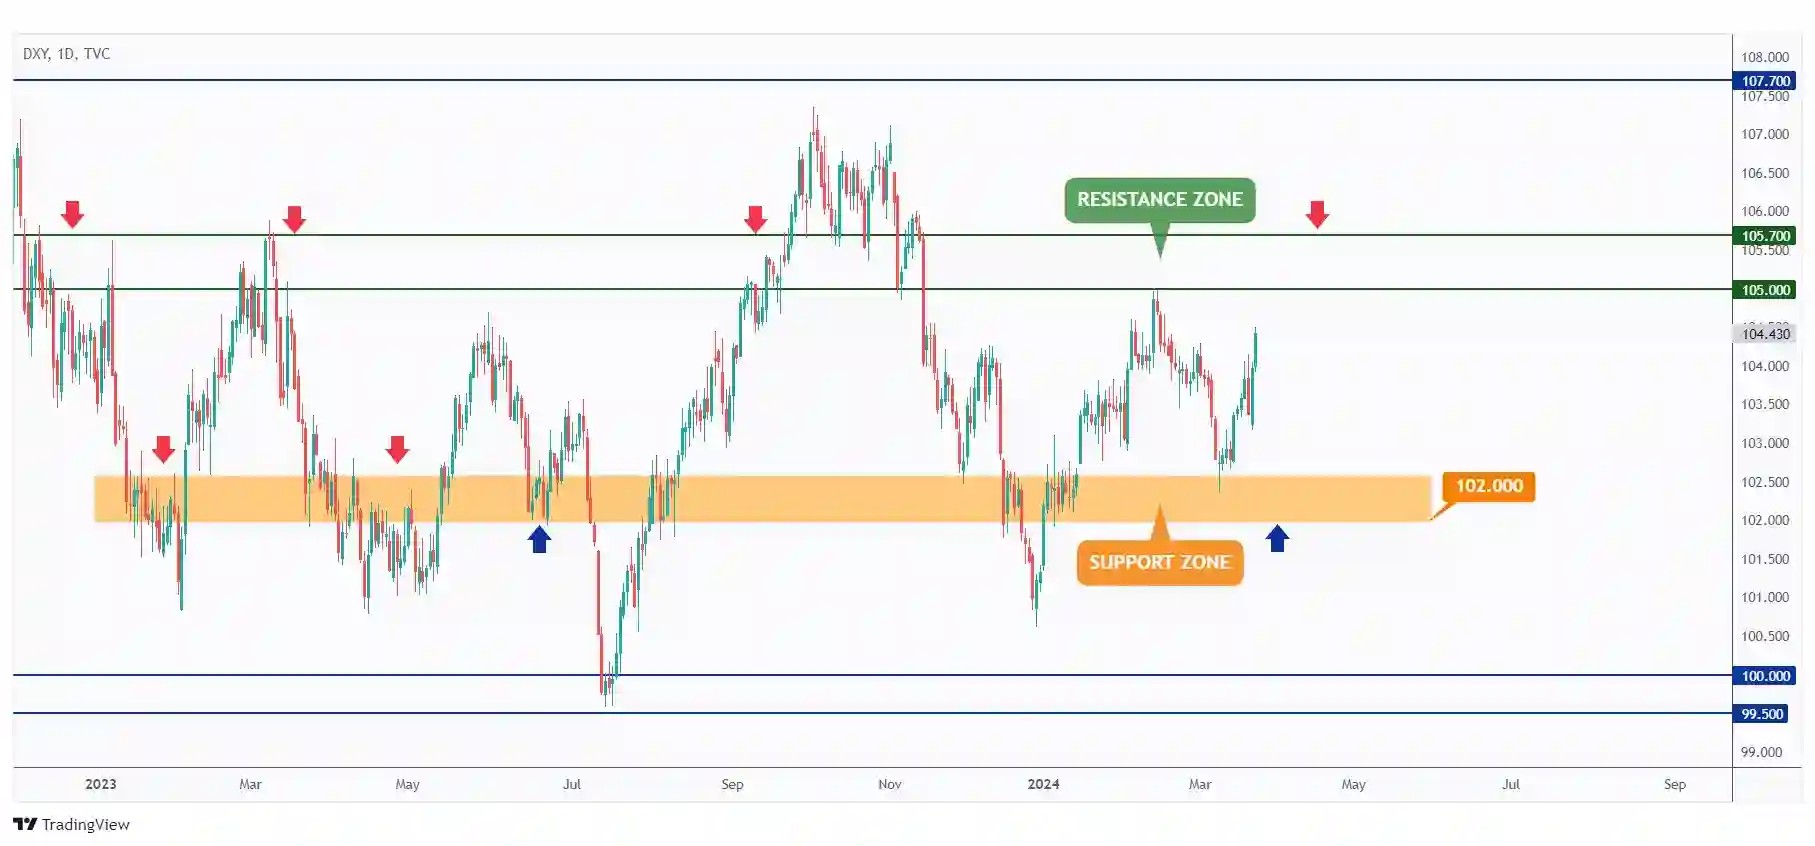
DXY has rejected the $102 support zone and traded higher.
Therefore, we anticipate a continuation towards the $105 resistance.
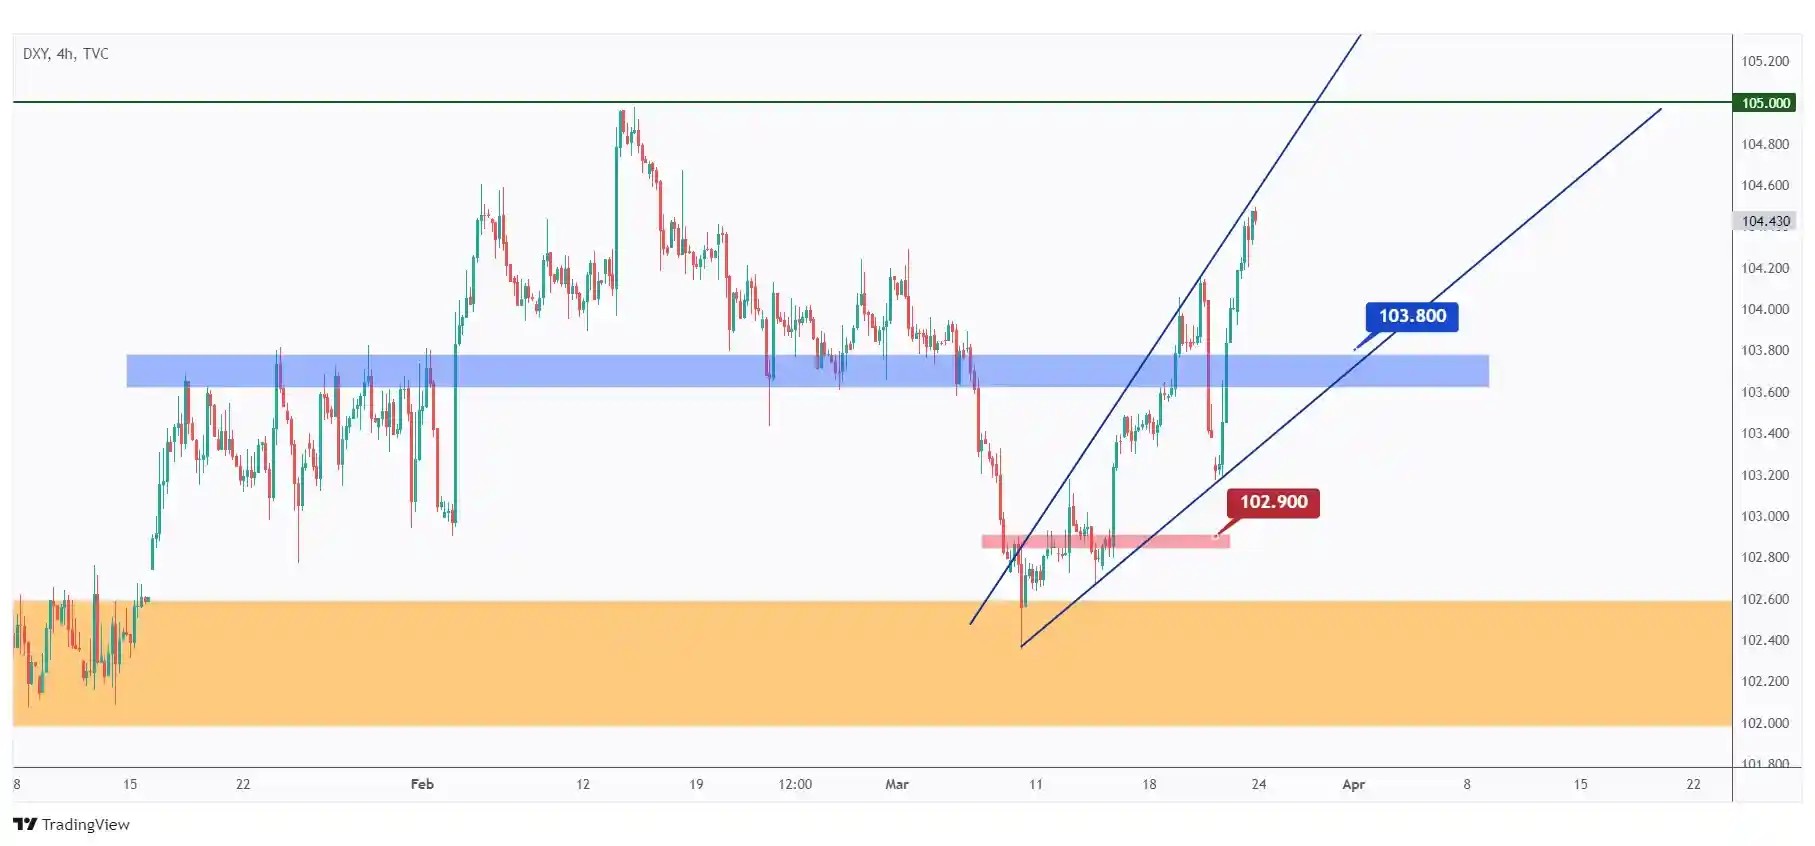
After breaking above the $103.8 structure, DXY traded higher and is currently bullish, trading within the rising wedge pattern in blue.
As it retests the lower bound of the wedge and $103.8 support, we will be looking for trend-following buy setups on lower timeframes.
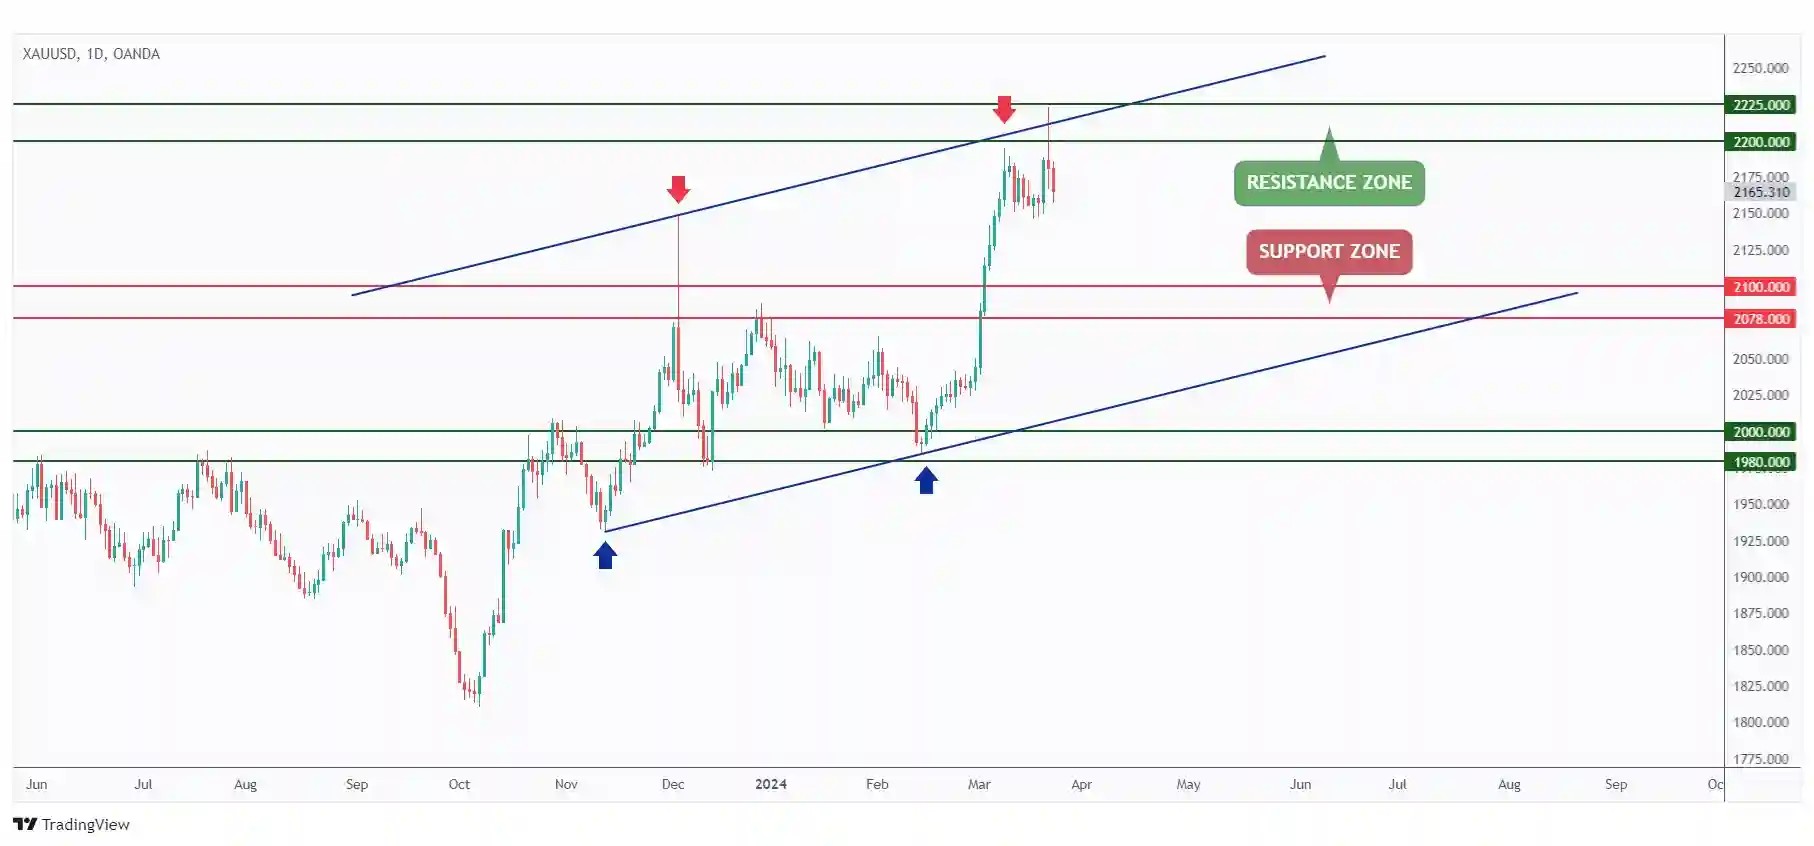
As expected in our previous analysis, Gold rejected the upper bound of the blue channel and the $2225 resistance.
To maintain bullish momentum over the long term, a break above $2225 is required.
Meanwhile, a bearish correction is anticipated.
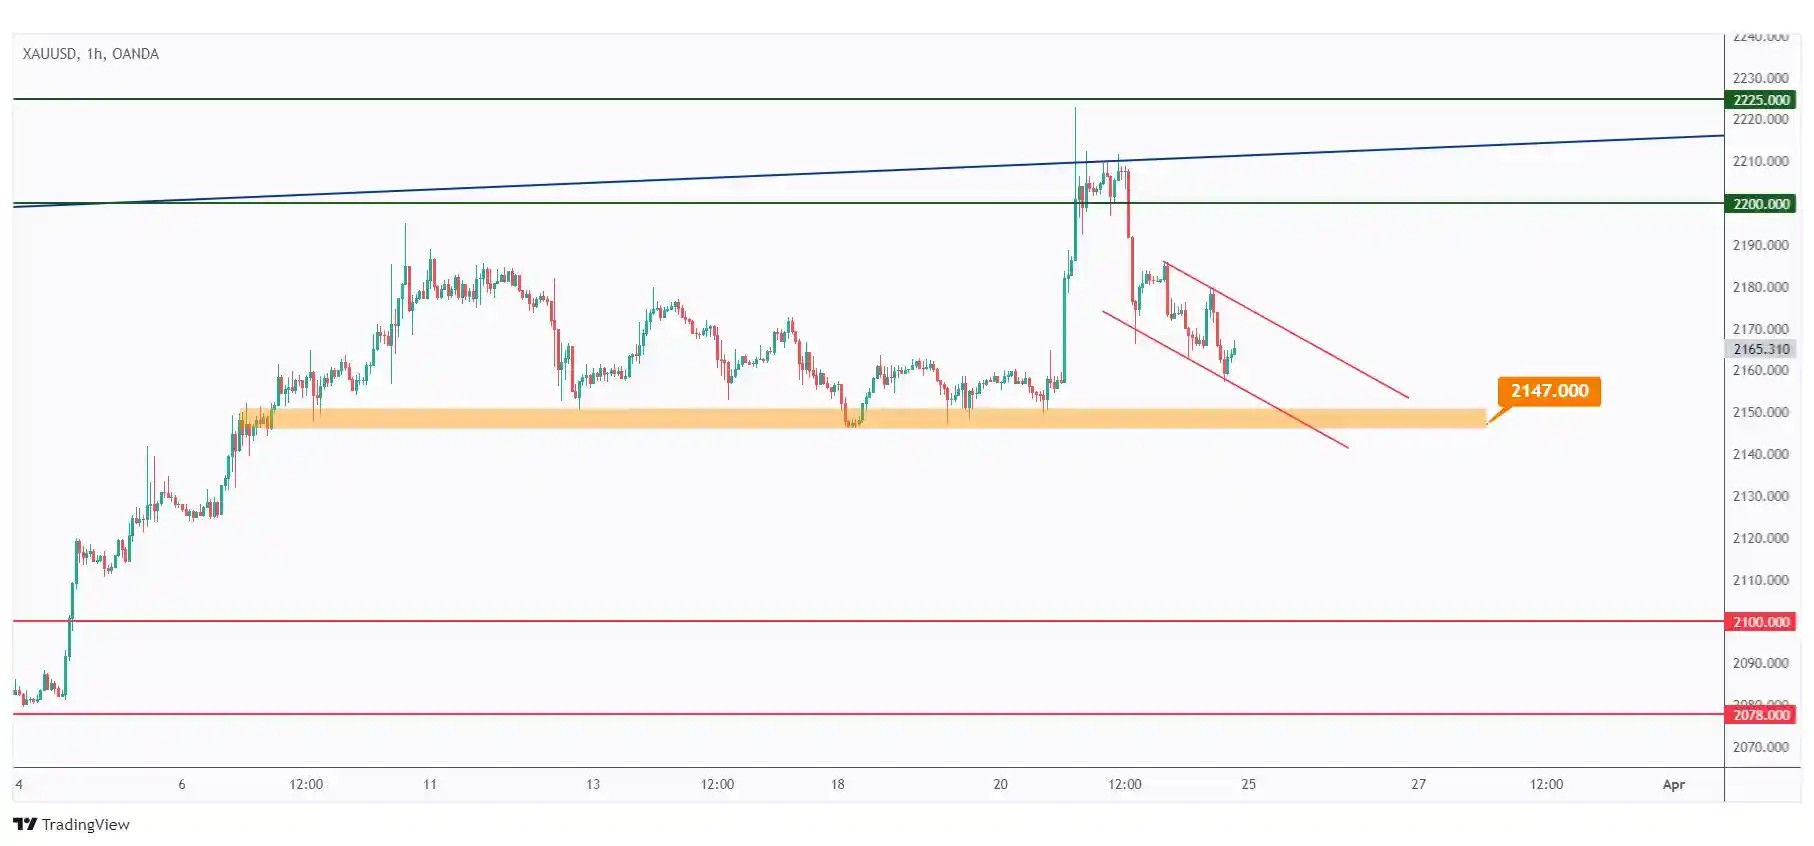
In the 1-hour timeframe, Gold has been bearish from a short-term perspective, trading within the falling channel outlined in red.
For the bulls to take over in the short term, a breakout above the upper red trendline is needed.
In parallel, for the bears to maintain control, a break below $2147 is necessary.
USDT.D, Bitcoin and Ethereum analysis
As a standard practice, I begin my analysis with USDT.D as it serves as a critical indicator of traders' sentiment. USDT.D provides valuable insights into whether traders are optimistic, signaling increased investment in cryptocurrencies, or pessimistic, indicating a shift towards stablecoins.
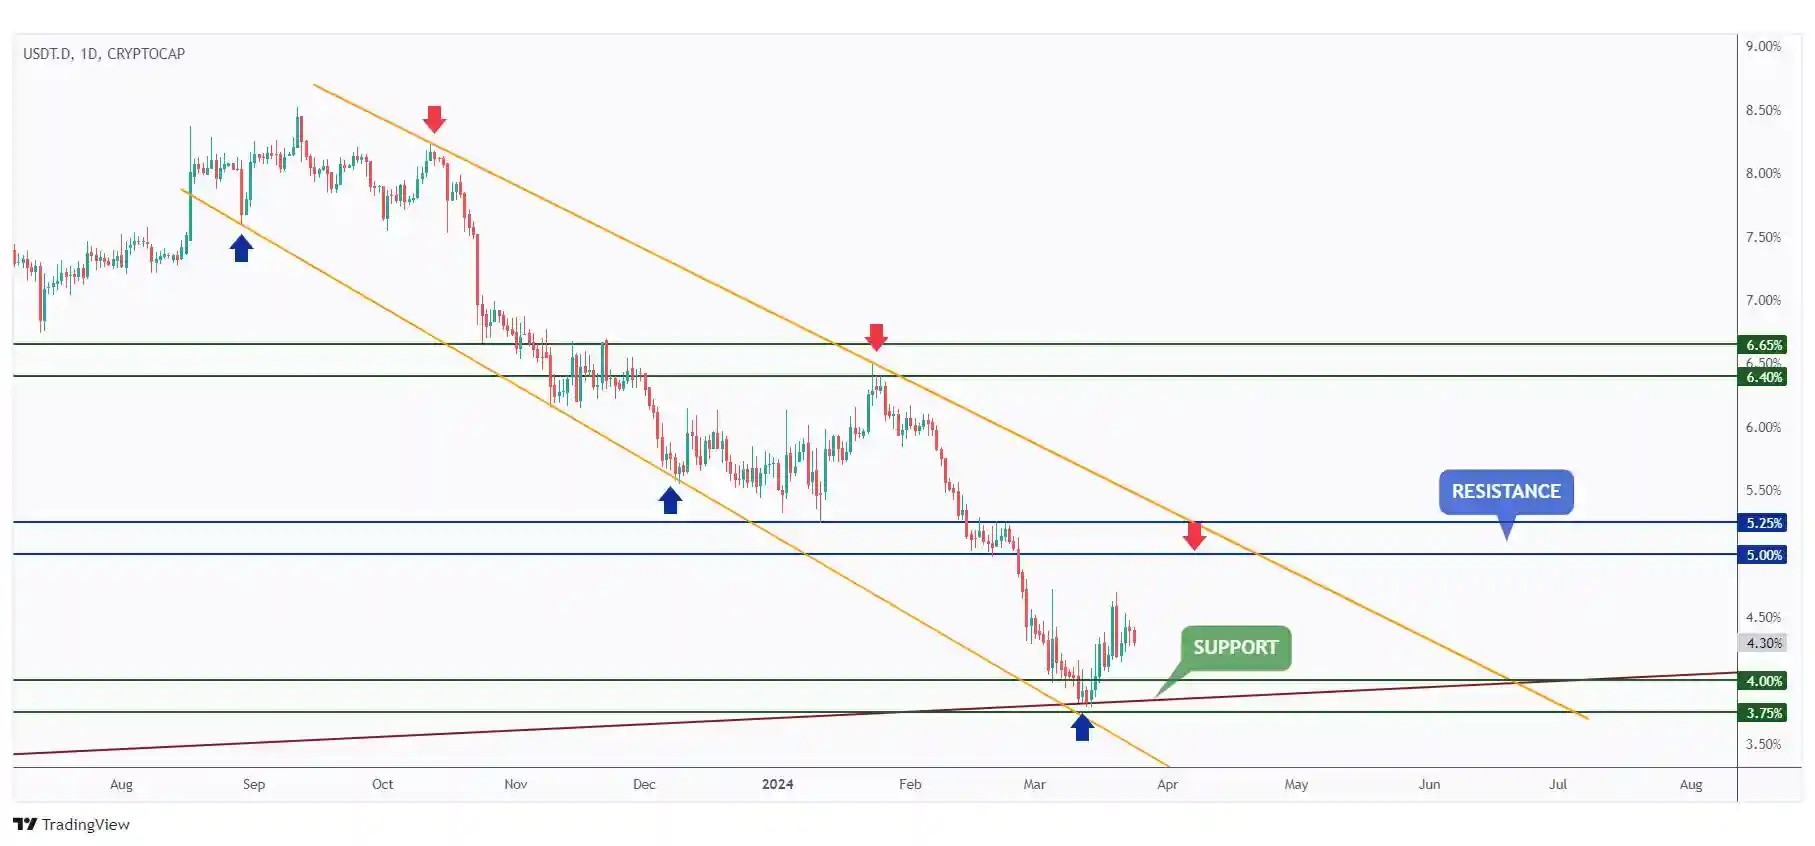
As expected in our previous analysis, USDT.D rejected the support levels between 3.75% and 4% and traded higher.
We are now anticipating a continuation towards the upper boundary of the orange channel and the resistance level at 5%.
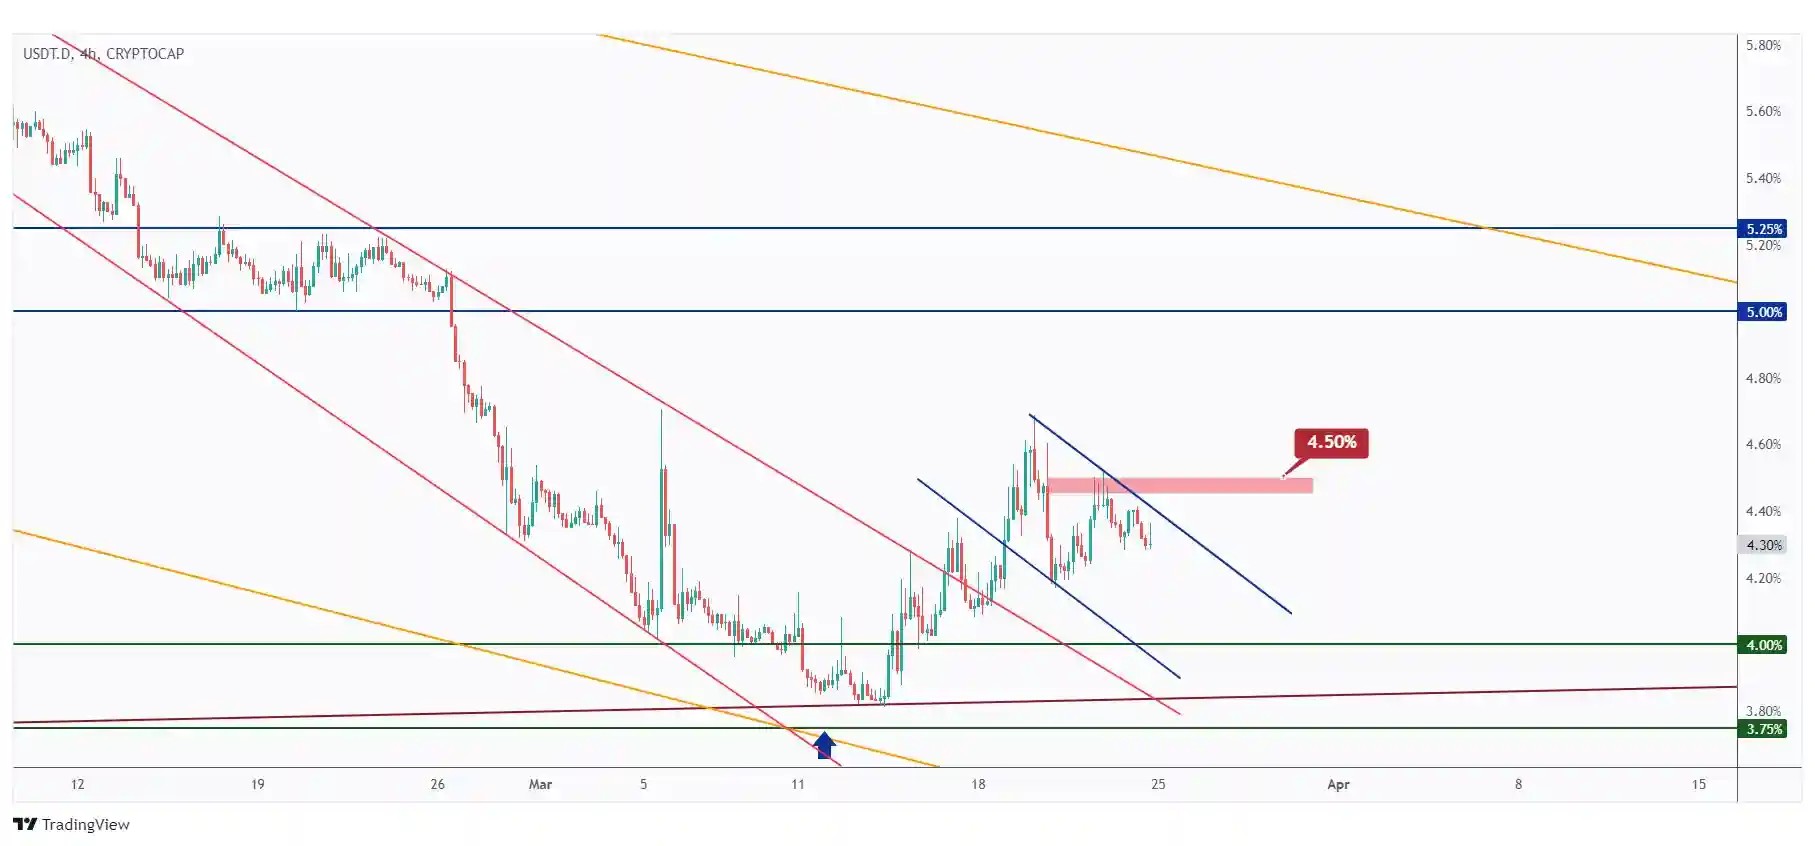
In the 4-hour timeframe, for the bulls to regain control and initiate the next impulse movement towards the 5% resistance, a breakout above the red channel is necessary.
Meanwhile, USDT.D remains bearish, with the potential to continue trading downwards towards the 4% support.
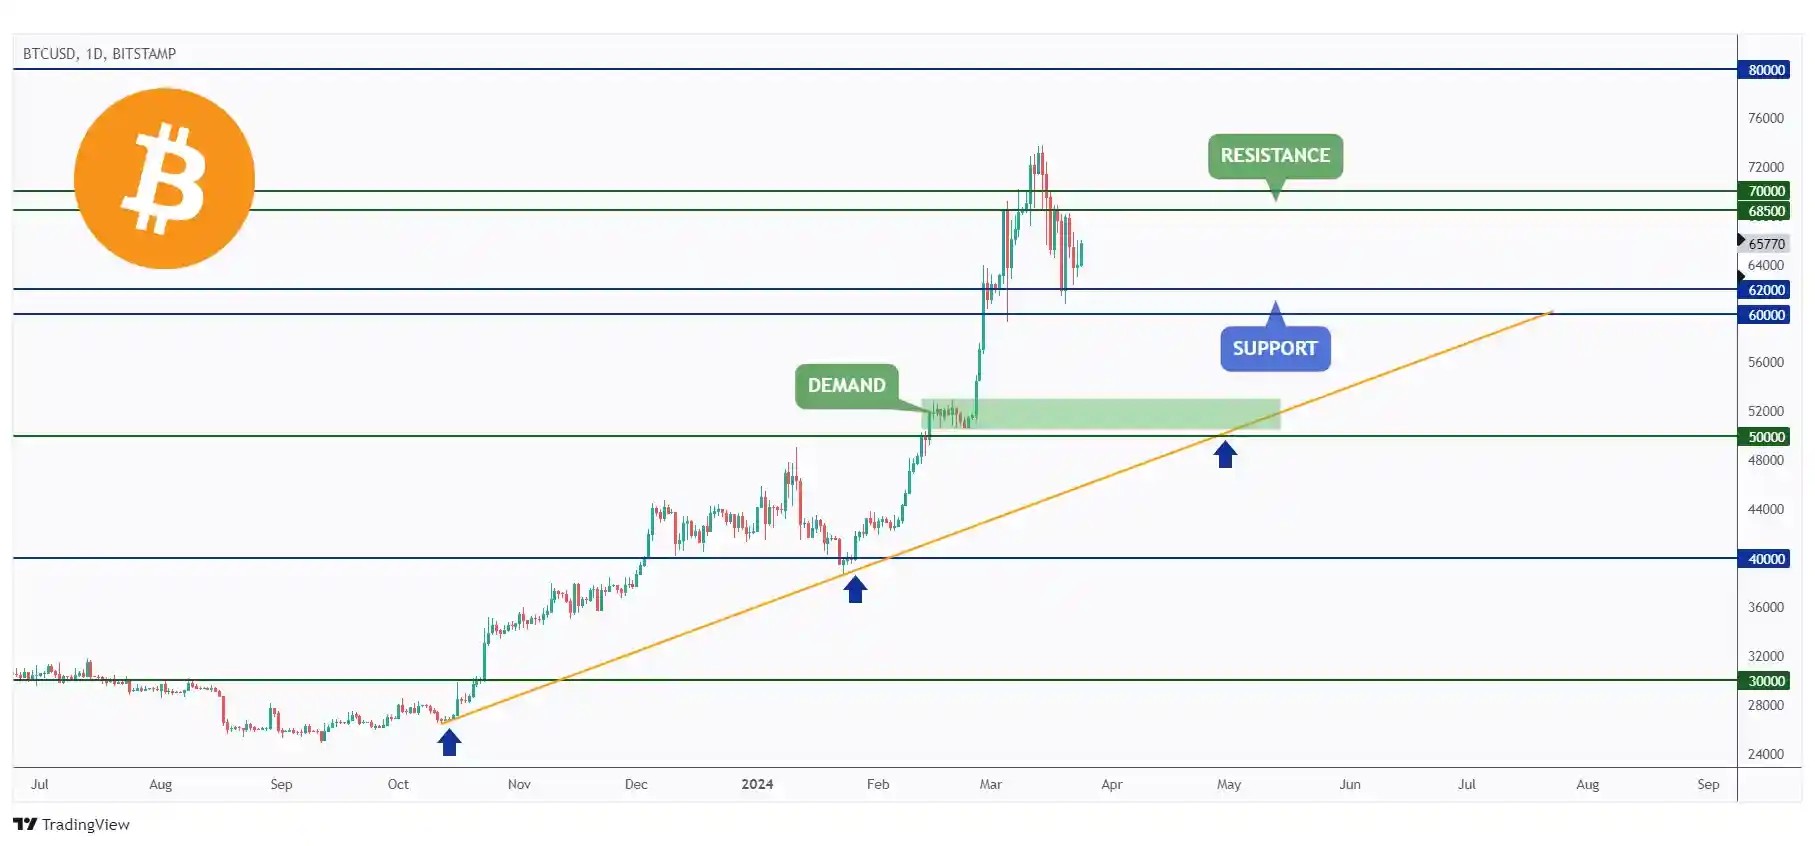
BTC had a relatively uneventful week, remaining within a narrow range between $60,000 and $70,000.
Should the $60,000 support be breached downwards, we anticipate a bearish movement towards the $50,000 demand zone.
In parallel, for the bulls to reclaim control from a long-term perspective, a breakout above the $70,000 resistance is necessary.
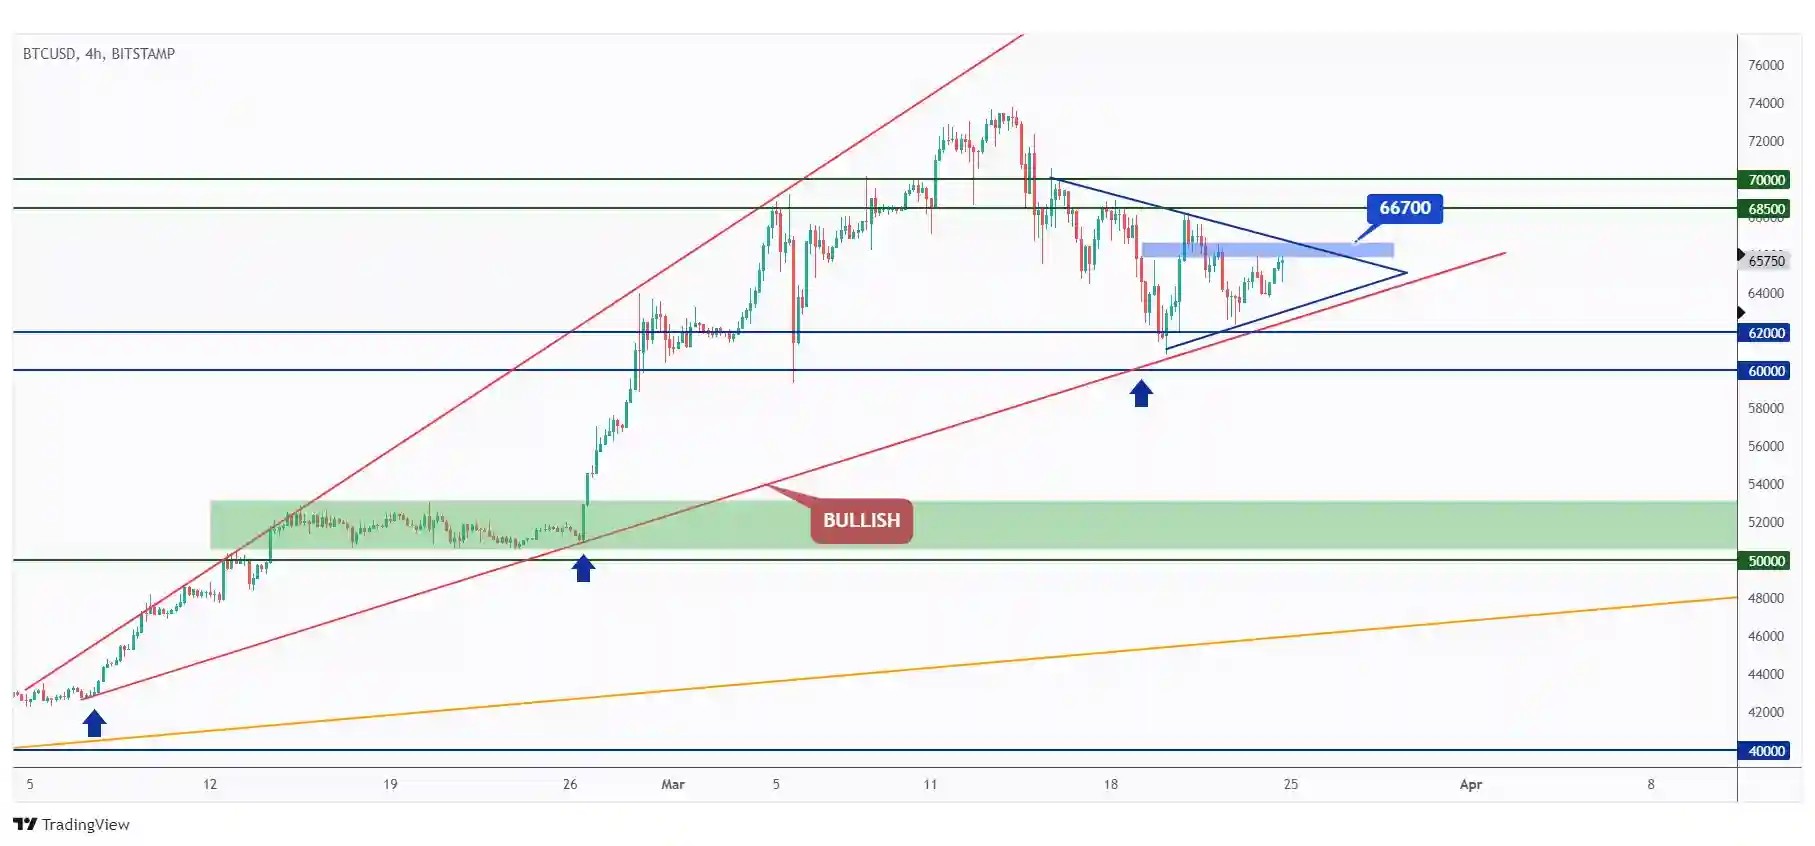
For the bulls to regain control in the short term, a break above the last major high marked in blue at $66,700 is required.
Meanwhile, we expect a movement towards the $60,000 support, where we will be looking for new buy setups.
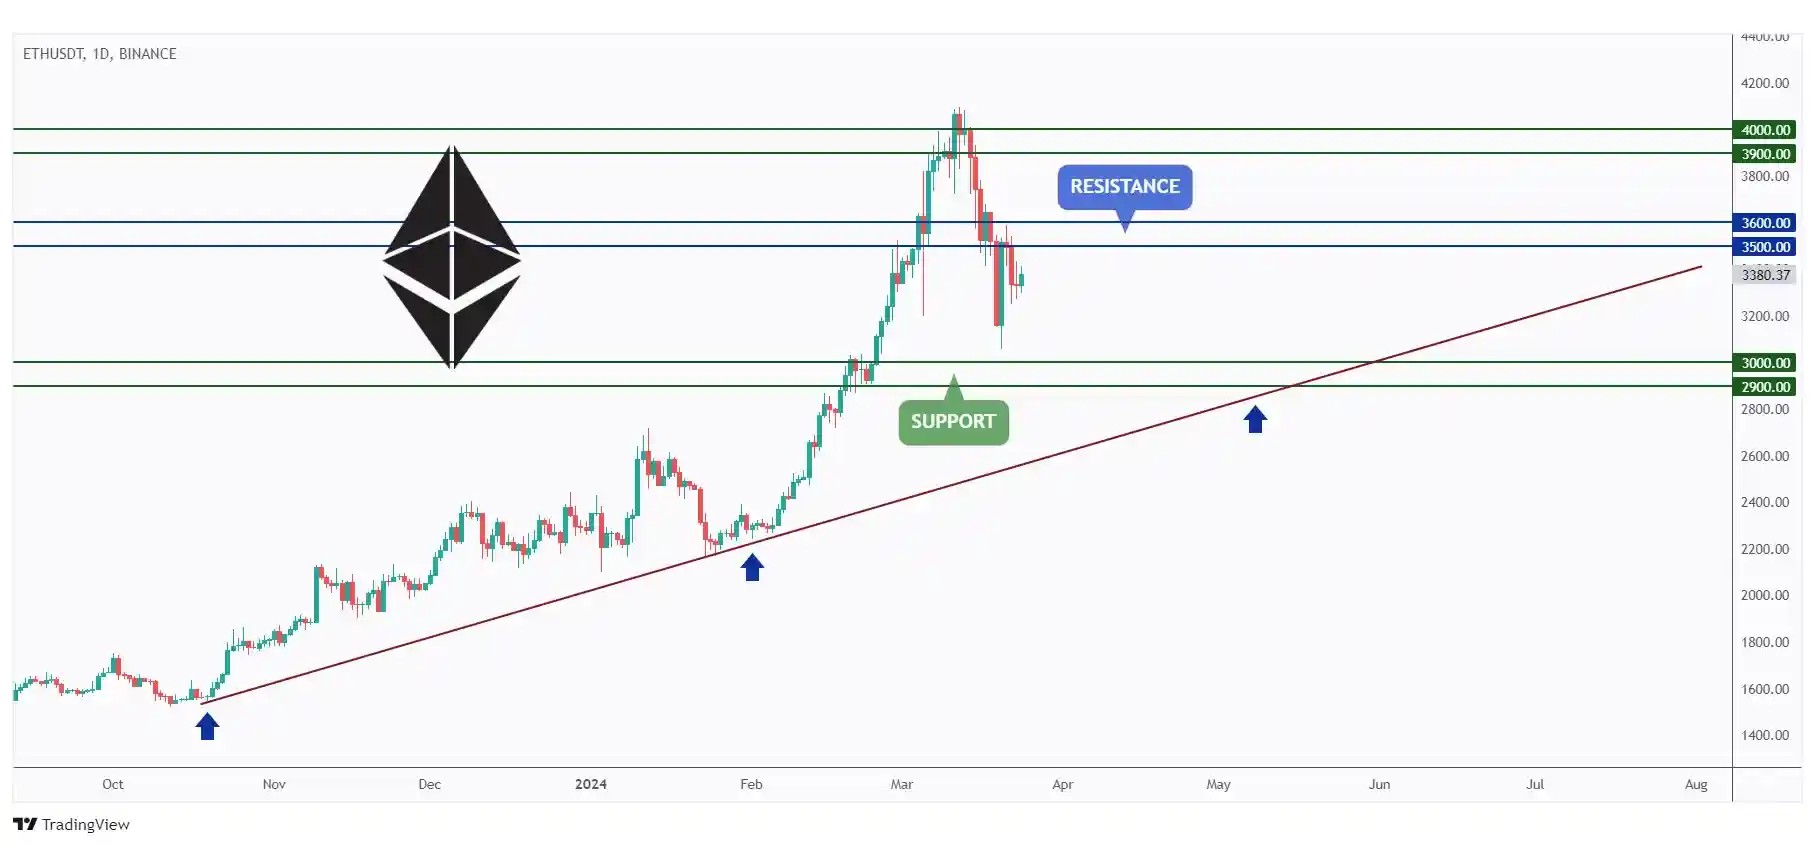
After breaking below $3500, ETH experienced a dip of over 13% but nearly fully recovered in less than 2 days.
For the bulls to regain control, a break above $3600 is necessary.
In the meantime, ETH remains overall bearish and could potentially trade lower to test the $3000 support level.
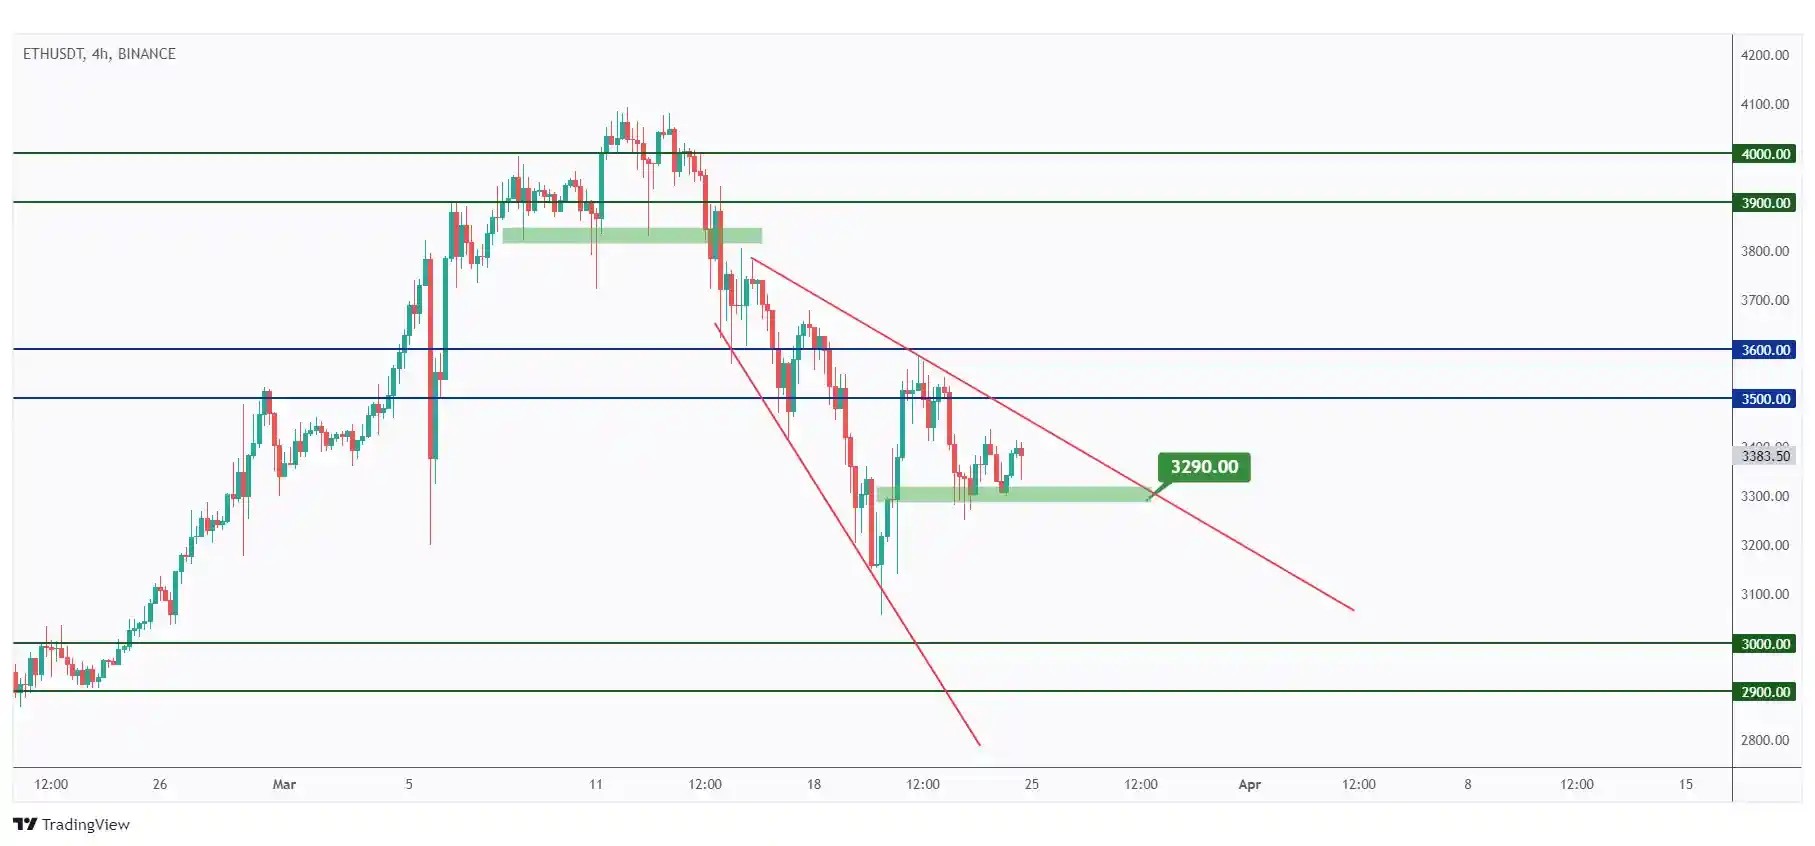
In the 4-hour timeframe, ETH has been trading within the falling broadening wedge outlined in red.
For the bears to regain control and initiate the next downward impulse movement towards $3000, a break below the last low marked in green at $3290 is necessary.
Quotes / Advices
Trading is akin to cooking, both blending art and science. Just as a chef selects ingredients, traders choose assets.
Timing is crucial, like gauging the heat under a pot. Both require patience and precision; a dash too much or too little can spoil the dish—or trade.
Recipes, like trading strategies, evolve with experience. Both demand creativity, adaptability, and a keen sense of balance to craft something satisfying from diverse elements.
Closing Remarks
In summary, the crypto market has witnessed a consolidation phase as BTC hovers between $62,000 and $66,500, reflecting a mix of bearish and bullish trends.
The US500 index shows bullish tendencies, expected to reach $5500 with support at $5180.
DXY's rejection of $102 suggests a bullish trend towards $105, while Gold faces resistance at $2225.
USDT.D's rejection of support levels between 3.75% and 4% suggests an upward move towards 5%.
Bitcoin's stability around $60,000 - $70,000 may shift with a breach of support towards $50,000 or a breakout above $70,000.
Ethereum's recovery from a dip below $3500 indicates potential for a bullish trend above $3600, while support lies at $3000.