
elcome to another crypto market outlook for the 21st of February!
In today's market analysis, we will delve into the current state of the cryptocurrency market. BTC is hovering around a significant resistance zone, while USDT.D is maintaining a narrow range.
Furthermore, we will cover five altcoins (XVG, MATIC, OCEAN, HBAR, and STX), emphasizing their key levels and potential trading setups.
Are you ready?
Today, we will cover the following topics:
- USDT.D and BTC Analysis
- 5 Altcoins Analysis
- Quotes / Advices
- Closing Remarks
USDT.D and BTC analysis
As usual, I always start my analysis with USDT.D as it serves as an indicator of traders' sentiment. USDT.D reflects whether traders are optimistic (investing in cryptocurrencies) or pessimistic (shifting towards stablecoins).
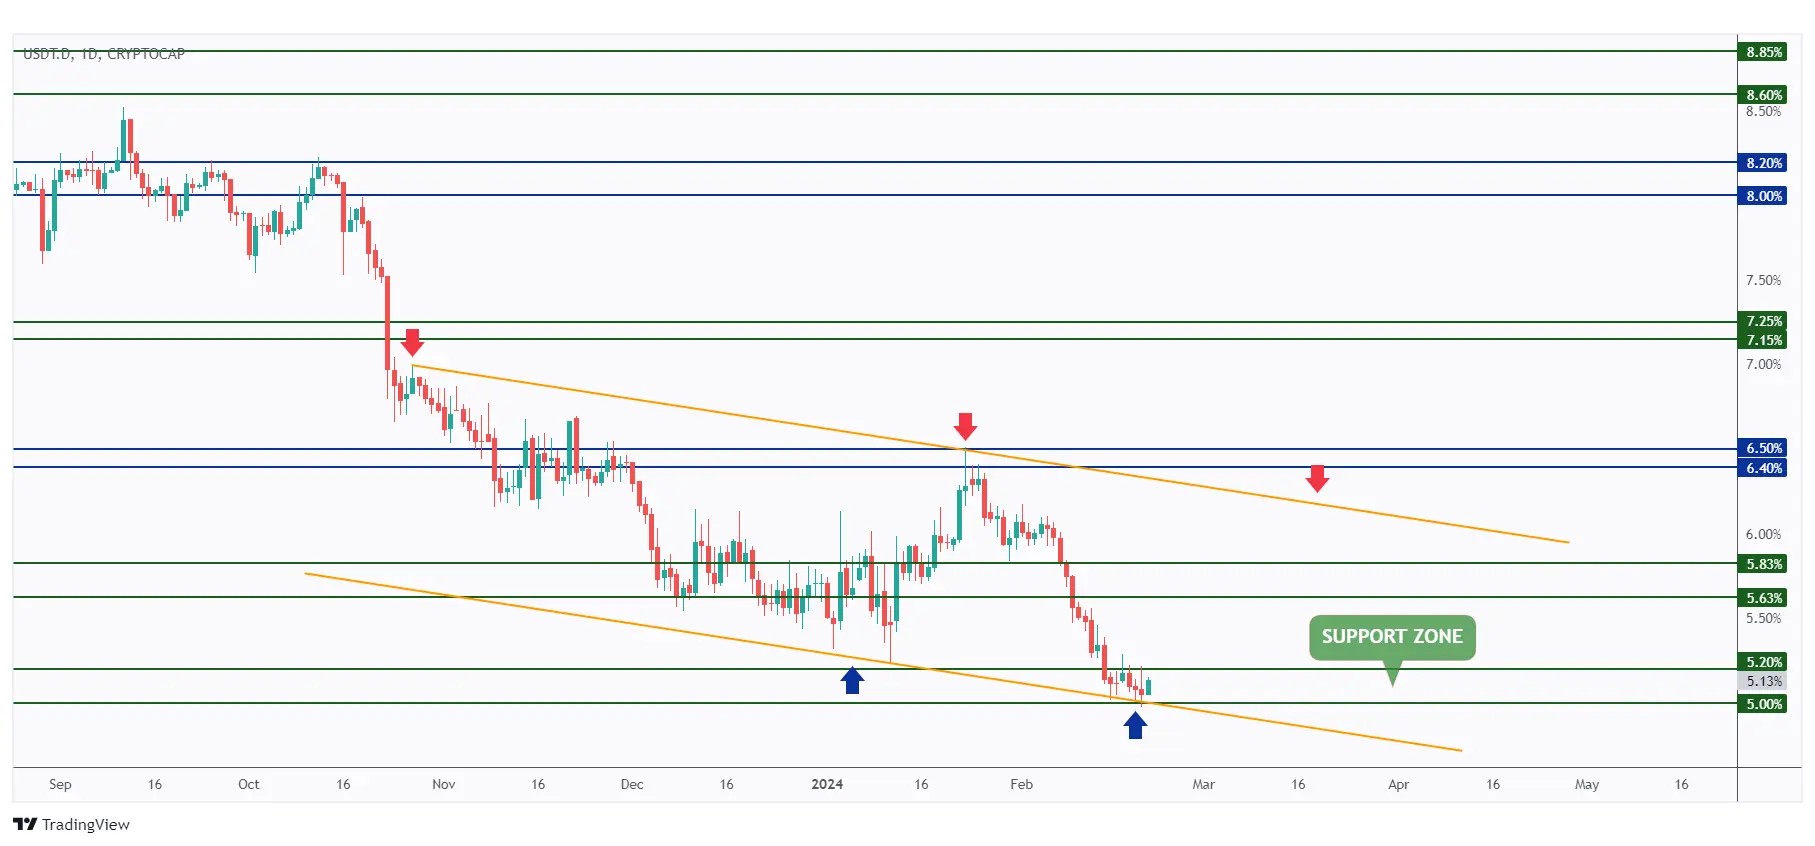
USDT.D has been hovering around the 5% - 5.2% support zone for over a week now.
As long as this support holds, we anticipate a bullish movement, which could be unfavorable for the crypto.
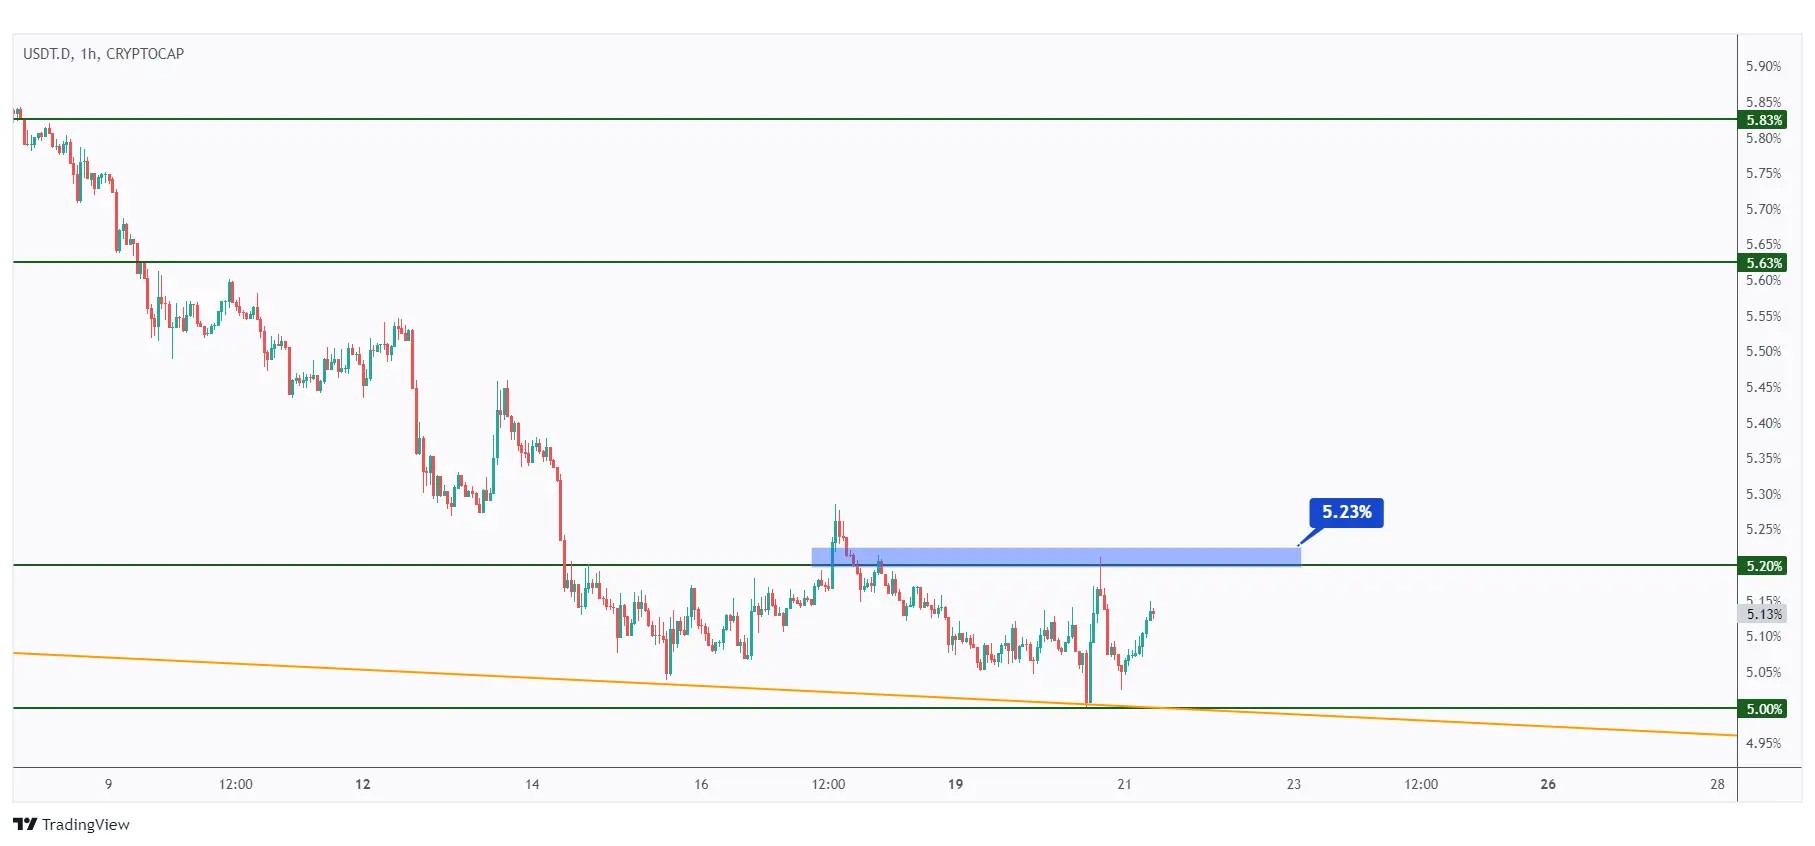
For the bulls to take over, and shift the momentum from bearish to bullish, a breakout above the last major high marked in blue at 5.23% is necessary.
Meanwhile, USDT.D would be confined within a narrow range.
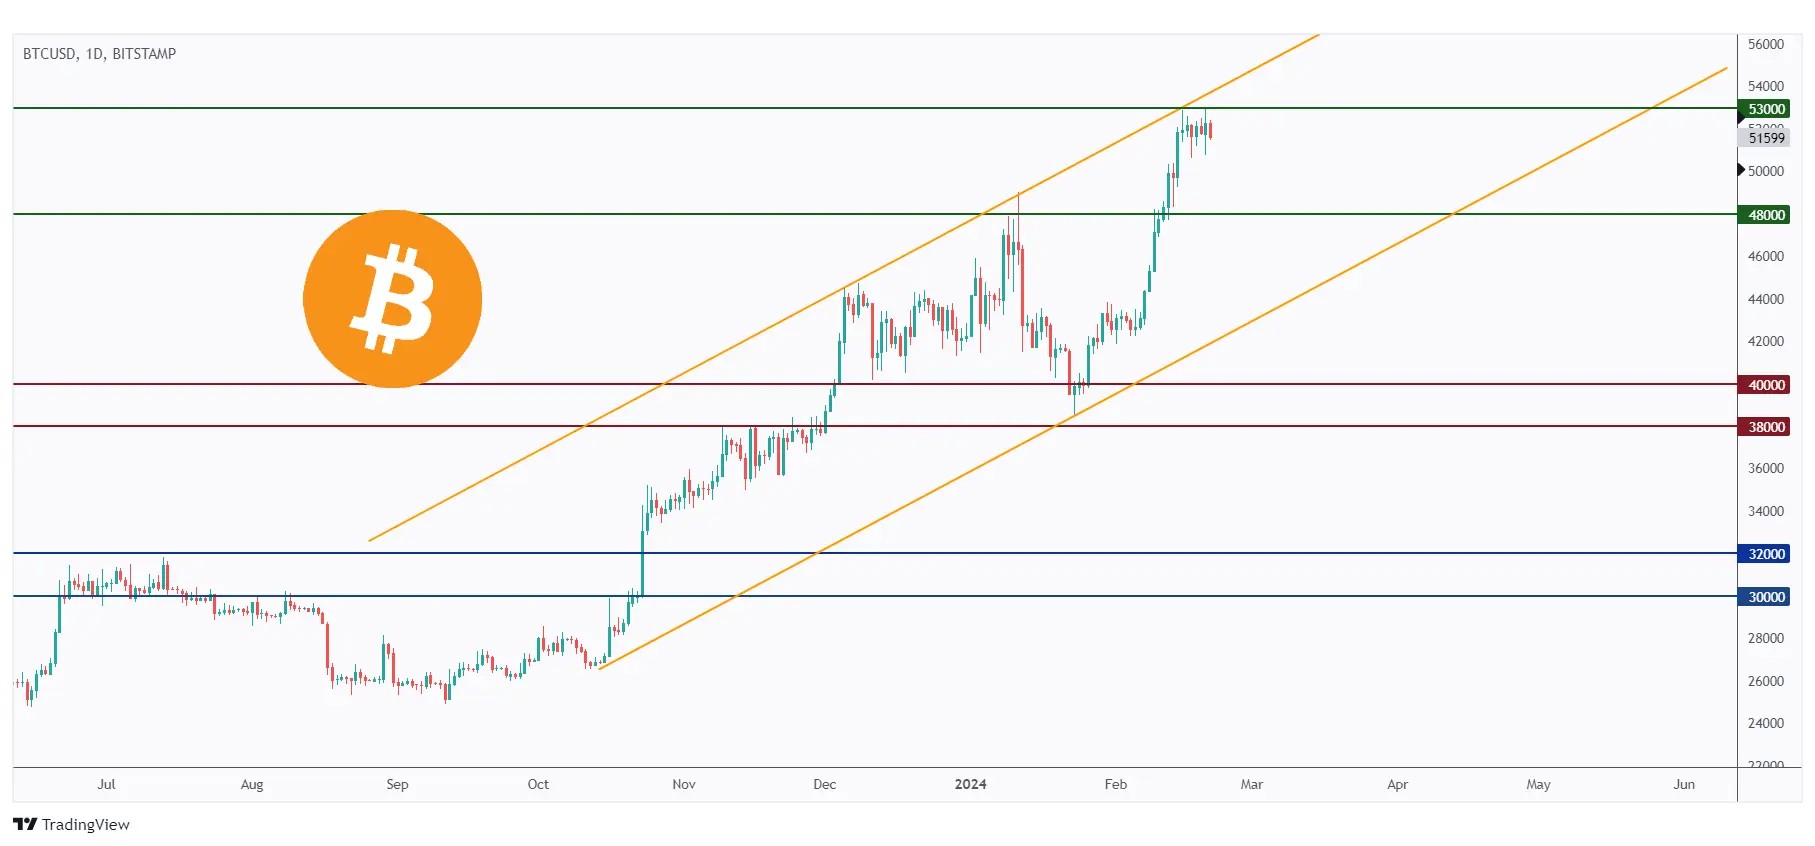
Following a 30% surge, BTC encountered rejection around the upper boundary of the orange channel and at $53,000.
For the bulls to maintain control, a breakout above the $53,000 level is necessary.
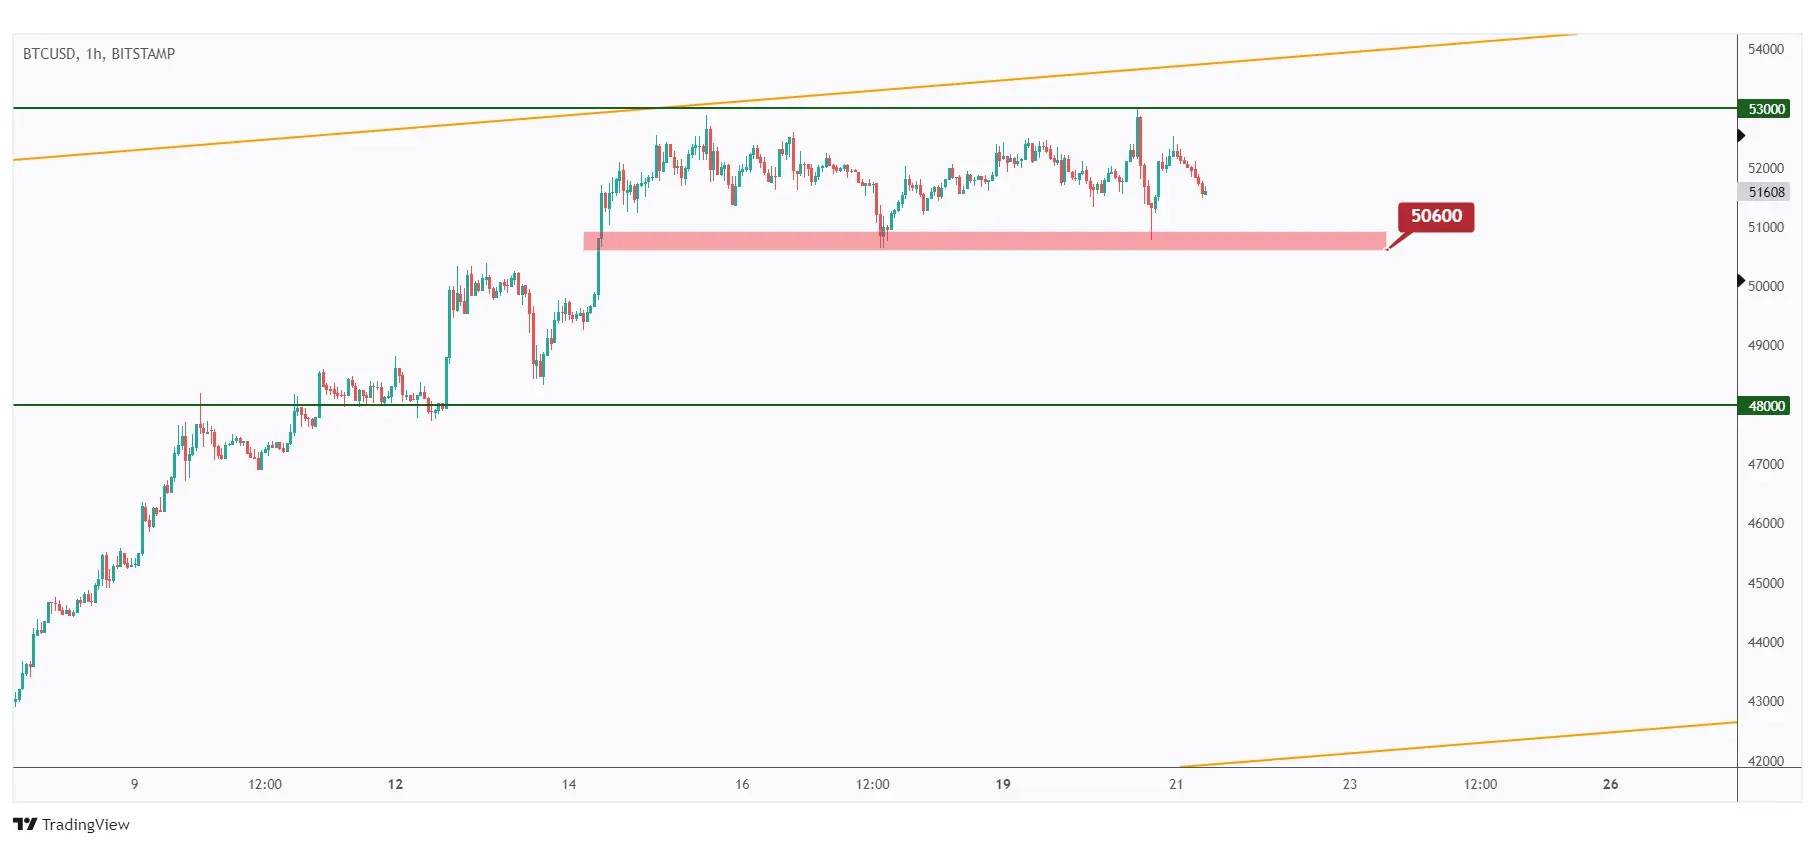
In the 1-hour timeframe, BTC has seen little activity, trading within a narrow range between $50,600 and $53,000.
The bulls will remain in control unless the last low marked in red at $50,600 is breached downward. In such a scenario, we anticipate a correction towards $48,000.
5 Altcoins Analysis
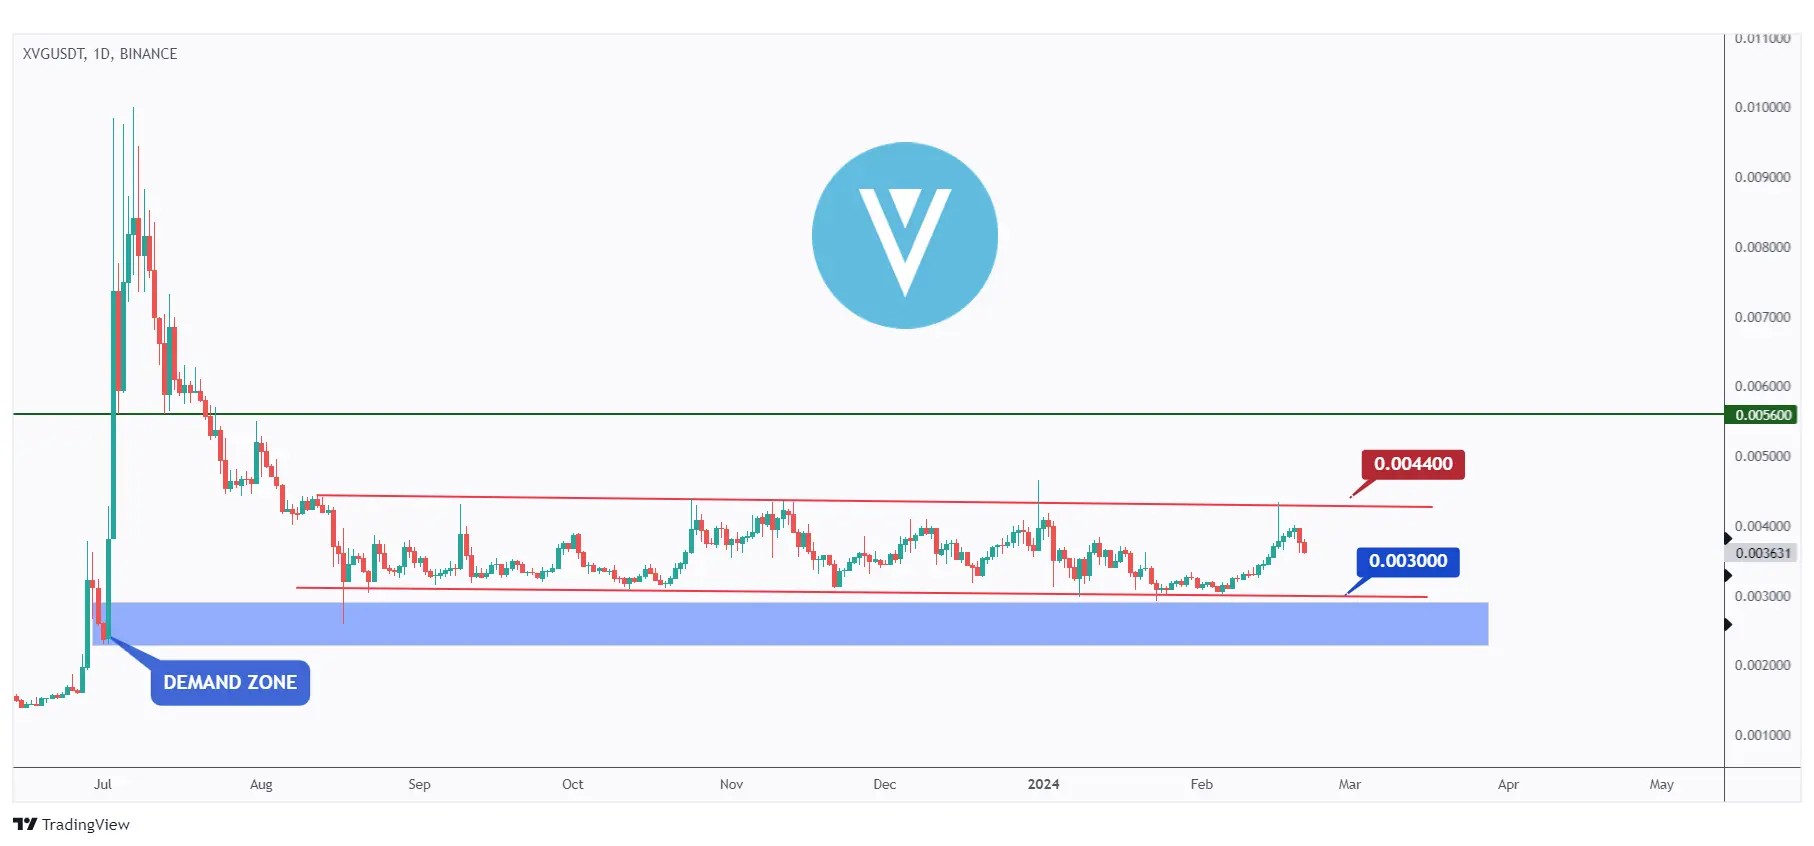
Let's start with XVG. It has been trading within a range between the $0.003 support and $0.0044 resistance.
This week, XVG bounced off the $0.003 support and traded higher.
For the bulls to maintain control and take over from a long-term perspective, a break above the $0.0044 resistance level is required.
Meanwhile, XVG can still trade lower to test the $0.003 where we will be looking for new short-term buy setups.
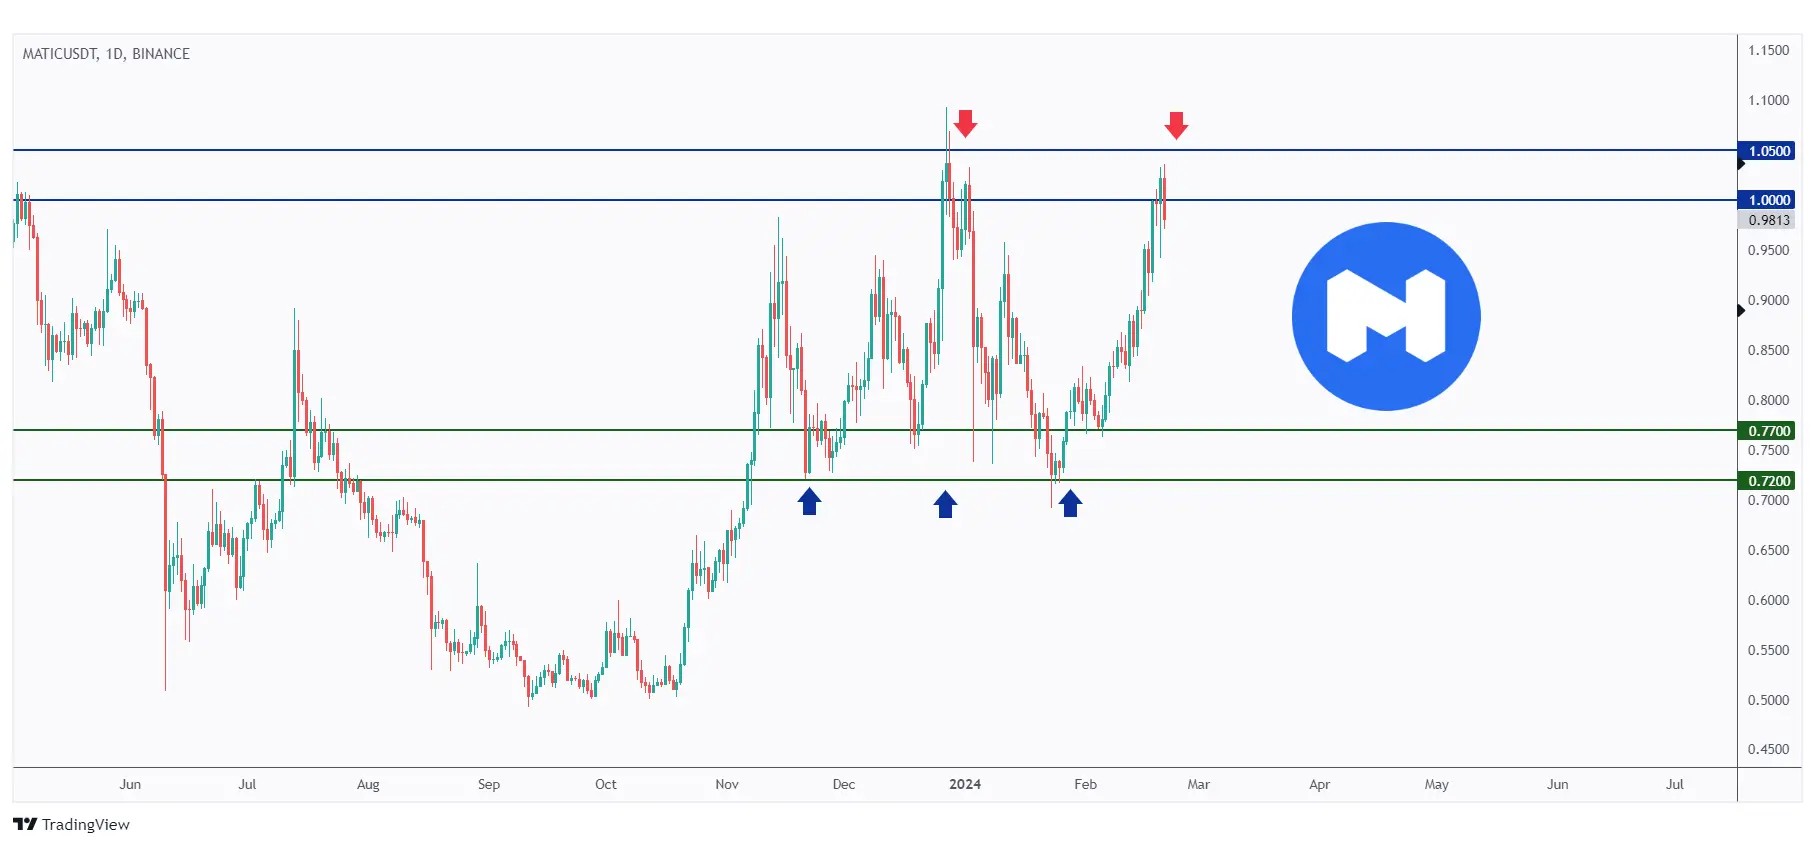
Turning our attention to MATIC. As per our previous analysis, MATIC rejected the $0.72 support and surged by 40%.
Currently, it is rejecting a major weekly resistance at $1.05.
To establish long-term bullish momentum, a breakout above the $1.05 is necessary.
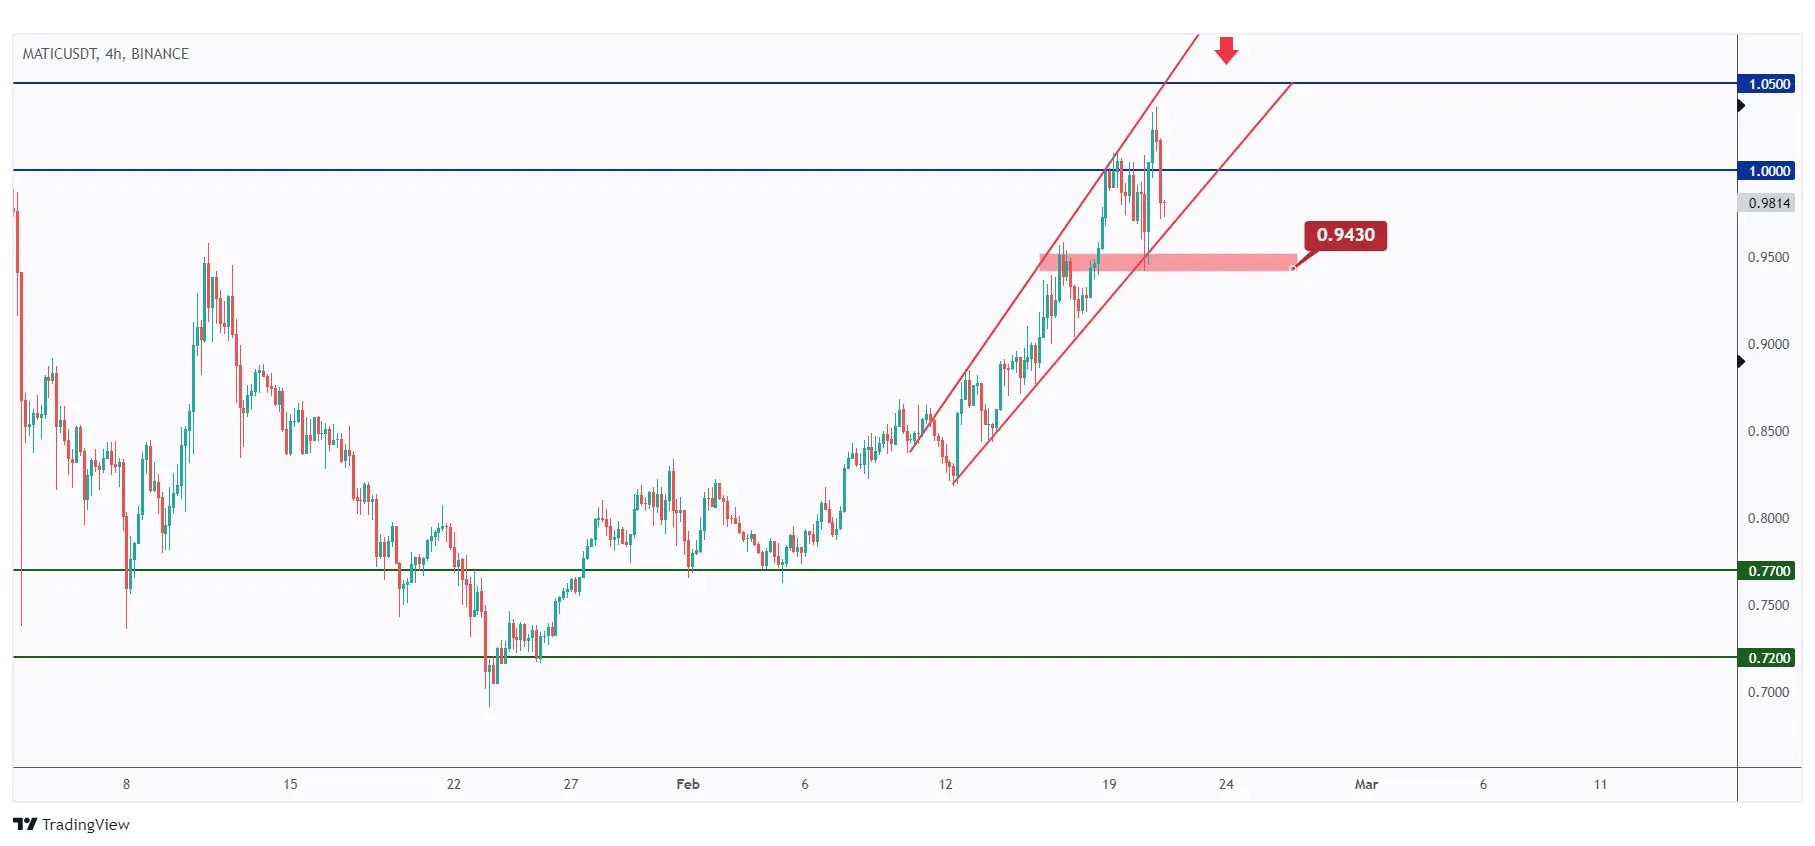
In the 4-hour timeframe, MATIC has been overall bullish, trading within the ascending channel highlighted in red.
The bulls are expected to maintain control, unless the previous major low marked in red at $0.943 is breached downward.
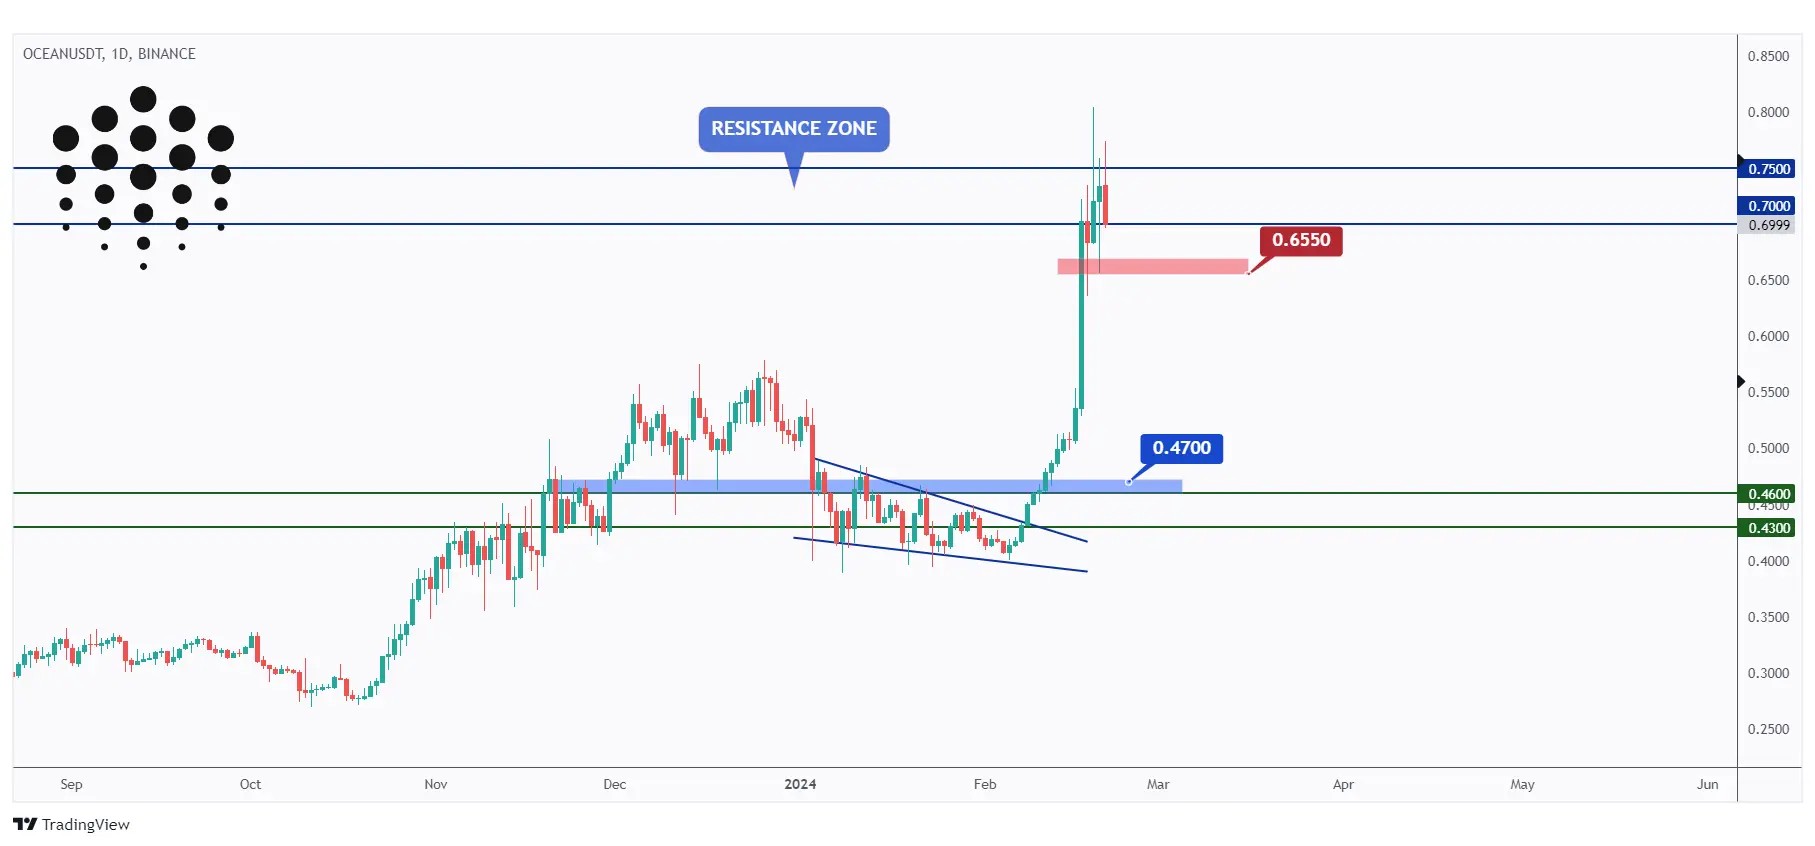
Next on the list for today is OCEAN. As per our previous analysis, OCEAN broke above the previous major high at $0.47 in blue and surged by 58% to reach our target at $0.7.
For the bulls to maintain control, a daily candle close above $0.75 is necessary.
In parallel, if the previous low at $0.655 in red is breached downward, we anticipate the start of a bearish correction towards the $0.55 support level.
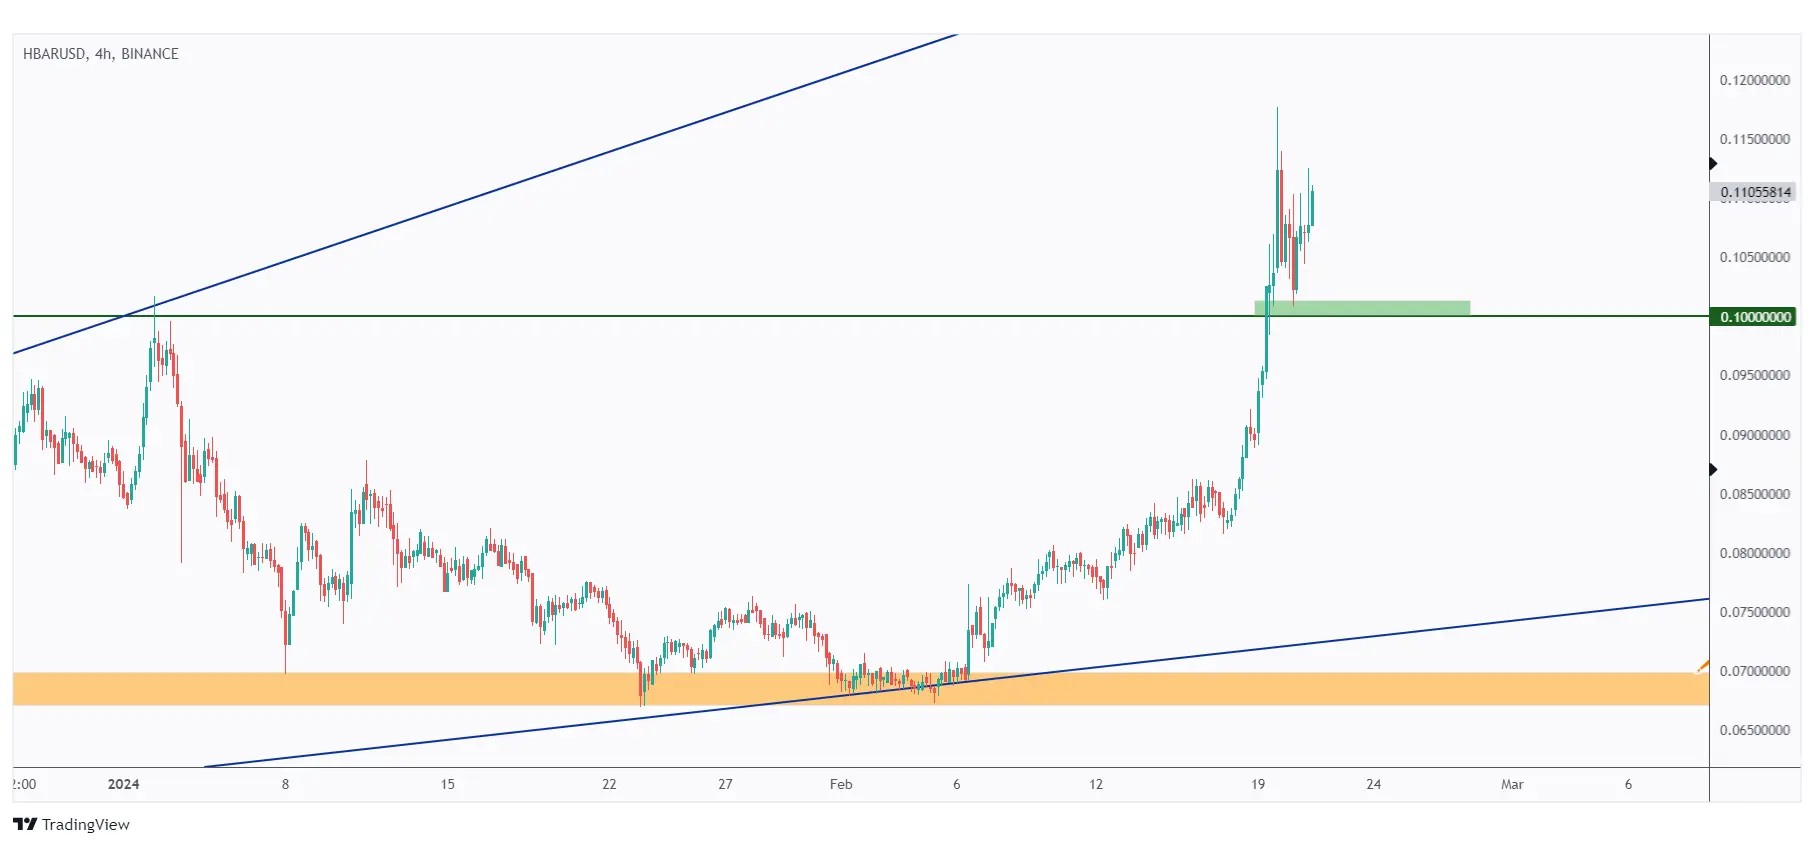
Analyzing HBAR, it rejected our anticipated $0.07 support zone and surged by an impressive 62%.
As long as the $0.1 support level holds, we anticipate a continuation towards $0.125.
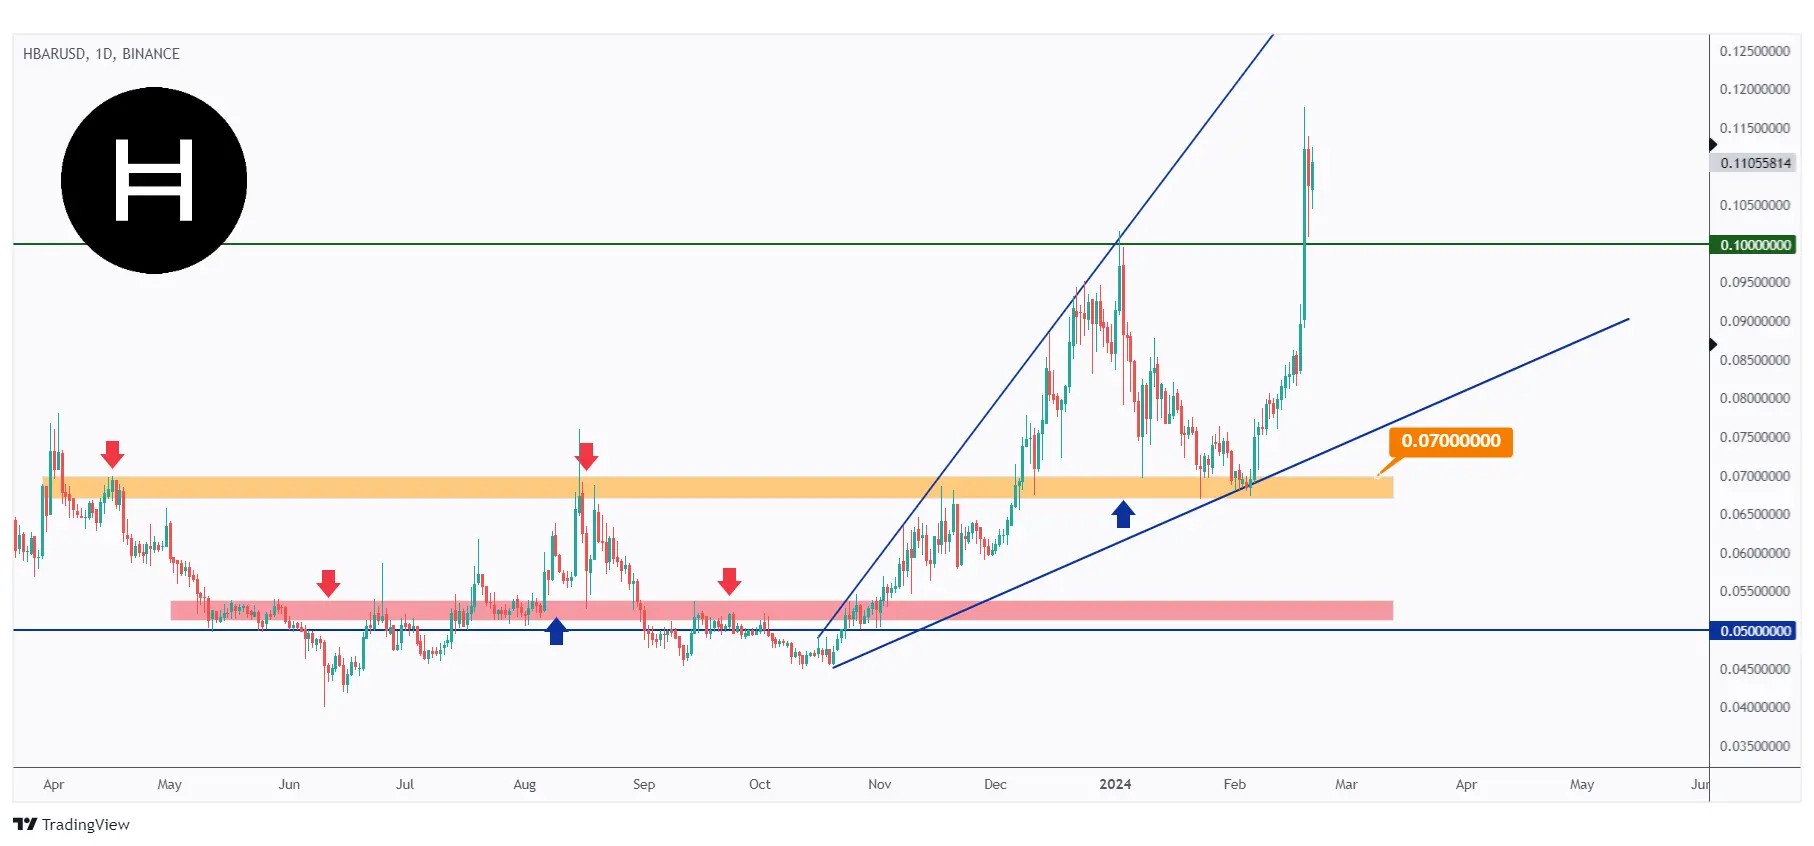
In parallel, if the $0.1 previous major low in green is breached downward, we anticipate a steep correction to commence, potentially resulting in a movement towards the $0.085 demand zone.
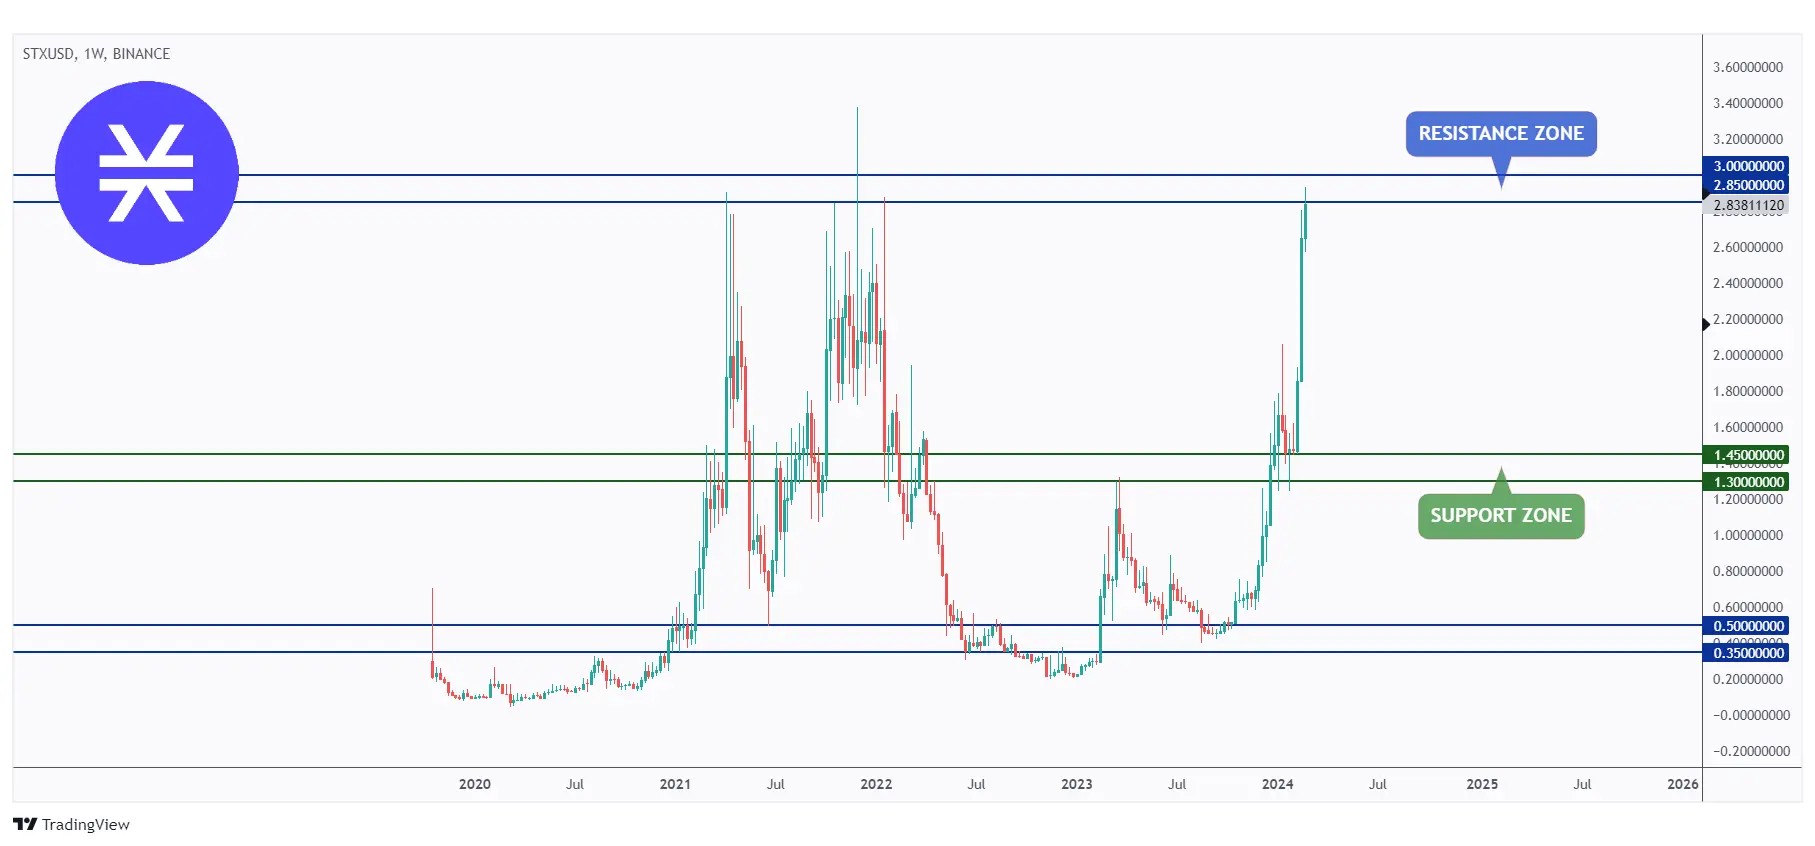
After breaking above the $1.45 resistance, STX surged by over 100%, making it one of the top performers of the month.
Currently, STX is hovering around its all-time high and the round number $3.
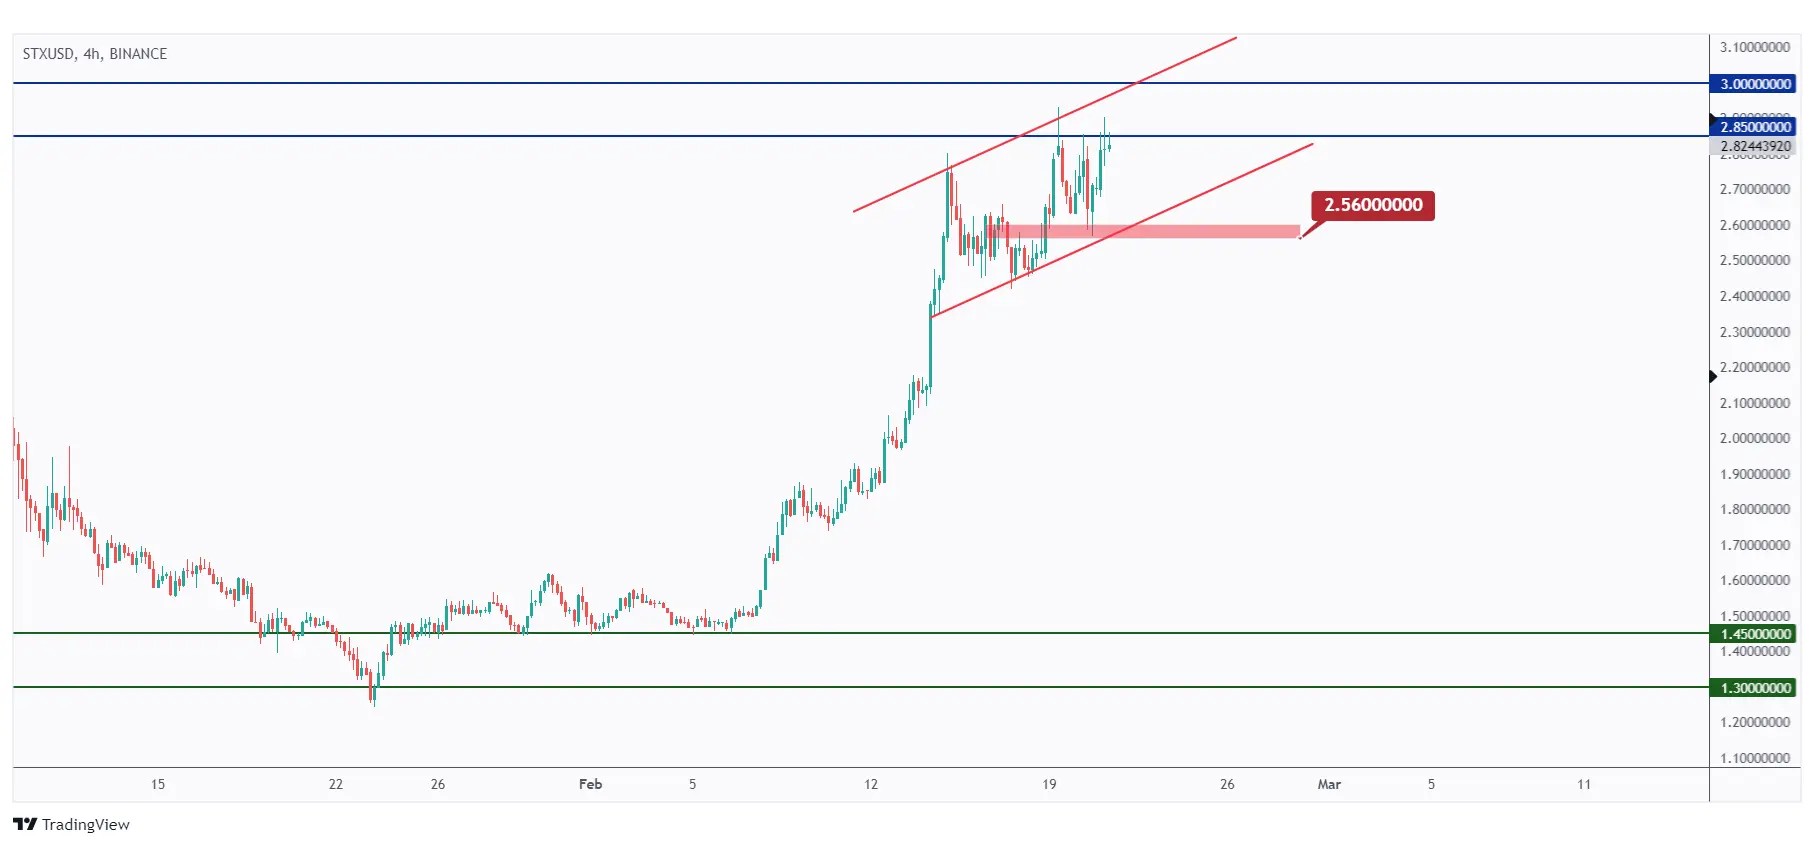
For the bulls to assume control from a macro perspective, a breakout above $3 is necessary.
In parallel, if the last major low at $2.56, marked in red, is breached downward, we anticipate a correction to start, potentially pushing STX towards the $2 round number and demand zone.
Quotes / Advices
To catch explosive movements in crypto, monitor market sentiment, news, and technical indicators closely.
Use tools like price alerts and volume analysis to identify sudden spikes. Keep an eye on social media chatter and trading forums for early indicators.
Implement stop-loss orders and set profit targets to manage risk and capitalize on rapid price changes.
And most importantly, regularly review and adapt your strategy to evolving market conditions.
Closing Remarks
In summary, this outlook begins with an evaluation of USDT.D, indicating a bullish sentiment if support holds, potentially impacting the broader cryptocurrency market negatively.
BTC experienced rejection at $53,000, but maintains control unless dropping below $50,600, with potential correction to $48,000.
Among altcoins, XVG and MATIC have seen recent rebounds, requiring breakouts for sustained bullish momentum.
OCEAN surged but needs to maintain above $0.75, while HBAR's surge awaits a hold above $0.1.
STX surged significantly but requires breakout above $3 to maintain control.