
elcome to another crypto market outlook for the 18th of February!
In this edition, we'll delve into major assets such as US500, DXY, Gold, Bitcoin, and Ethereum, highlighting critical levels and potential trade setups.
From Bitcoin breaking above $50,000 to Ethereum approaching $3000 and the Fear & Greed Index hitting new highs, this article covers it all.
Are you ready?
Today, we will cover the following topics:
- Market Heatmap and Fear and Greed Index
- US500, DXY and Gold Analysis
- USDT.D, Bitcoin and Ethereum Analysis
- Quotes / Advices
- Closing Remarks
Market Heatmap and Fear and Greed Index
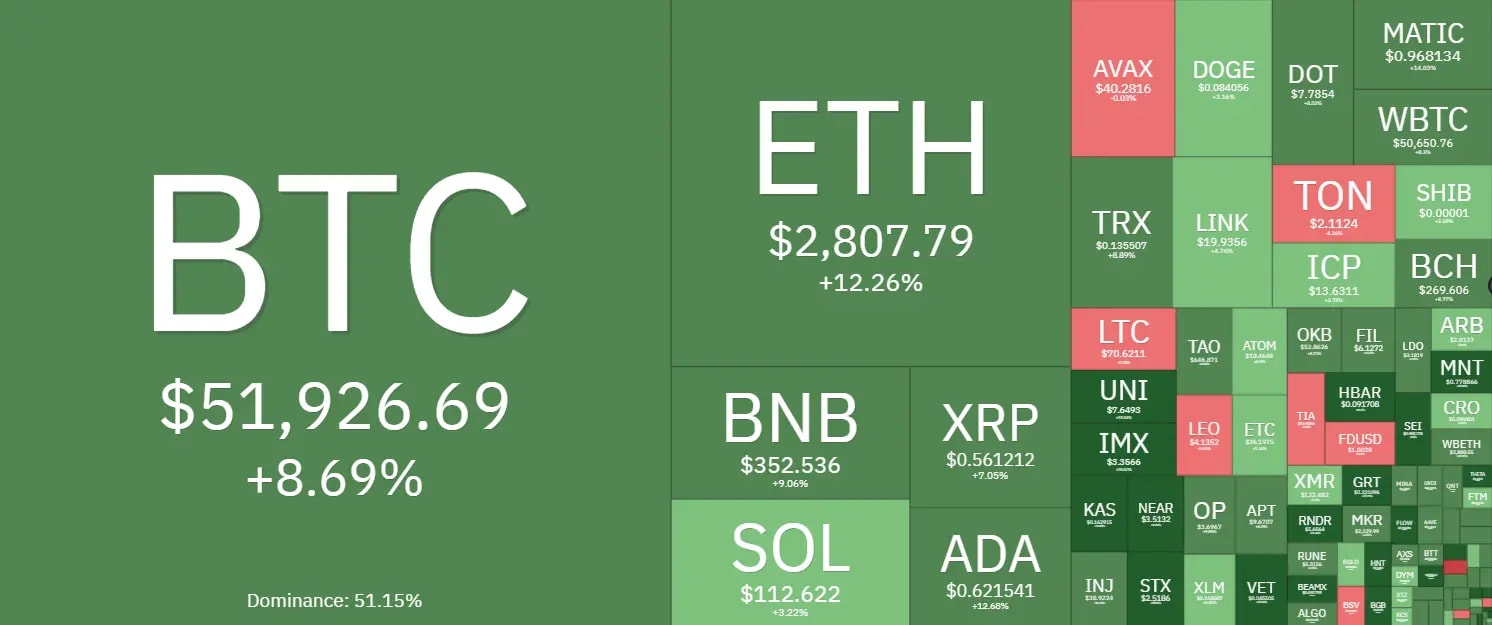
To initiate my research, I delved into the analysis by examining the market heatmap, which provided a comprehensive overview of the entire cryptocurrency market.
After breaking above the $48,000 resistance zone, BTC surged by 8.69%, dragging the entire crypto market up with it.
On the heatmap, we can clearly see that almost all altcoins ended the week with massive gains, including ETH, which is up by 12.26%.
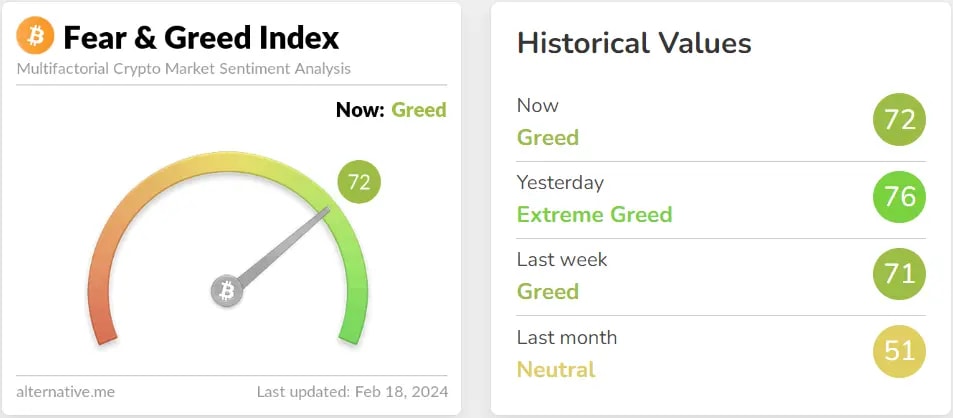
The Fear & Greed Index has consistently signaled "Greed" throughout the entire week, particularly in the last two days, as the meter reached new highs at 76. This indicates that traders are optimistic, likely influenced by the approval of Bitcoin ETFs and anticipation of the upcoming halving.
US500, DXY and Gold analysis
We consistently monitor the US500 index to assess the current market sentiment. This practice is crucial because the cryptocurrency market often exhibits a significant correlation with the stock market, and this interconnection can impact its fluctuations.
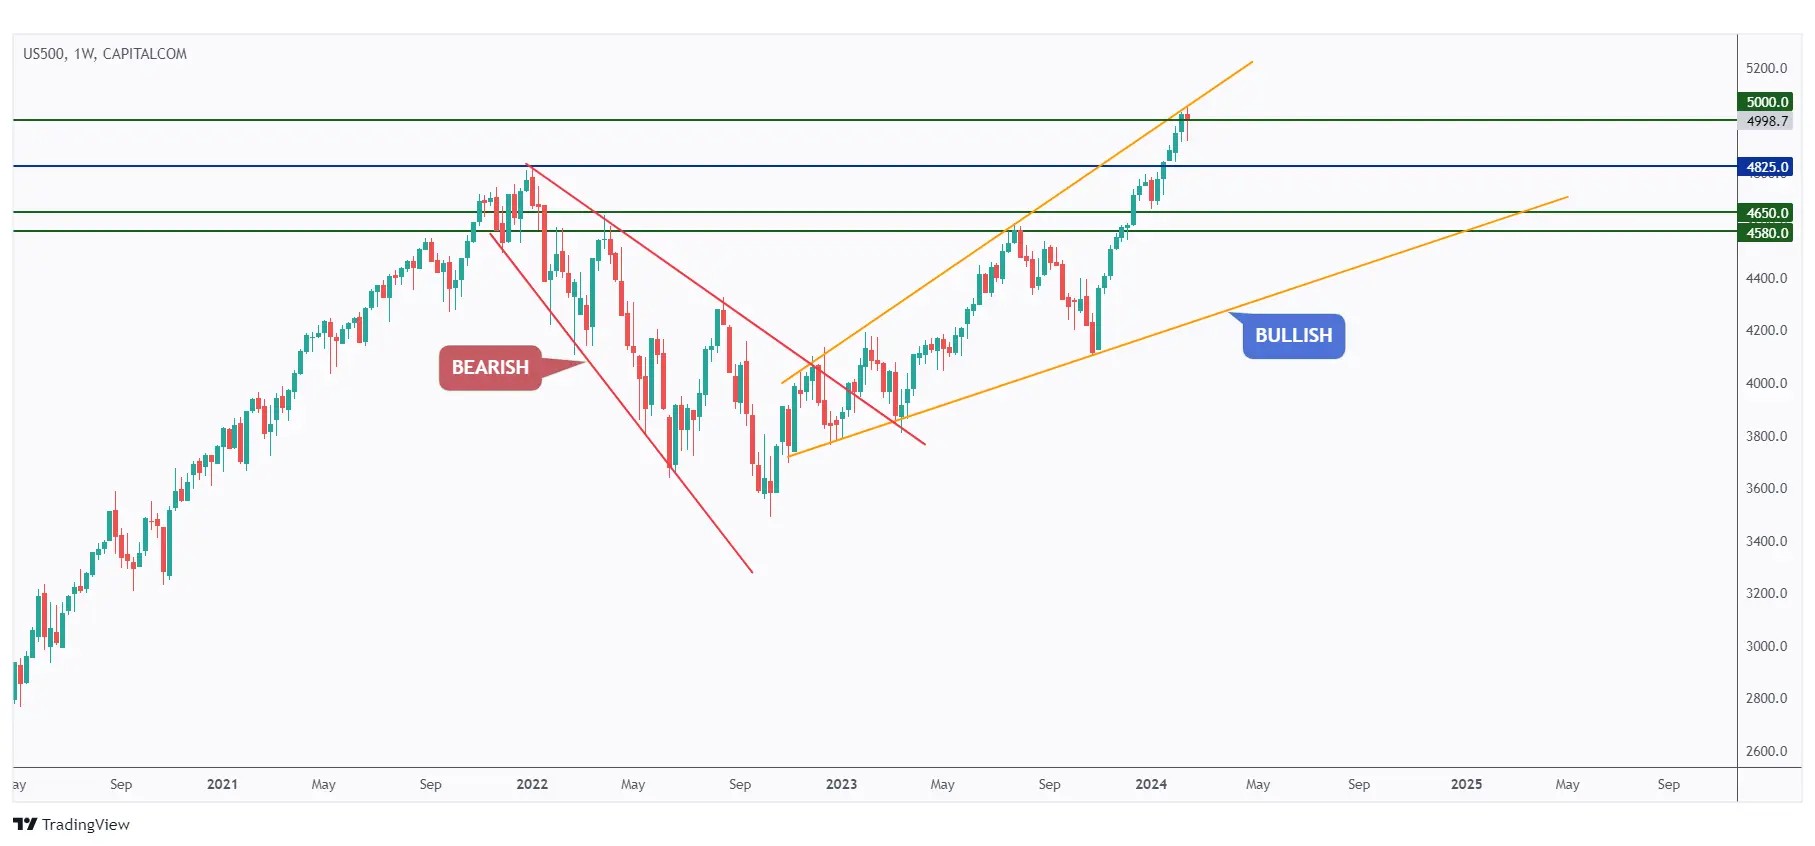
The US500 is currently hovering around the upper boundary of the orange wedge pattern and the new all-time high of $5000.
As long as this resistance holds, there is potential for the bears to kick in soon, possibly initiating a correction.
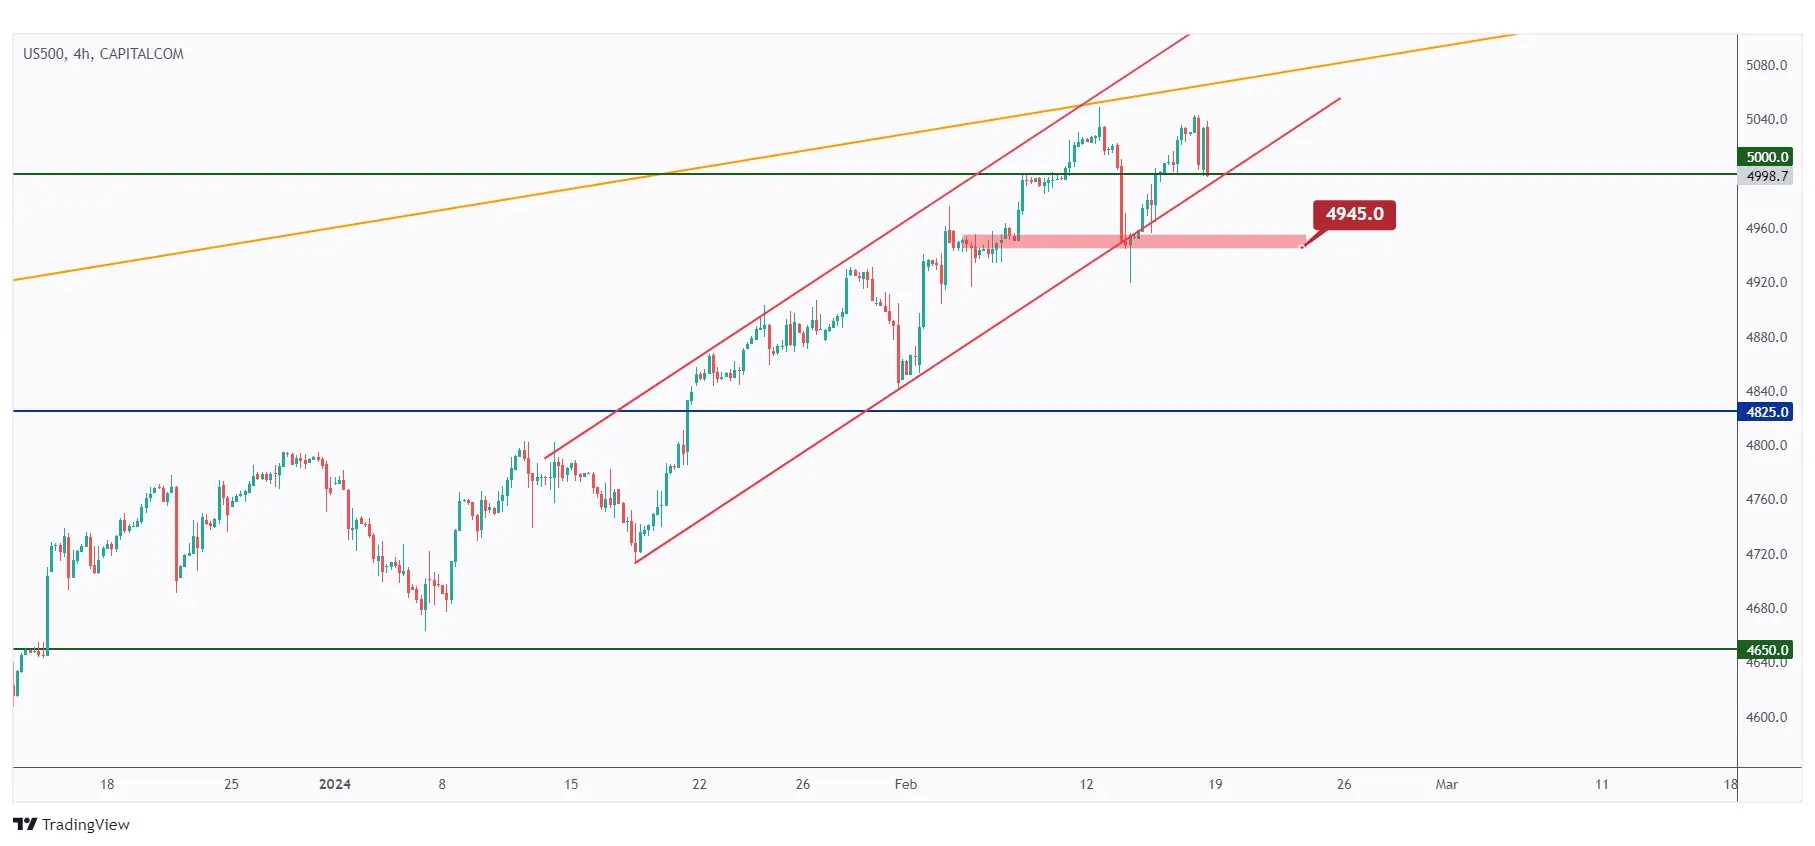
In the 4-hour timeframe, the bulls will remain in control as long as trading remains within the rising channel highlighted in red.
However, if the $4945 low is breached downward, a correction is expected, possibly resulting in a movement towards the $4850 demand zone.
We consistently monitor the DXY - USD Index as part of our routine analysis. This is crucial because the value of nearly all assets, including BTC/USD, is closely tied to the USD, which serves as the benchmark currency in the financial market.
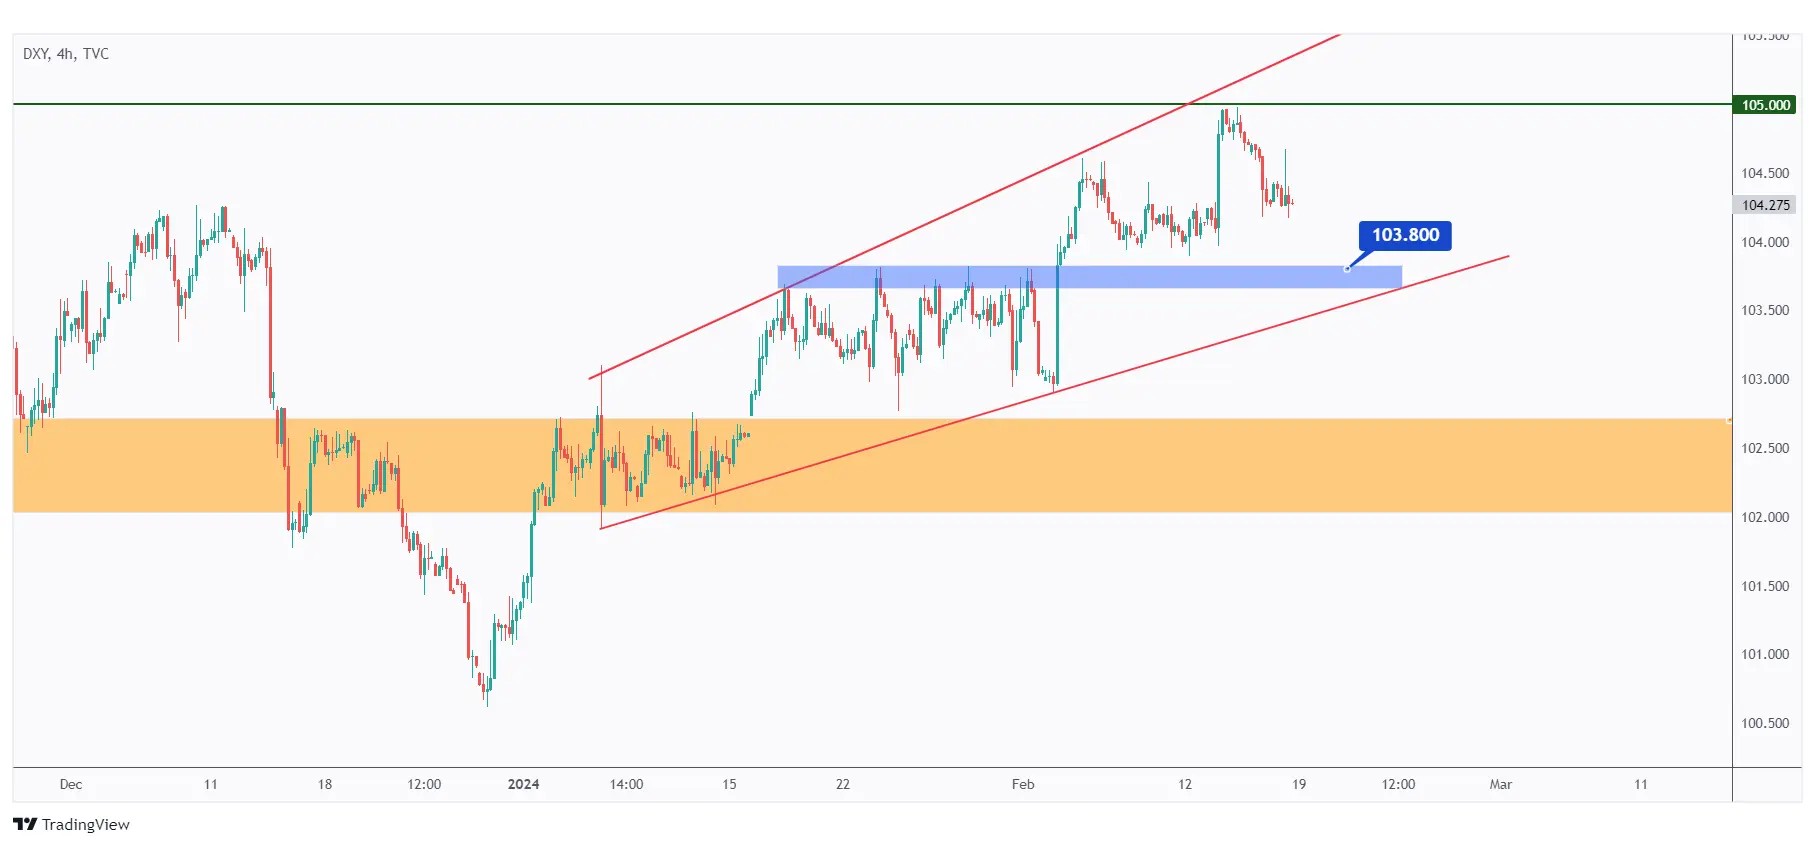
As anticipated in our previous article, DXY has rejected the $105 resistance and is presently trading lower.
Currently, DXY is undergoing a correction phase and is approaching the previous structure at $103.8. Therefore, we will be looking for trend-following buy setups on lower timeframes.
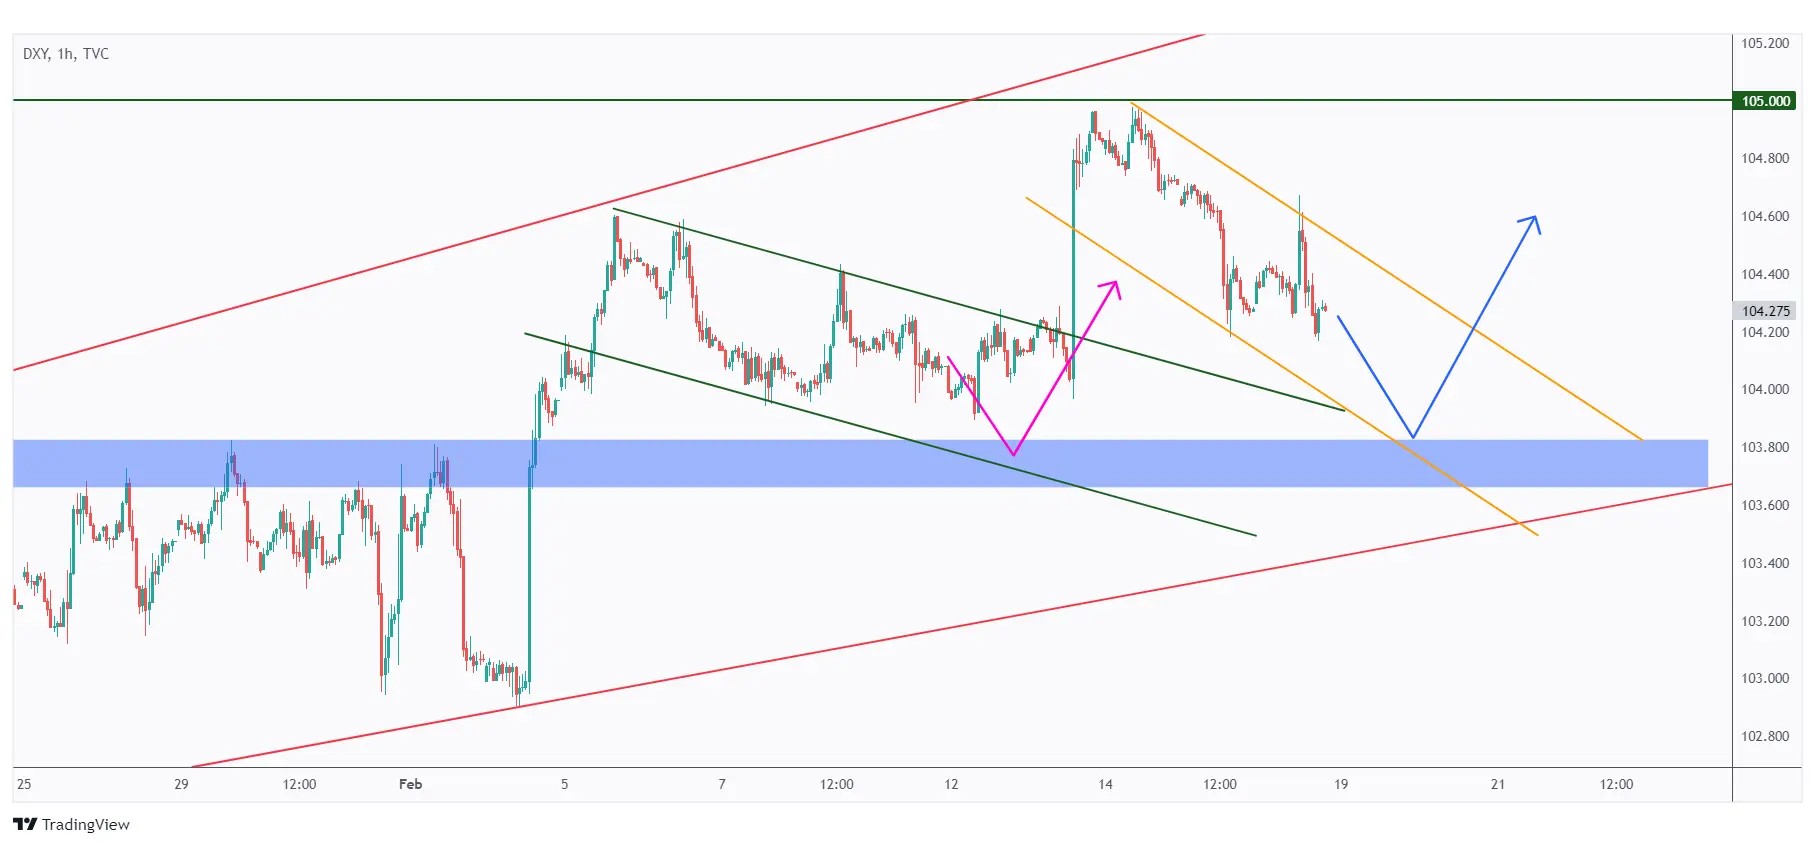
In the 1-hour timeframe, DXY broke above the green channel and traded higher to reach our target at $105.
Currently, DXY is trading within a similar falling channel highlighted in orange.
For the bulls to take control and initiate the next upward impulse movement, we require a breakout above the upper orange trendline.
Meanwhile, DXY could remain bearish in the short term and might continue to trade lower to test the blue structure and lower trendline in orange.
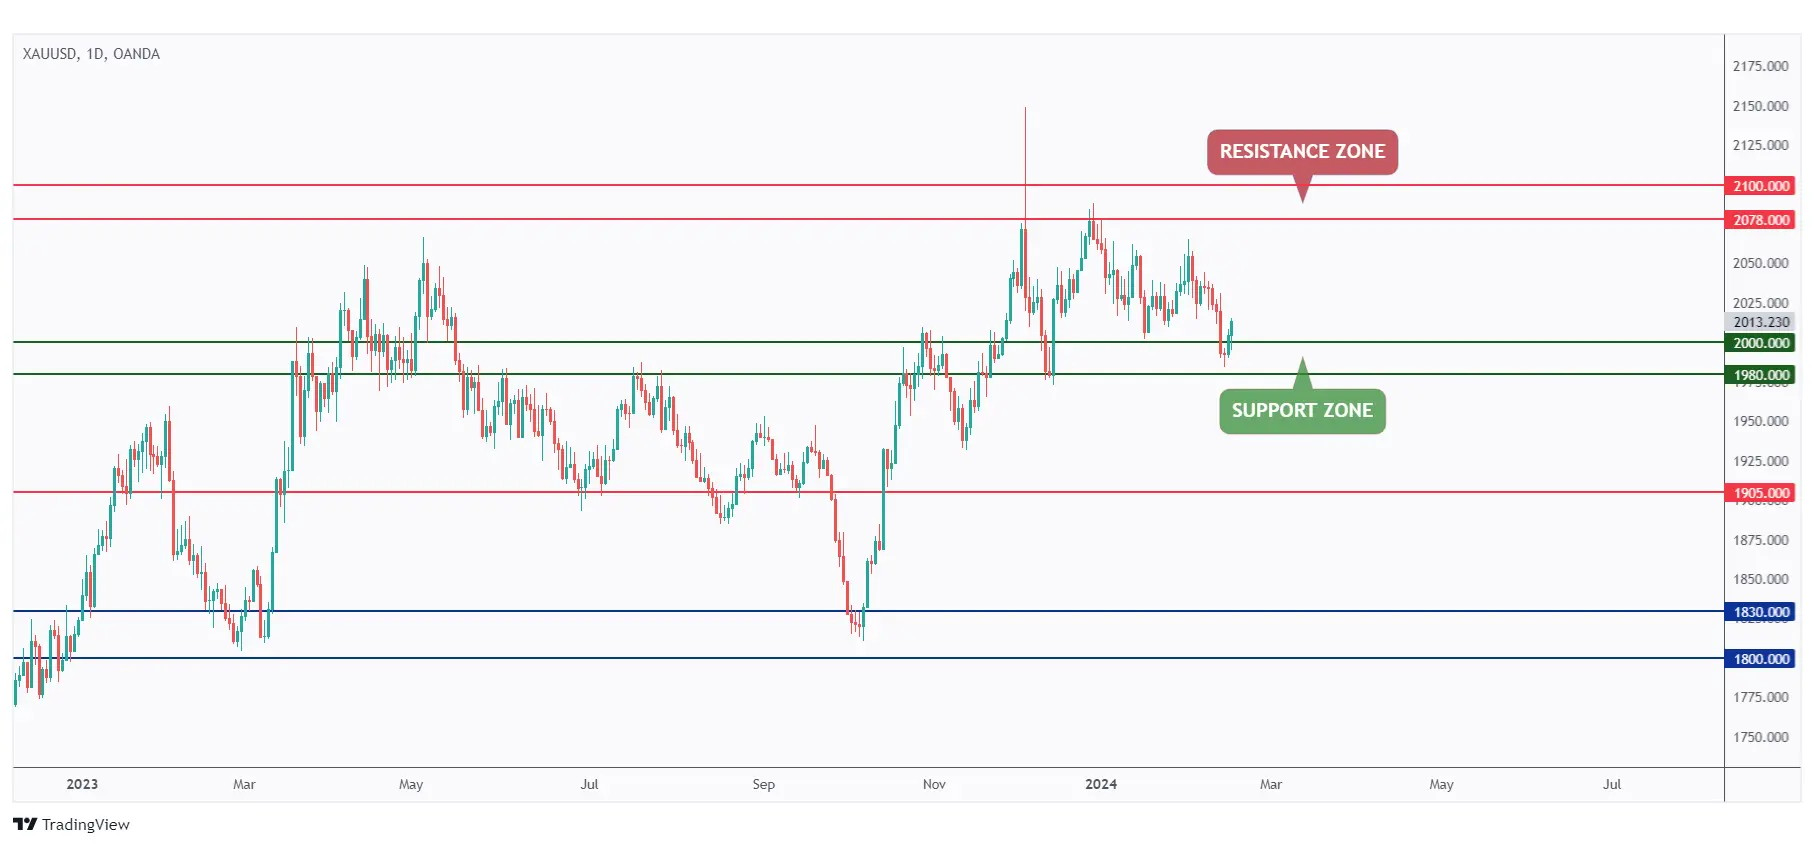
As expected, Gold rejected our $1980 - $2000 support zone and is currently trading higher.
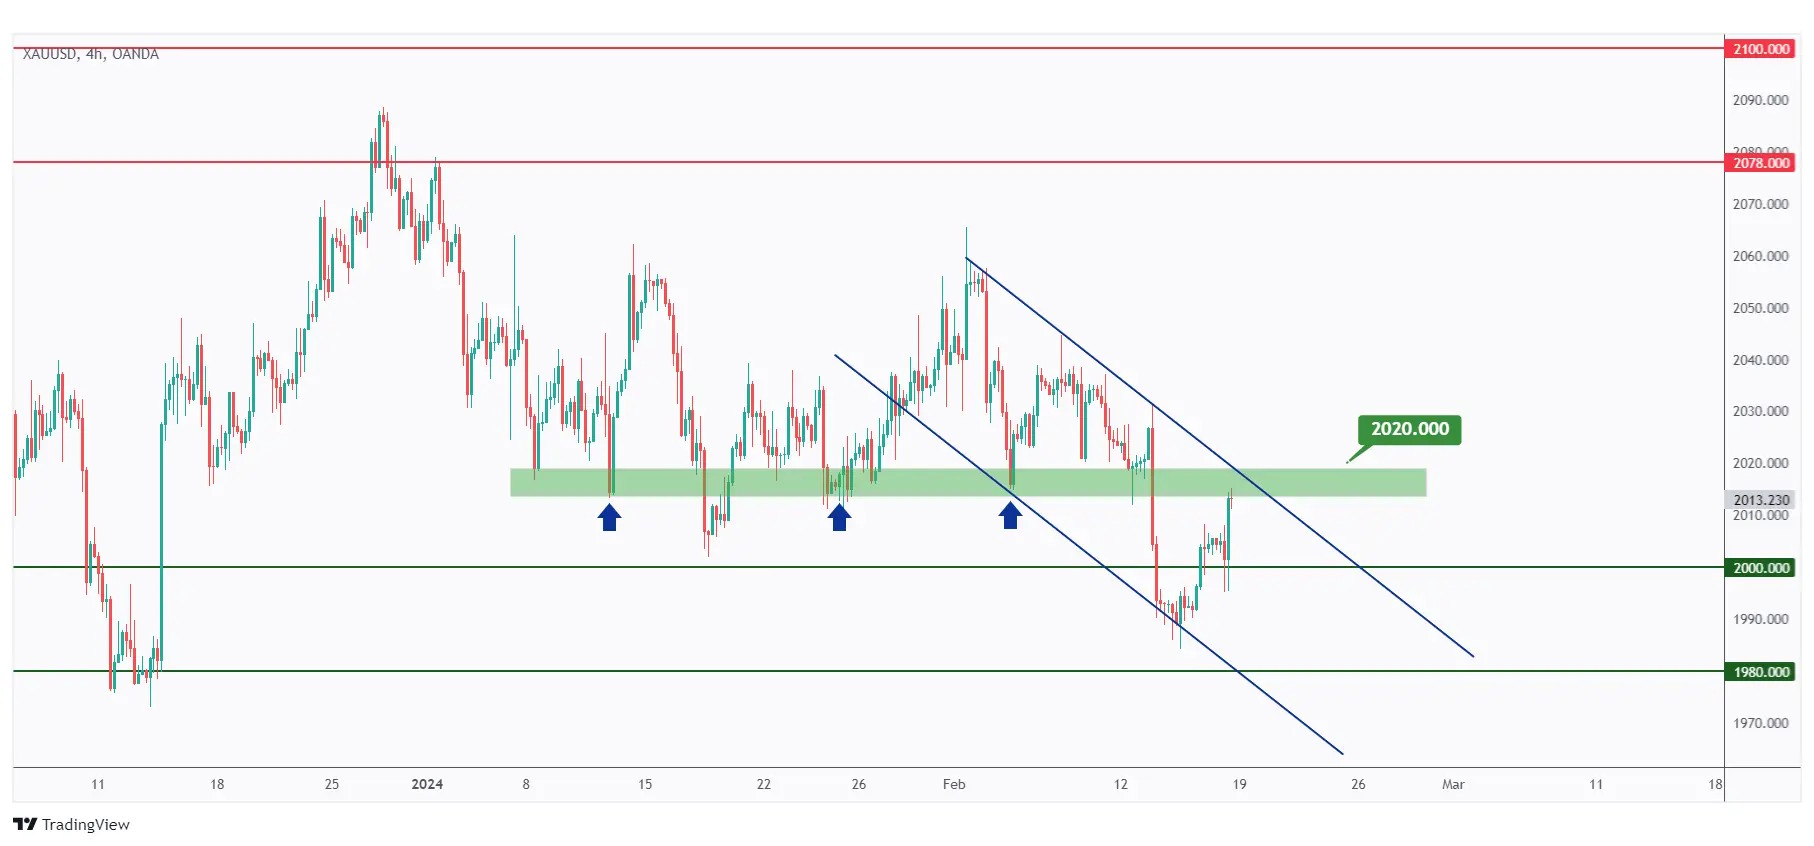
In the 4-hour timeframe, Gold is approaching the upper blue trendline and a strong structure highlighted in green.
For the bulls to remain in control and take over from a medium-term perspective, a breakout above $2020 is necessary.
However, Gold may continue to trade lower and could potentially retest the support once more.
USDT.D, Bitcoin and Ethereum analysis
As a standard practice, I commence my analysis with USDT.D as it serves as a crucial indicator of traders' sentiment. USDT.D offers valuable insights into whether traders are optimistic, signaling increased investment in cryptocurrencies, or pessimistic, indicating a shift towards stablecoins.
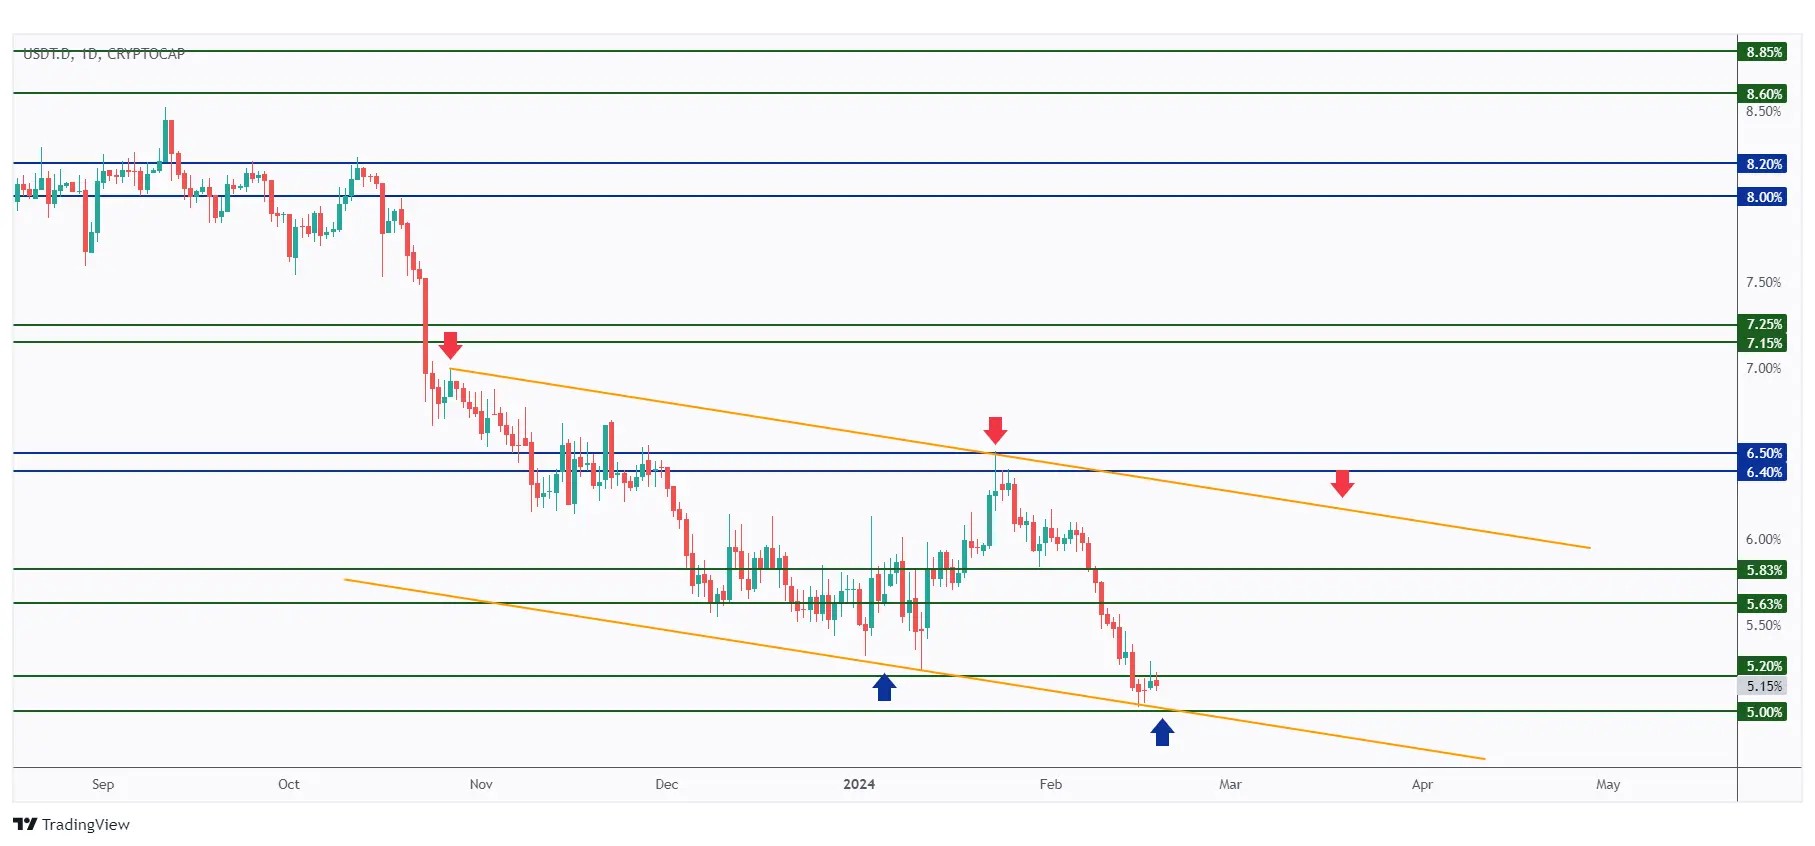
USDT.D has seen little activity this week, maintaining its position around the 5% - 5.2% support zone.
As long as the 5% support holds, we anticipate the bulls to kick, which would have a negative impact on the overall sentiment in the crypto market.
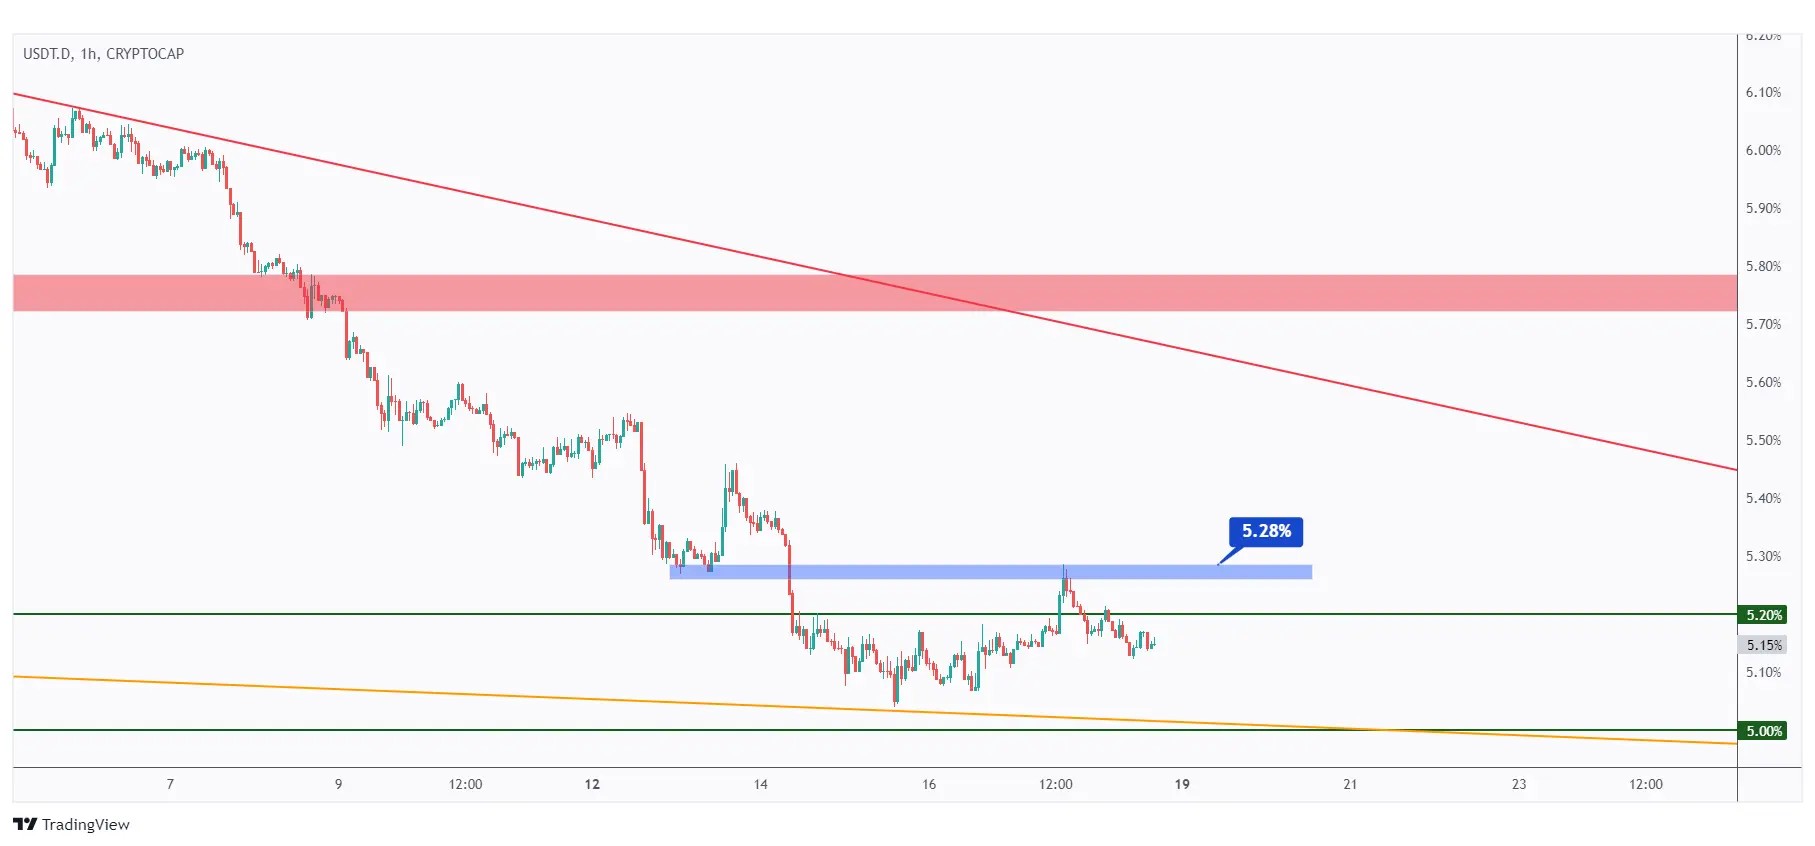
In the 1-hour timeframe, for the bulls to take control, a break above the last major high at 5.28% is required.
In this scenario, we would expect a movement towards the upper red trendline and the 5.5% structure.
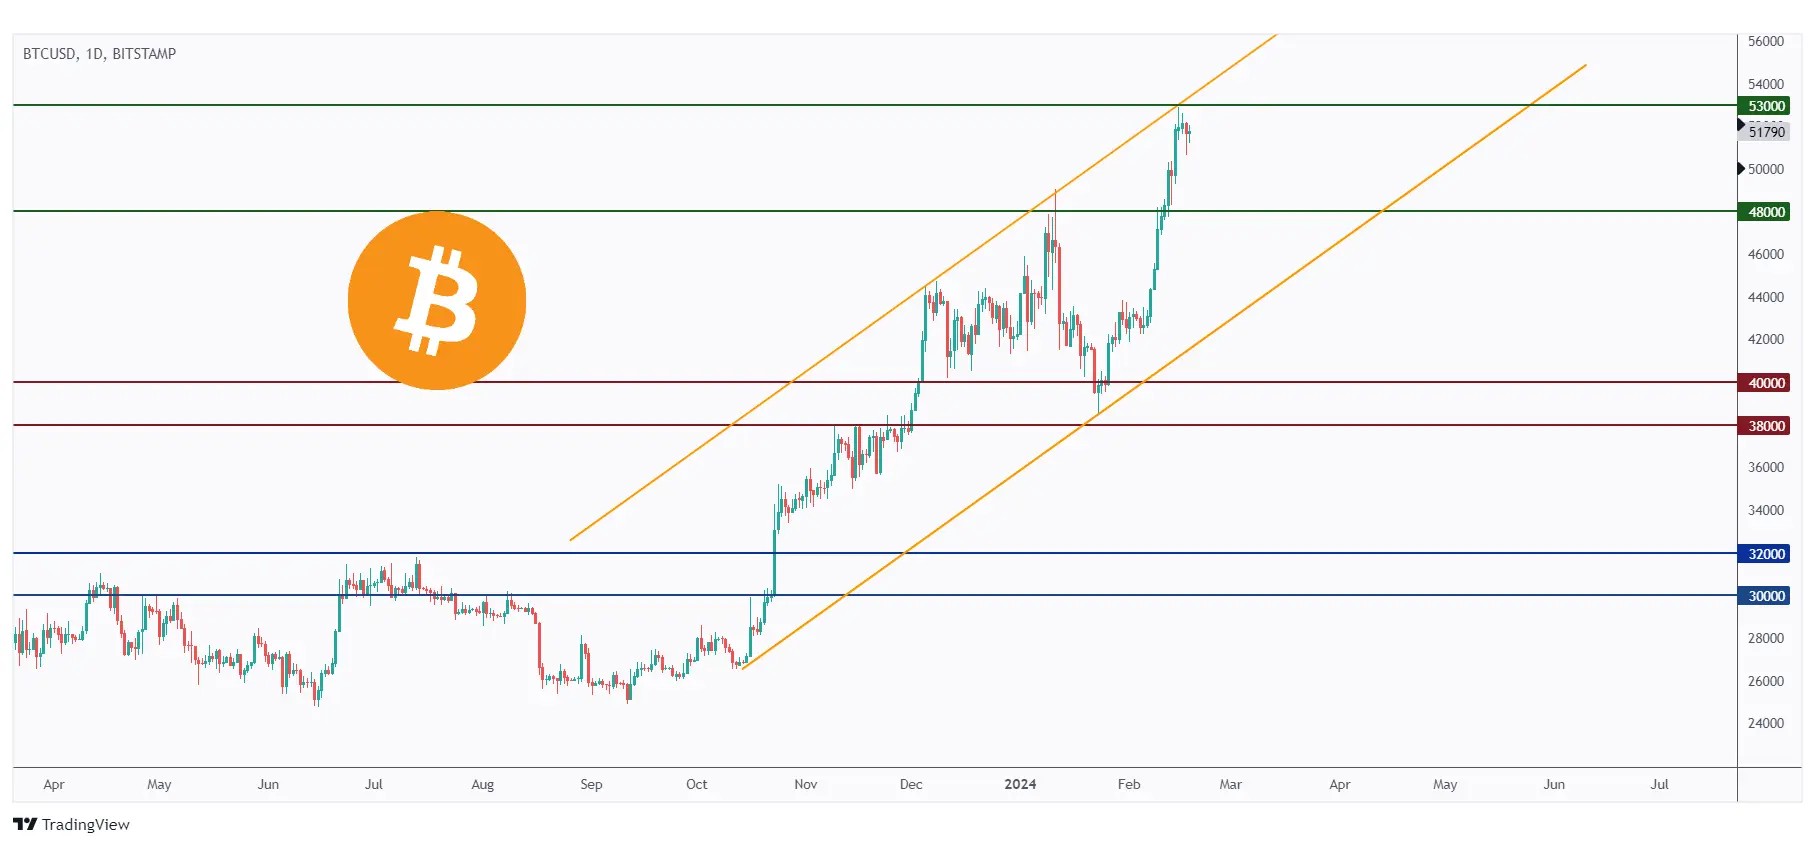
As per our previous analysis, BTC broke above the previous major high at $48,000 and continued to trade higher.
For the bulls to remain in control, a breakout above the $53,000 mark is needed.
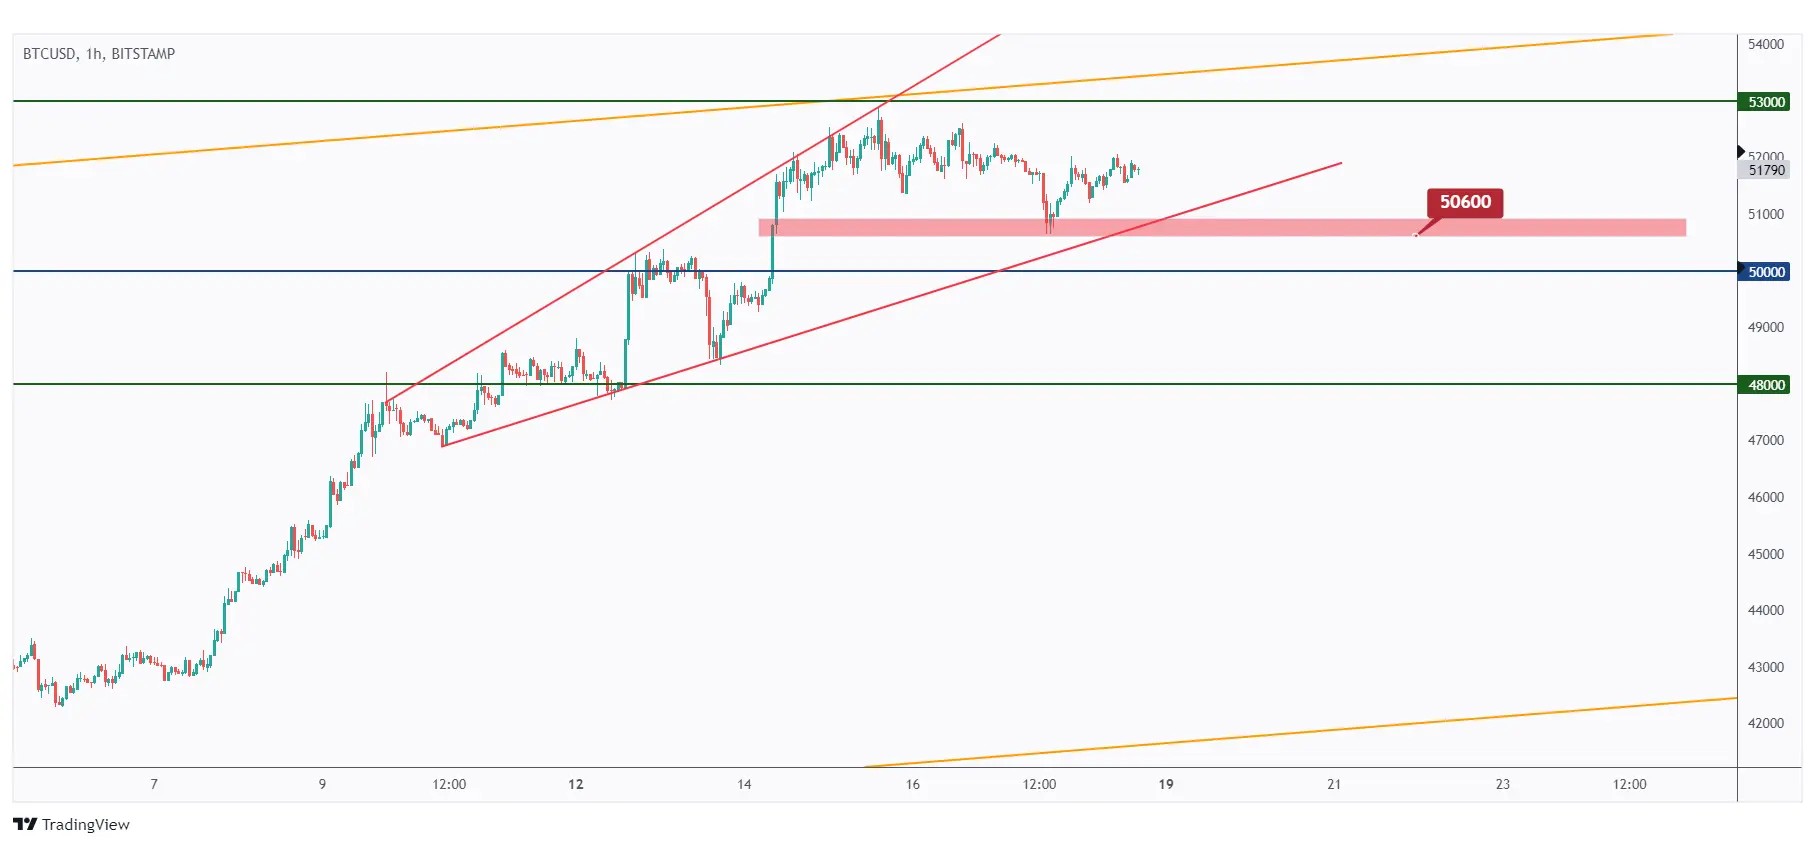
In parallel, for the bears to take control and initiate the correction phase, a break below the lower red trendline and last major low highlighted in red at $50,600 is required.
In such a scenario, a movement towards the red trendline and the $48,000 structure would be anticipated.
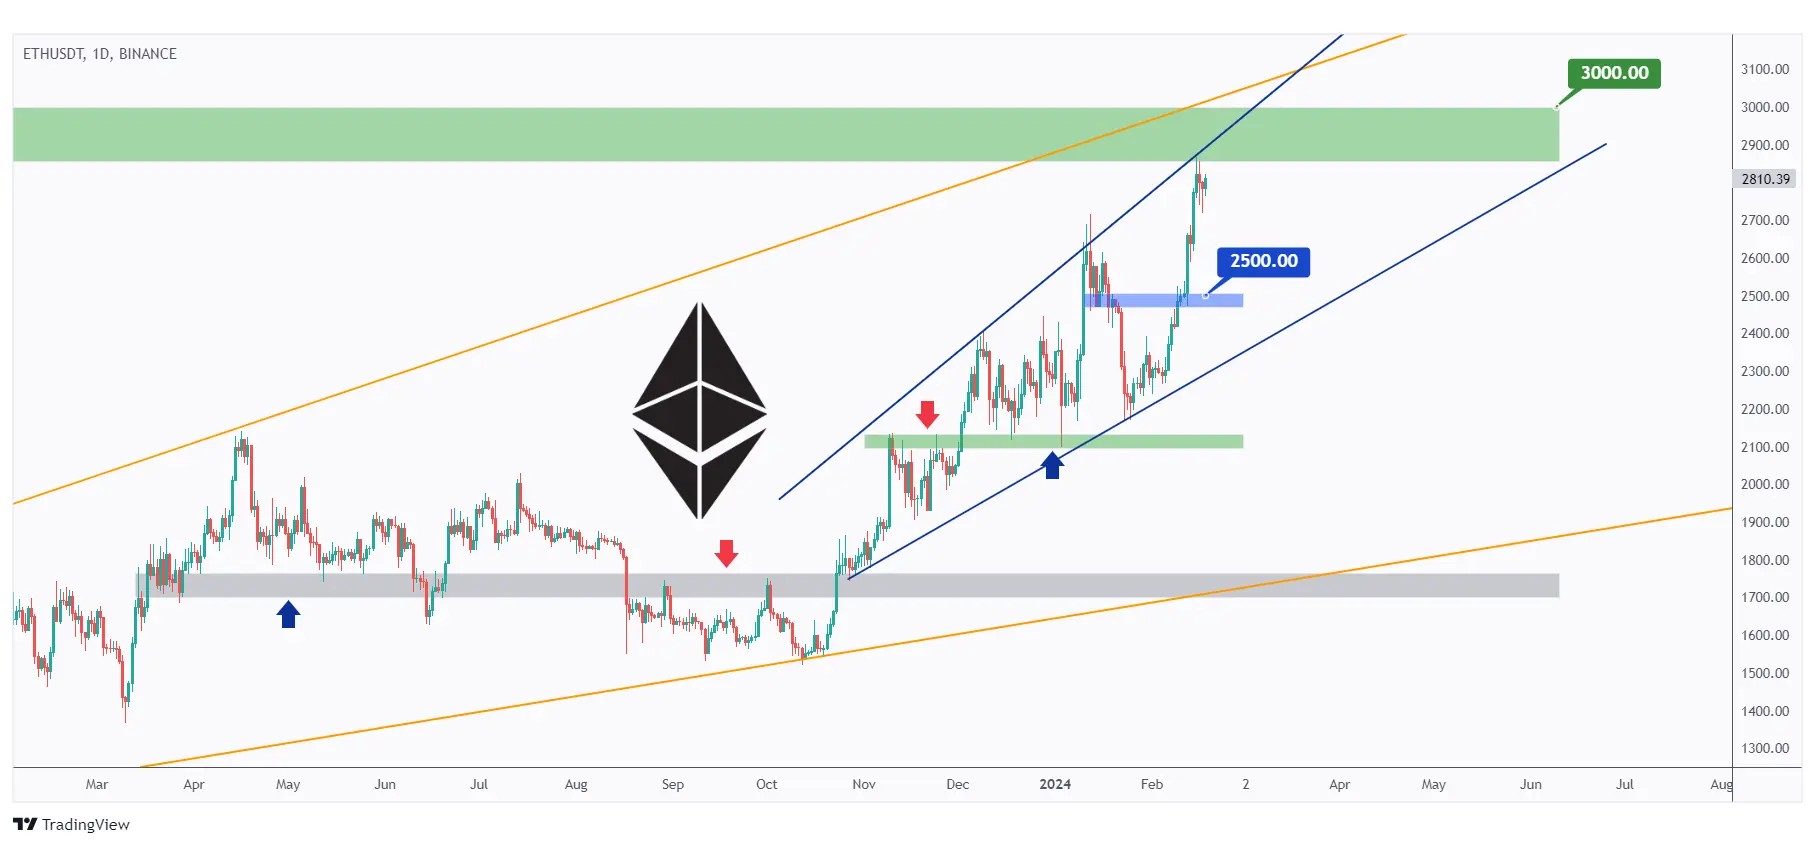
After breaking above the $2500 round number, ETH continued to trade higher and is currently approaching a strong resistance zone around $2850 - $3000.
To maintain control from a long-term perspective, the bulls require a breakout above $3000.
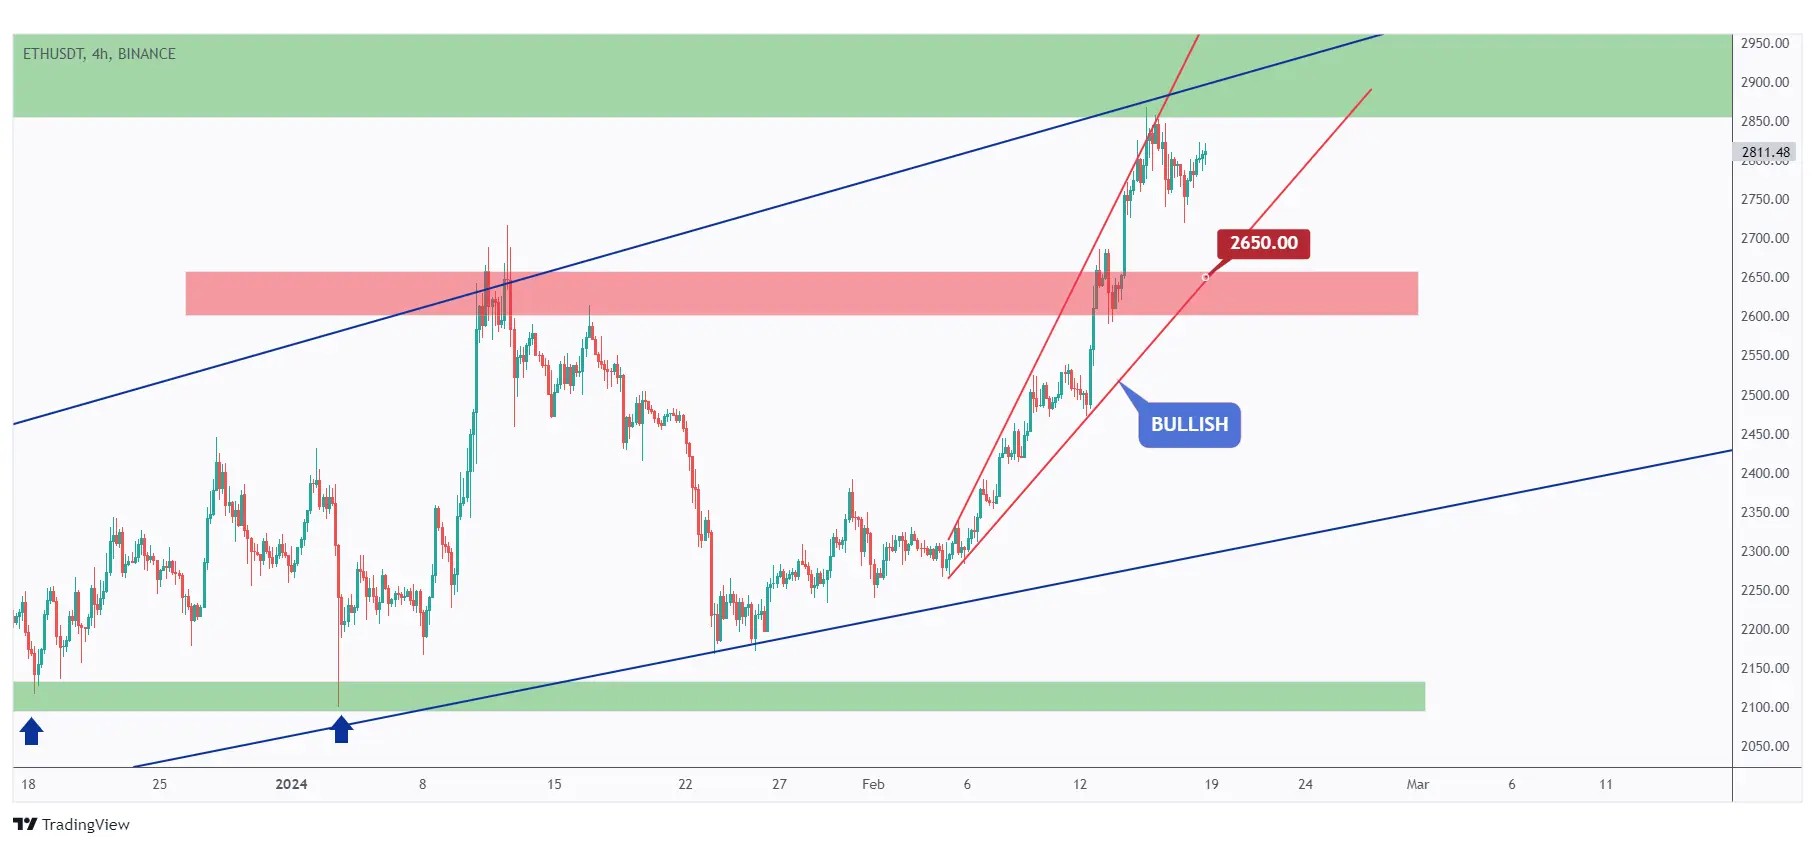
In the 4-hour timeframe, ETH would maintain an overall bullish outlook unless the lower red trendline and zone are broken downward.
Meanwhile, as ETH approaches the $2650 red structure, we will be looking for trend-following buy setups on lower timeframes.
Quotes / Advices
Trading resembles driving as both involve navigating through various conditions with skill and caution.
In trading, like on the road, individuals must anticipate changes, react swiftly to obstacles, and adjust their course accordingly.
Both activities require attention to detail, adherence to rules, and the ability to make split-second decisions.
Just as drivers monitor traffic signals and adjust speed, traders analyze market indicators and adjust positions to navigate towards their financial goals effectively.
Closing Remarks
In summary, the heatmap indicates significant gains in cryptocurrencies, particularly Bitcoin (BTC) surpassing $48,000 and driving the market up. Ethereum (ETH) and other altcoins also saw notable increases.
The Fear & Greed Index reflects trader optimism.
Monitoring US500 and DXY indices is essential due to their correlation with crypto markets.
Gold rebounds but faces resistance around $2020.
Analysis of USDT.D, BTC, and ETH suggests potential bullish trends, contingent upon surpassing key resistance levels. For BTC, maintaining control requires staying above $53,000, while ETH eyes resistance at $3000.