
s we wrap up the week, here's a brief overview of the key technical developments in the crypto market.
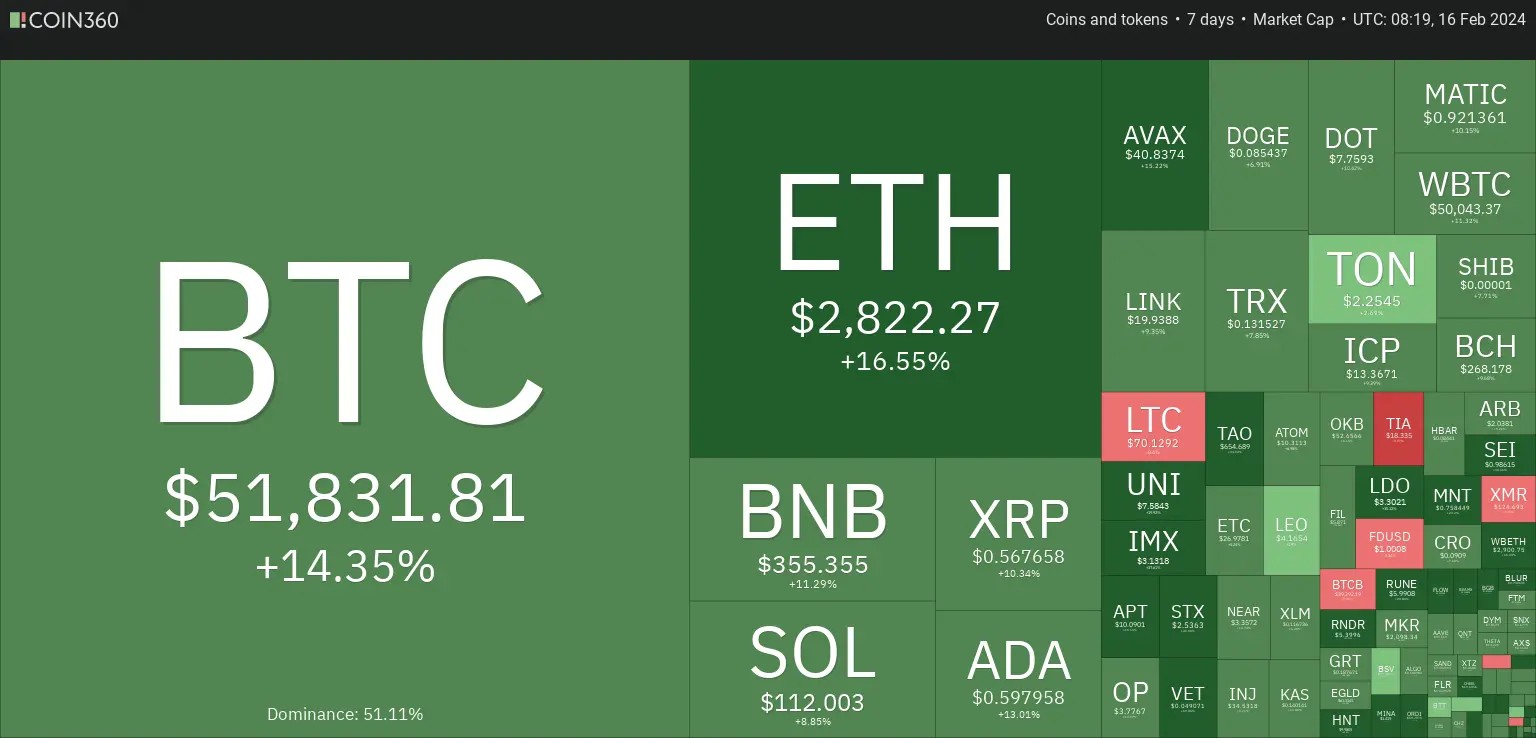
7 Days Heatmap
After breaking above the neckline of the inverse head and shoulders pattern at the start of this week, BTC surged by 14.35%.
This upward momentum had a favorable effect on the entire crypto market, resulting in bullish movements in various altcoins, including a massive 16.55% rise in ETH.
BTC Analysis
BTC is currently hovering around a strong resistance zone and the upper boundary of the orange daily channel.
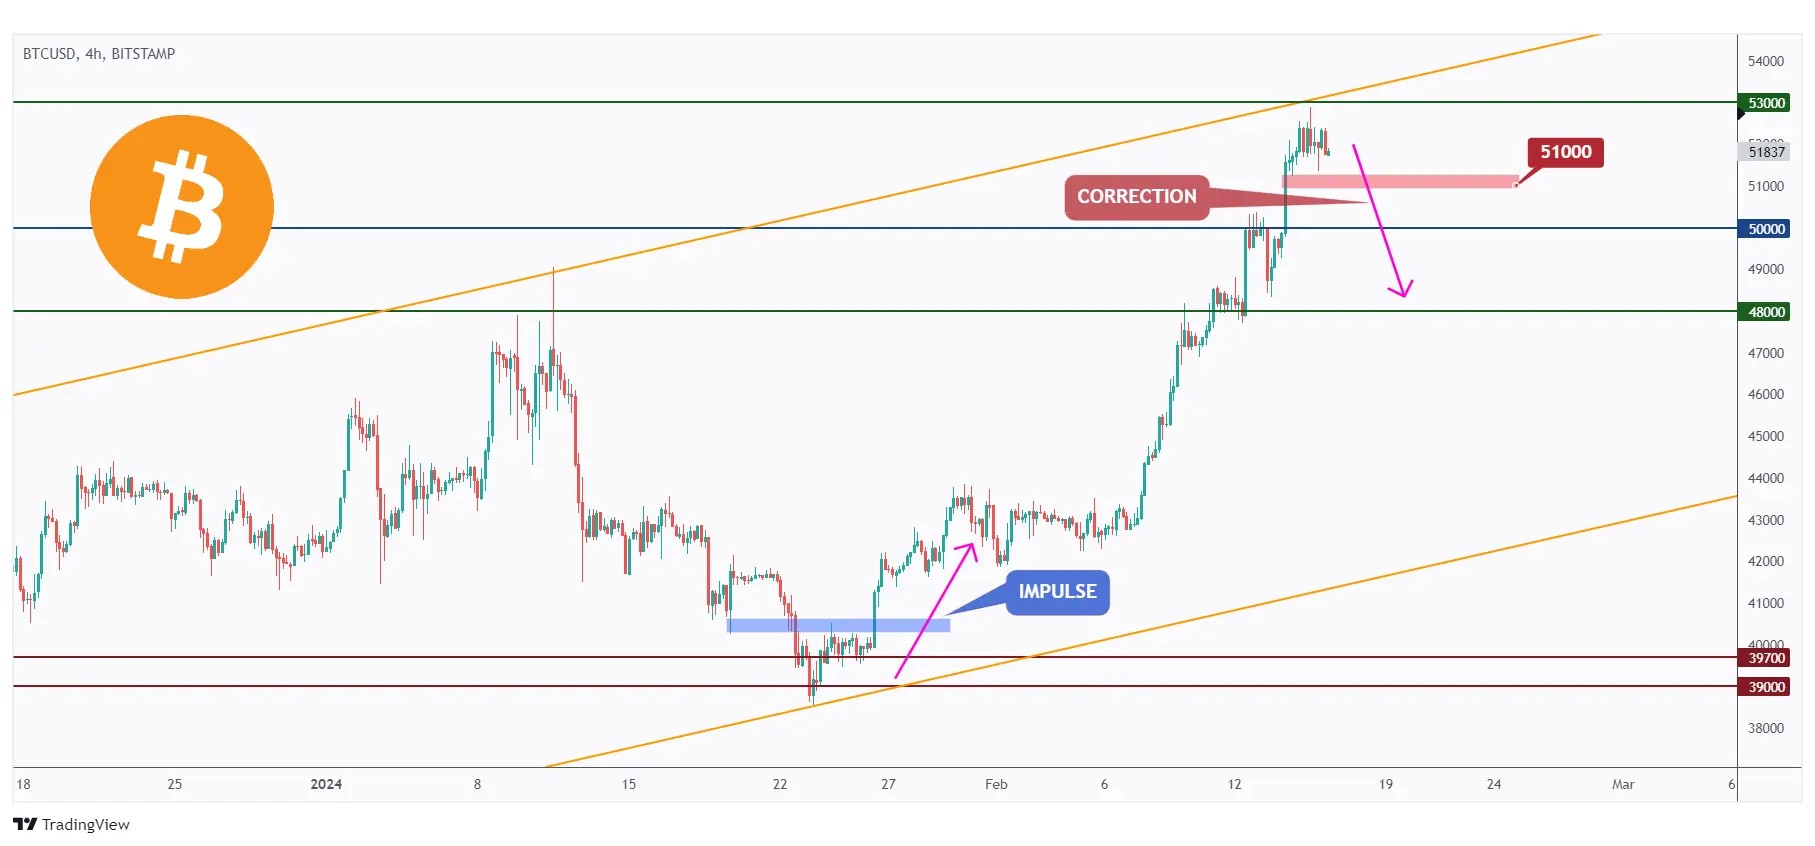
If the $53,000 mark is broken upwards, we expect the bulls to remain in control, potentially resulting in a movement towards the resistance zone between $58,000 and $60,000.
In parallel, if the last low marked in red at $51,000 is broken downward, we expect a bearish correction to start, leading to a movement towards the $48,000 support level.
ETH Analysis
As noted in a previous analysis, ETH bounced off the $2470 support and traded higher.
Currently, ETH is hovering around a weekly resistance zone between $2850 and $3000.
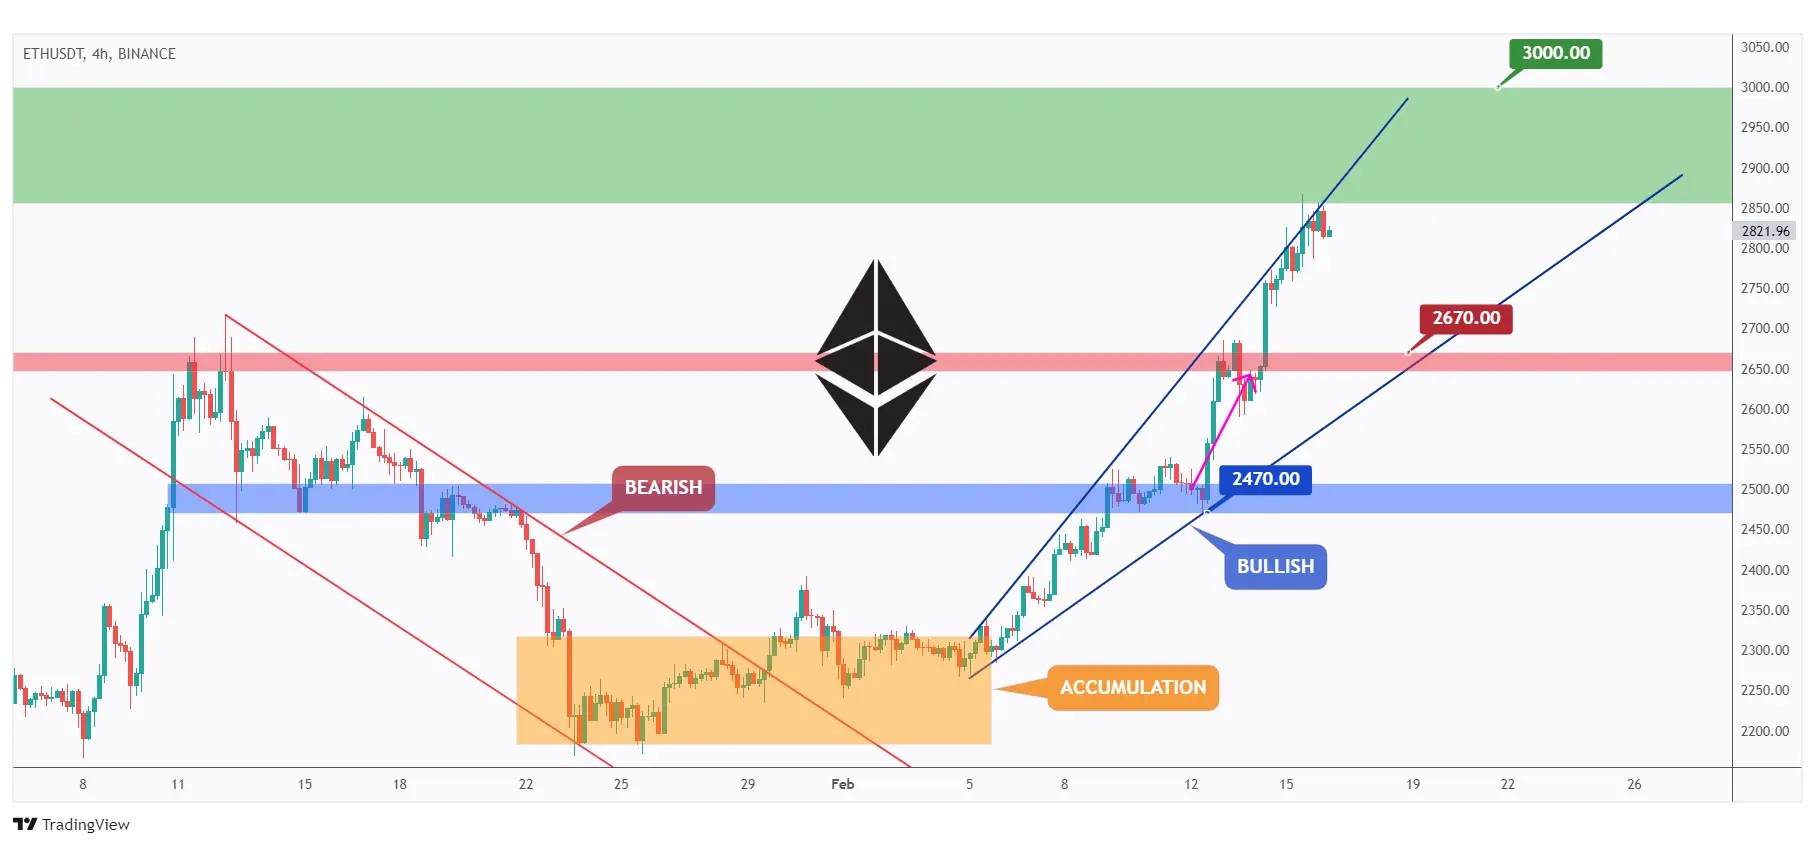
For the bullish momentum to maintain control in the long term, a breakthrough above $3000 is essential.
Meanwhile, the bears still have the potential to kick in, driving the price downwards and to test the lower blue trendline and the $2670 support level.
Quote of the week
Trading is very competitive and you have to be able to handle getting your butt kicked.
~ Paul Tudor Jones
Closing Remarks
In summary, this week BTC surged by 14.35% after breaking above an inverse head and shoulders pattern, boosting the entire crypto market, with ETH rising by 16.55%.
BTC hovers near a resistance zone, with potential for further gains above $53,000 towards $58,000-$60,000.
ETH bounced off $2470 support and eyes a resistance zone between $2850 and $3000. Breaking above $3000 is crucial for bullish momentum, while a drop below $51,000 for BTC or $2670 for ETH could signal bearish correction.