
elcome to another crypto market outlook for the 14th of February!
In today's market analysis, we will delve into the current state of the cryptocurrency market. The sentiment for BTC remains bullish, while USDT.D is approaching a critical support level at 5%.
Furthermore, we will cover five altcoins (TWT, AGIX, FTM, ATOM, and INJ), emphasizing their key levels and potential trading setups.
Are you ready?
Today, we will cover the following topics:
- USDT.D and BTC Analysis
- 5 Altcoins Analysis
- Quotes / Advices
- Closing Remarks
USDT.D and BTC analysis
As usual, I always start my analysis with USDT.D as it serves as an indicator of traders' sentiment. USDT.D reflects whether traders are optimistic (investing in cryptocurrencies) or pessimistic (shifting towards stablecoins).
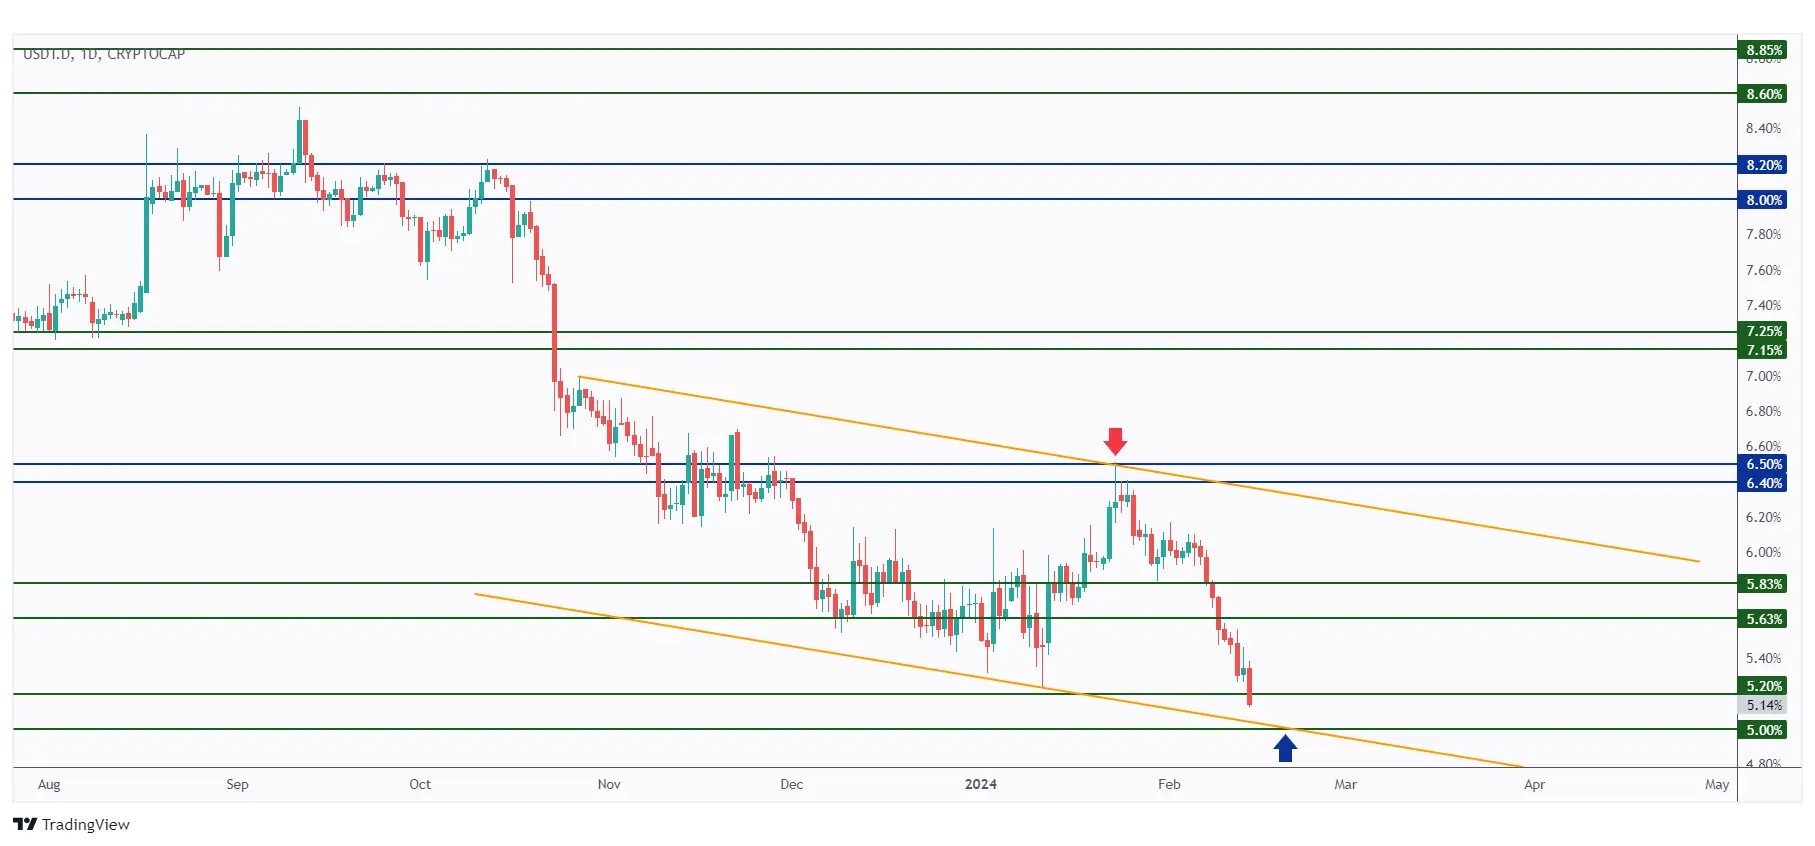
After breaking below the 5.63% support, USDT.D traded lower to test the next support at 5%.
As long as this support holds, we anticipate a bullish movement, which could be unfavorable for the crypto.
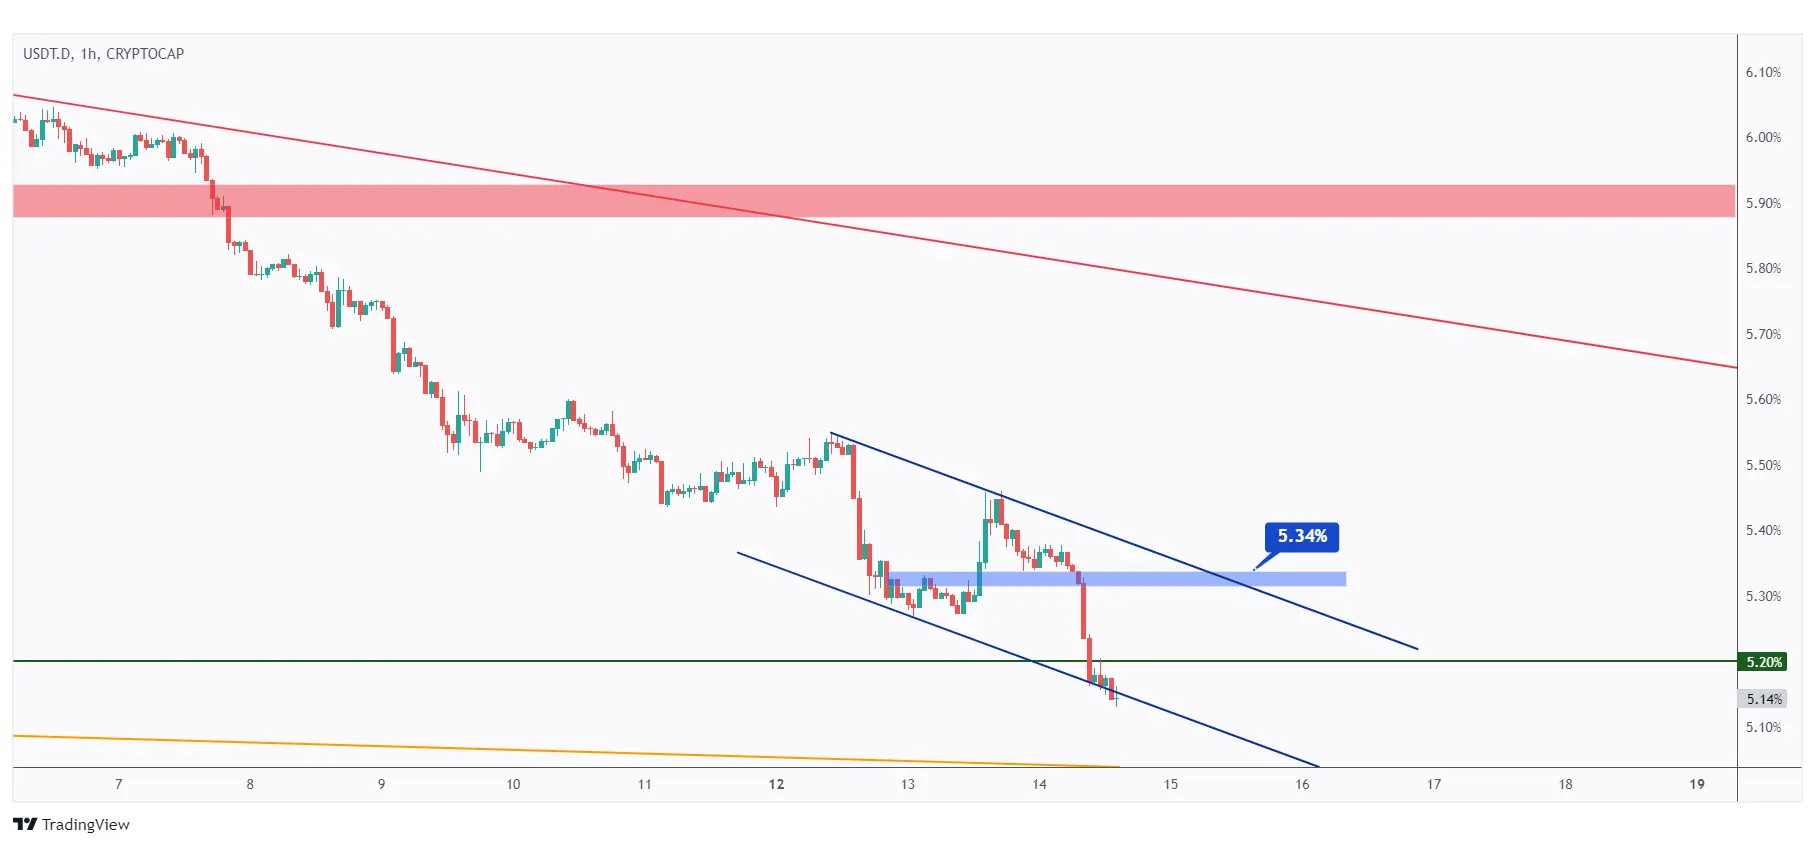
From a short-term perspective, USDT.D has been bearish, trading within the descending channel marked in blue.
For the bulls to take over, and shift the momentum from bearish to bullish, a breakout above the upper blue trendline and the last major high at 5.34% is necessary.
Meanwhile, USDT.D is expected to remain bearish and may continue to decline, potentially retesting the 5% level.
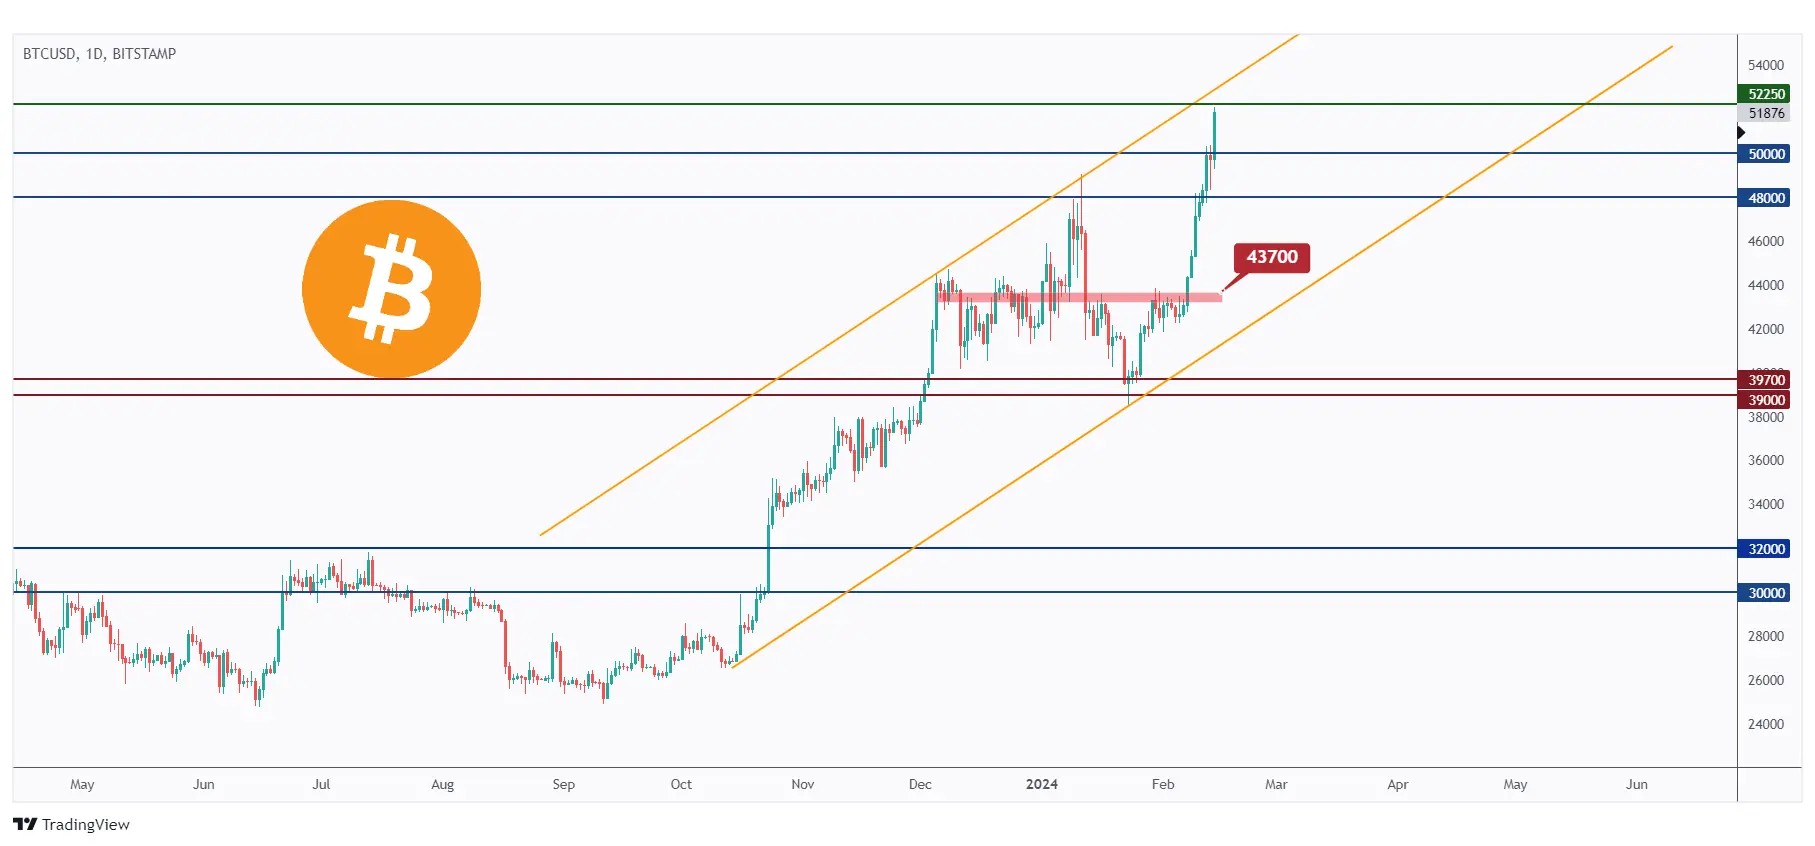
After breaking above the $43,700 structure marked in red, BTC traded higher in a parabolic manner, leading to a movement towards the upper bound of the orange channel.
For the bulls to maintain control, a breakout above the $52,250 level is necessary.
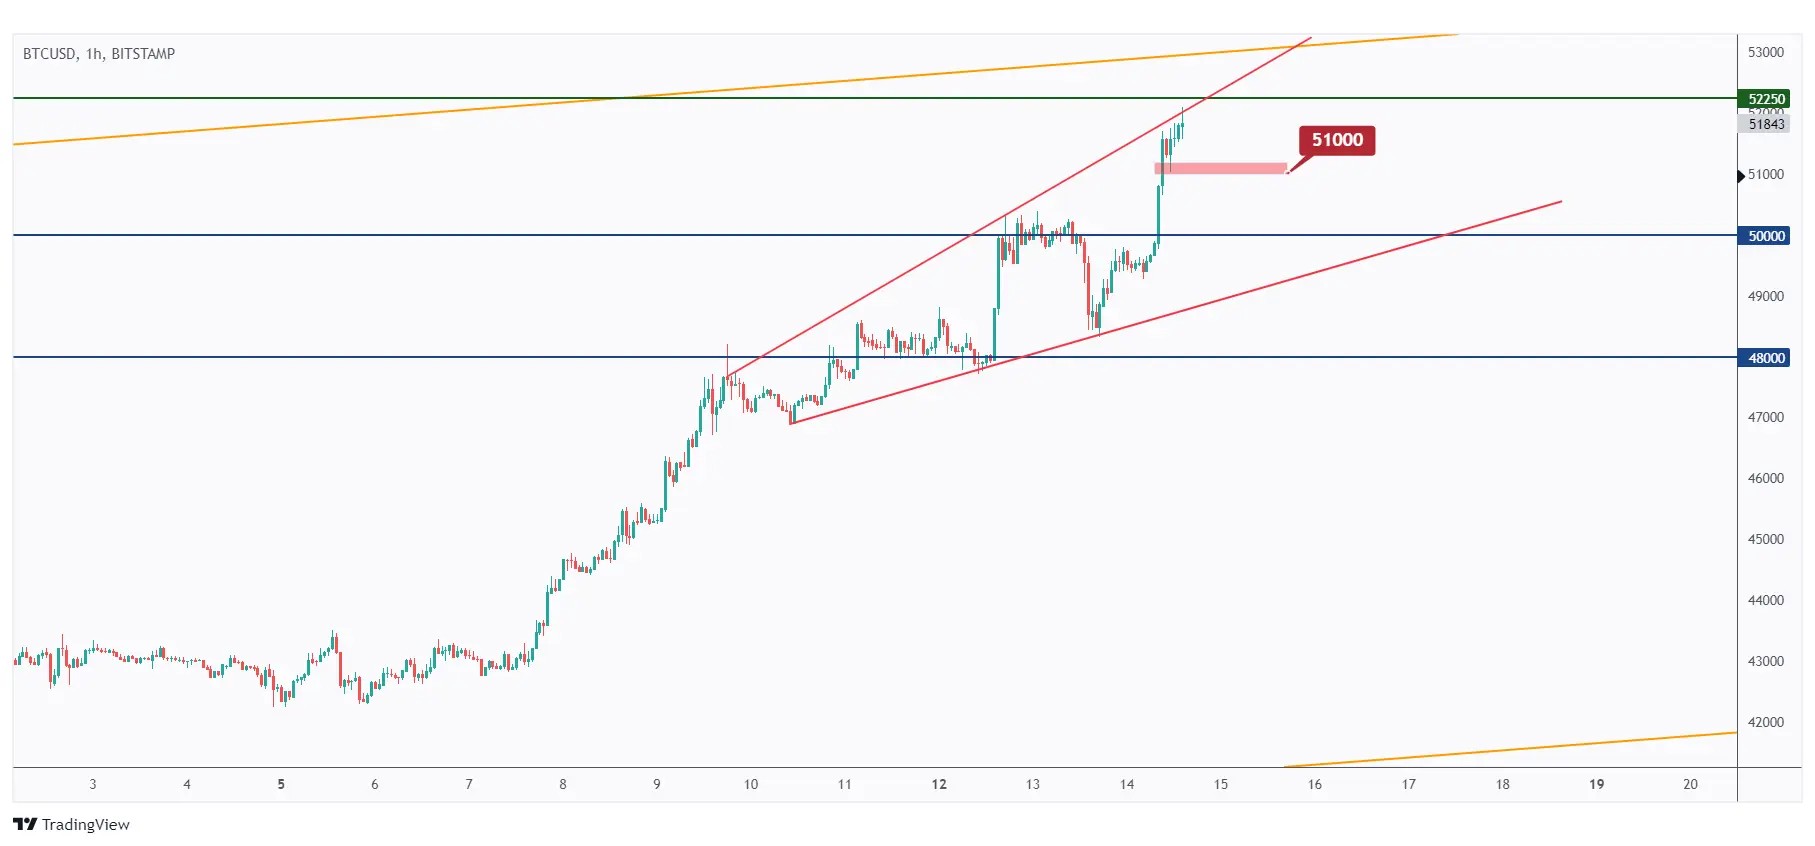
In the 1-hour timeframe, BTC has been trading within the rising broadening wedge marked in red.
However, it is currently hovering around the upper bound of the wedge pattern.
The bulls will remain in control unless the last low marked in red at $51,000 is breached downward. In such a scenario, we anticipate a correction towards $49,500.
5 Altcoins Analysis
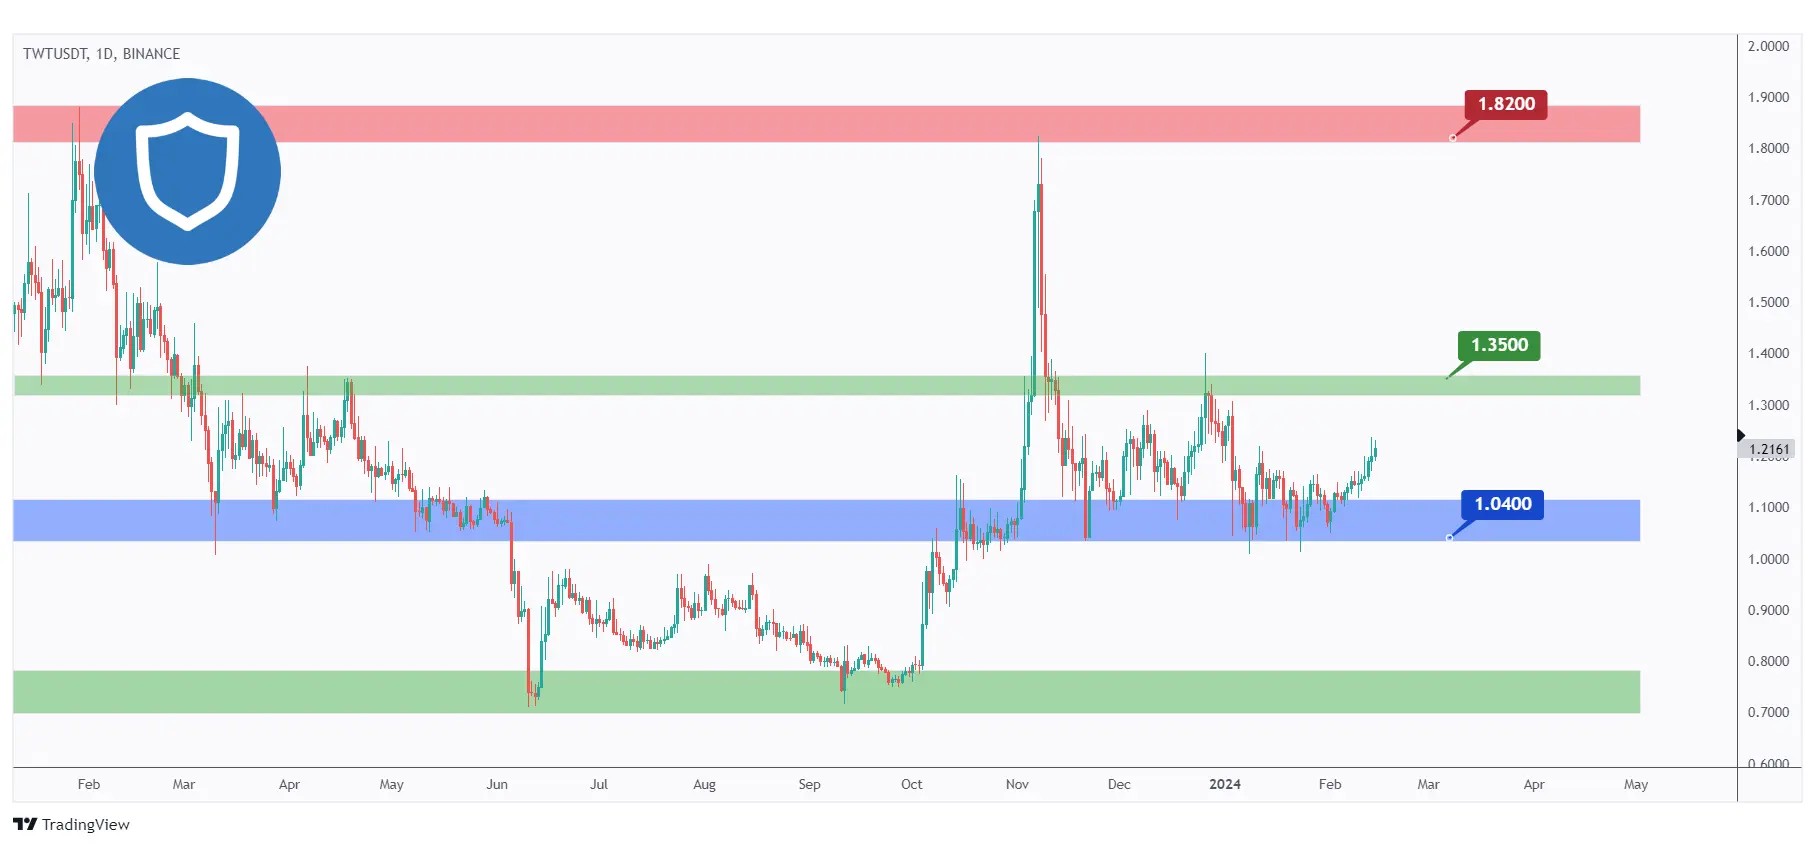
Let's start with TWT. It has been trading within a range between the $1.04 support and $1.35 resistance.
This week, TWT bounced off the $1.04 support and traded higher.
The bulls have gained short-term control after breaking above the previous minor high, and we anticipate further momentum towards $1.30.
To establish medium-term control, the bulls must break above the $1.35 resistance.
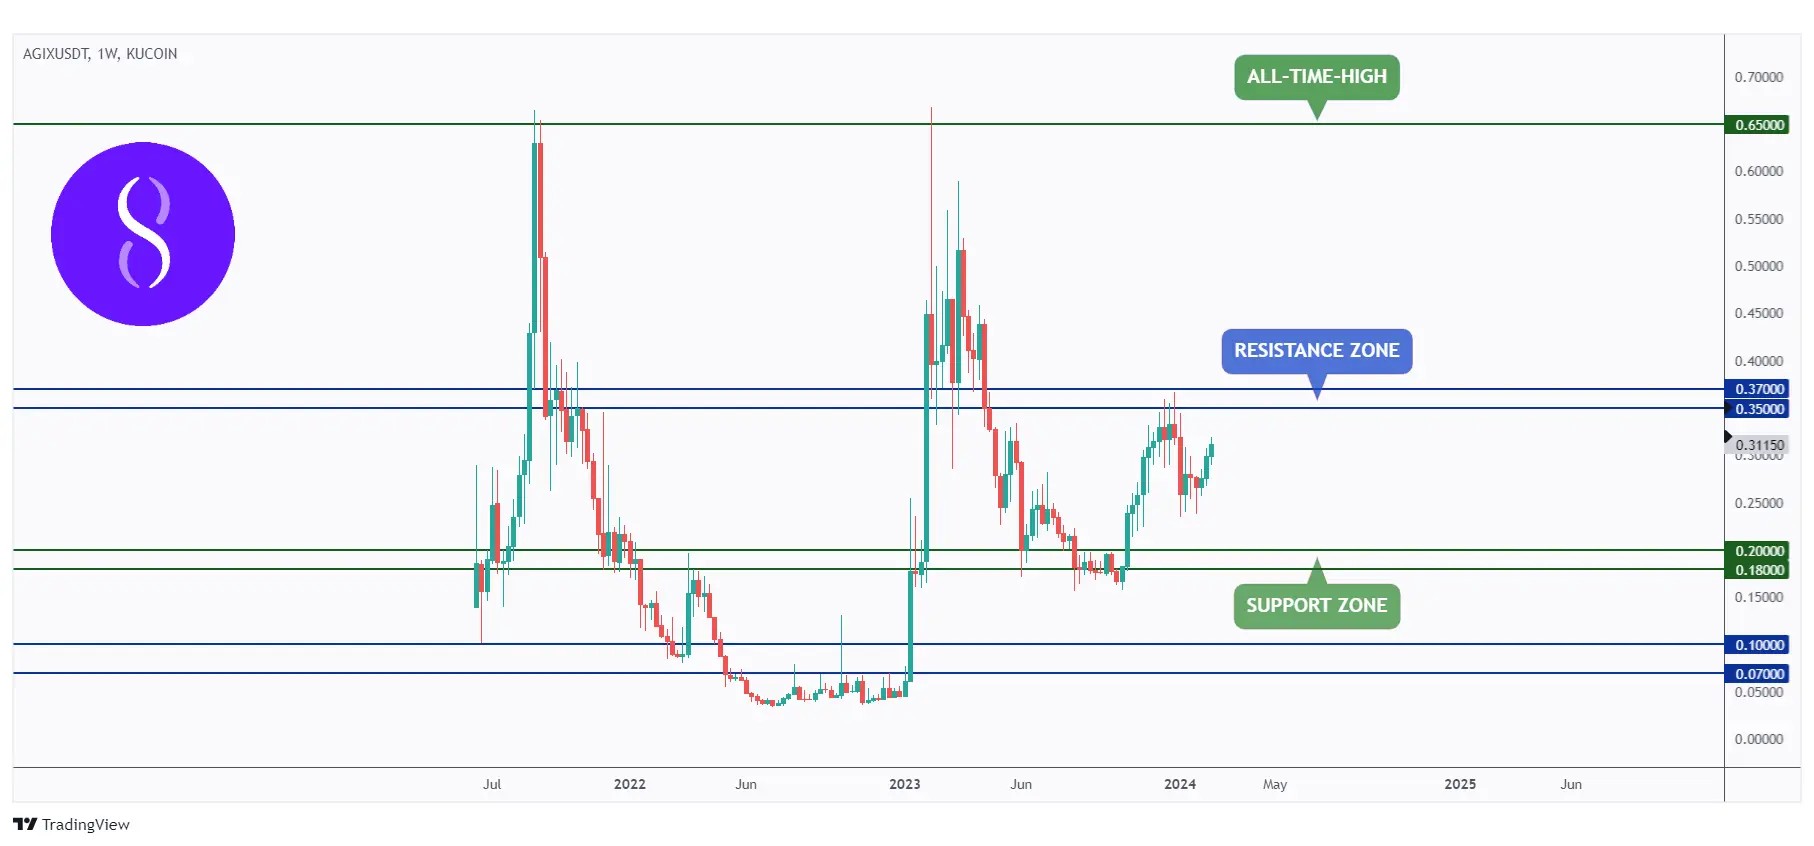
Turning our attention to AGIX, it has been trading within a range between $0.20 and $0.37.
To establish long-term bullish momentum, a breakout above the $0.37 resistance is necessary.
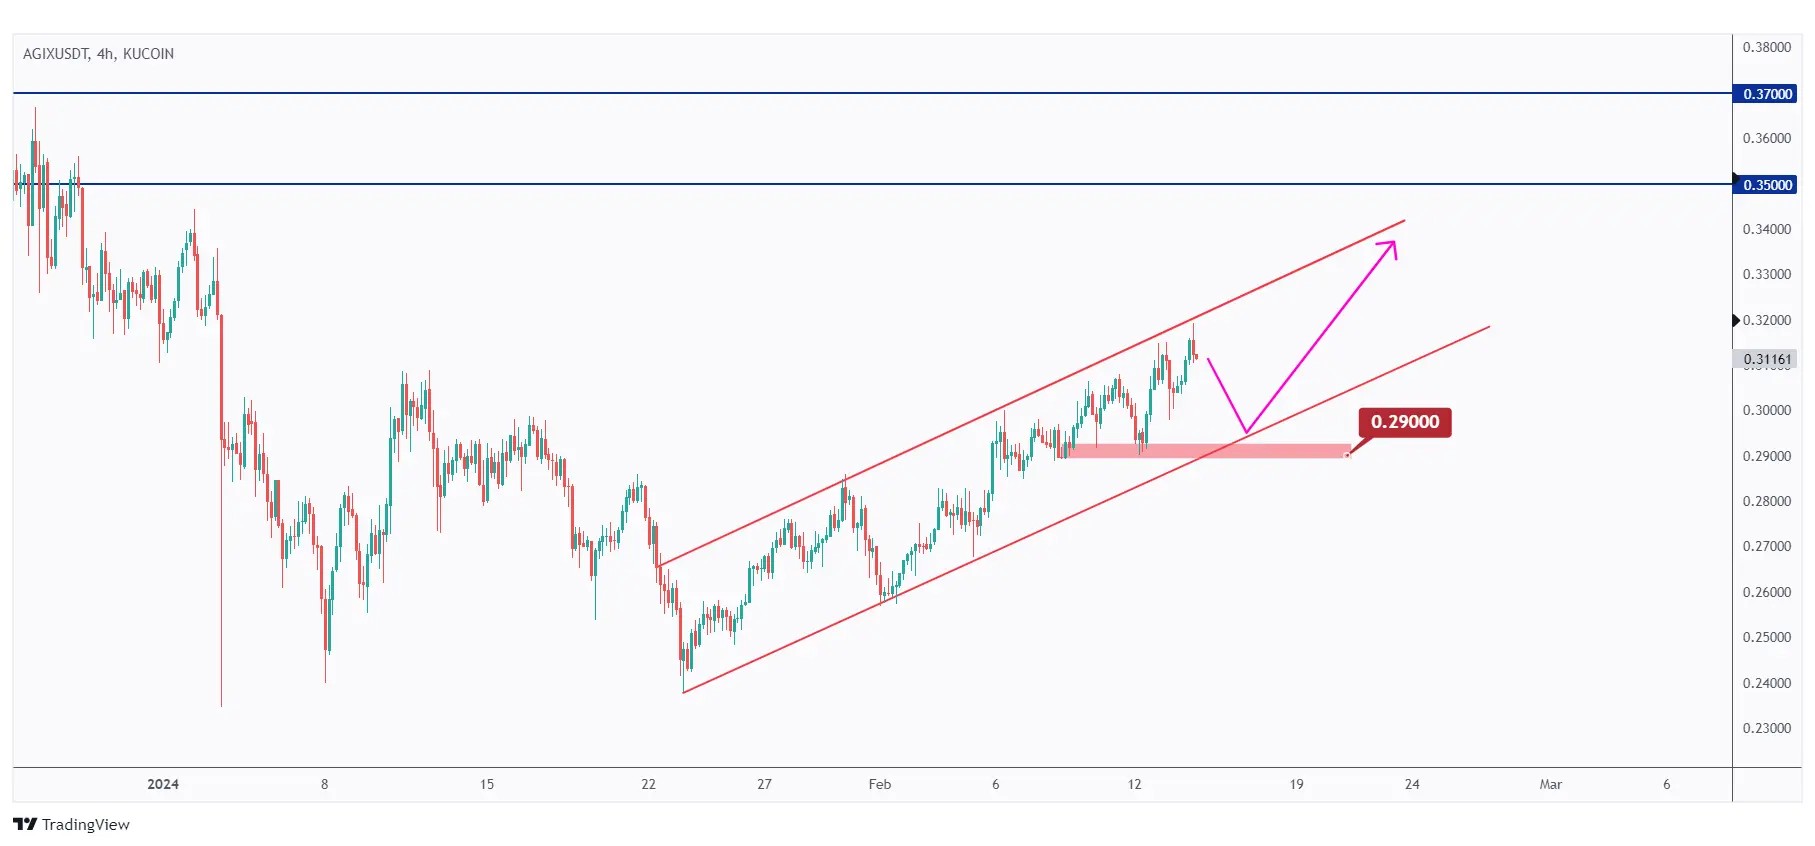
In the 4-hour timeframe, AGIX has been overall bullish, trading within the ascending channel highlighted in red.
The bulls are expected to maintain control and drive the price towards $0.34, unless the previous major low marked in red at $0.29 is breached downward.
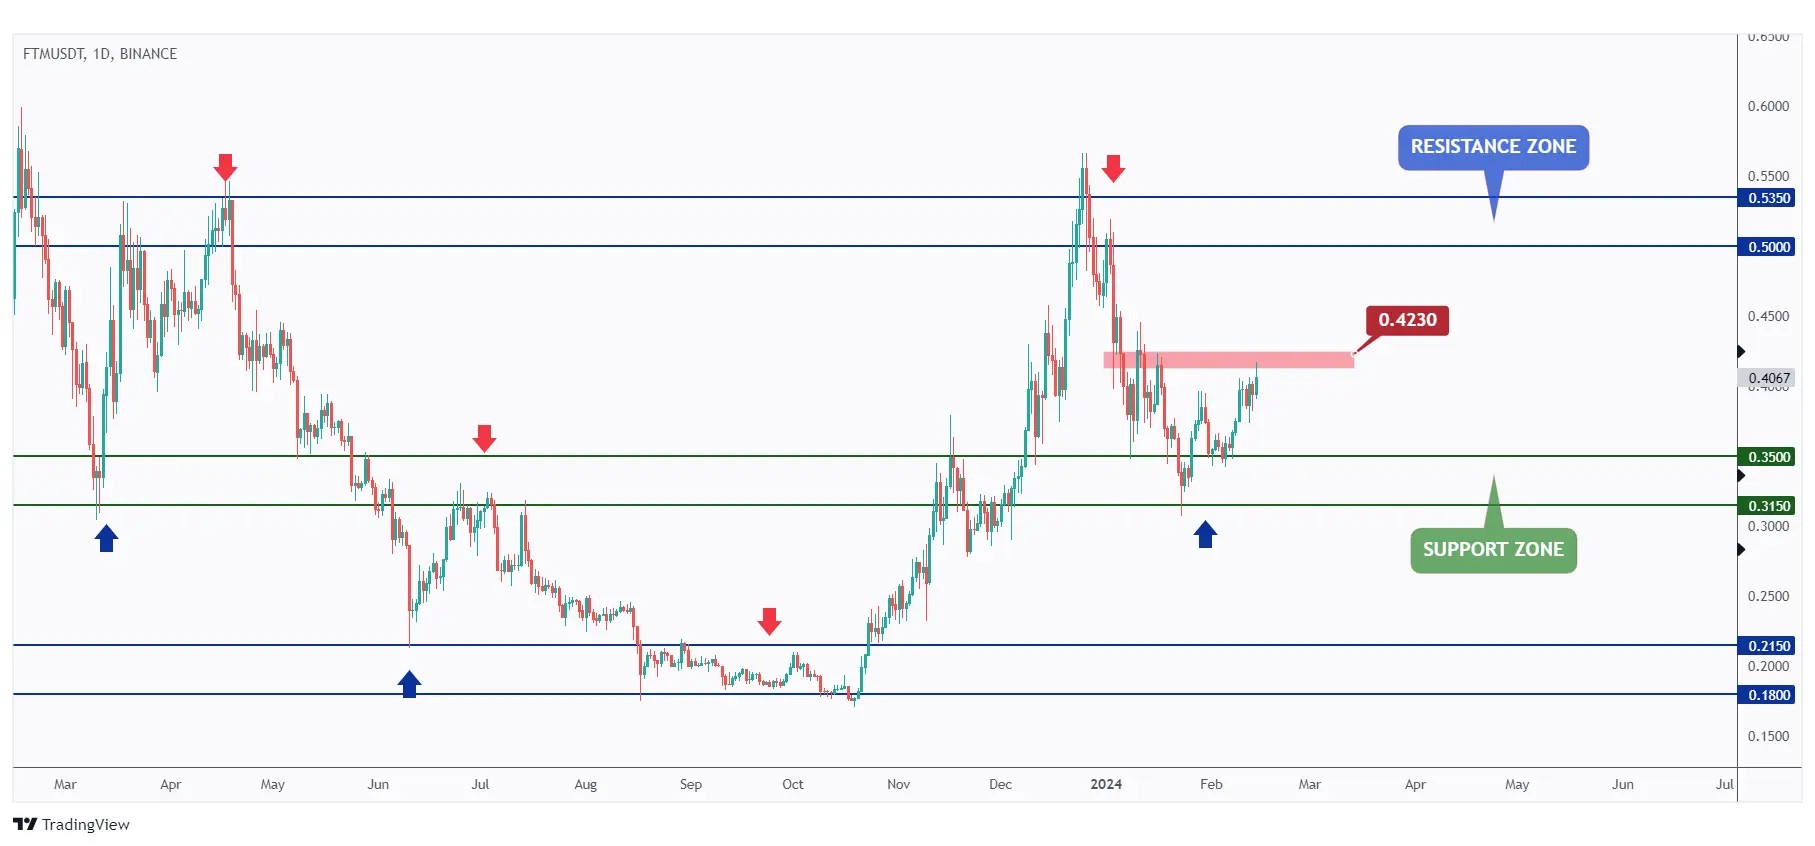
Next on the list for today is FTM. After rebounding from the $0.315 support, FTM has been bullish from a short-term perspective.
However, it is currently approaching a significant high marked in red.
To gain control from a medium-term perspective, a breakout above $0.423 is necessary.
In such an event, a movement towards the next resistance and round number at $0.5 would be anticipated.
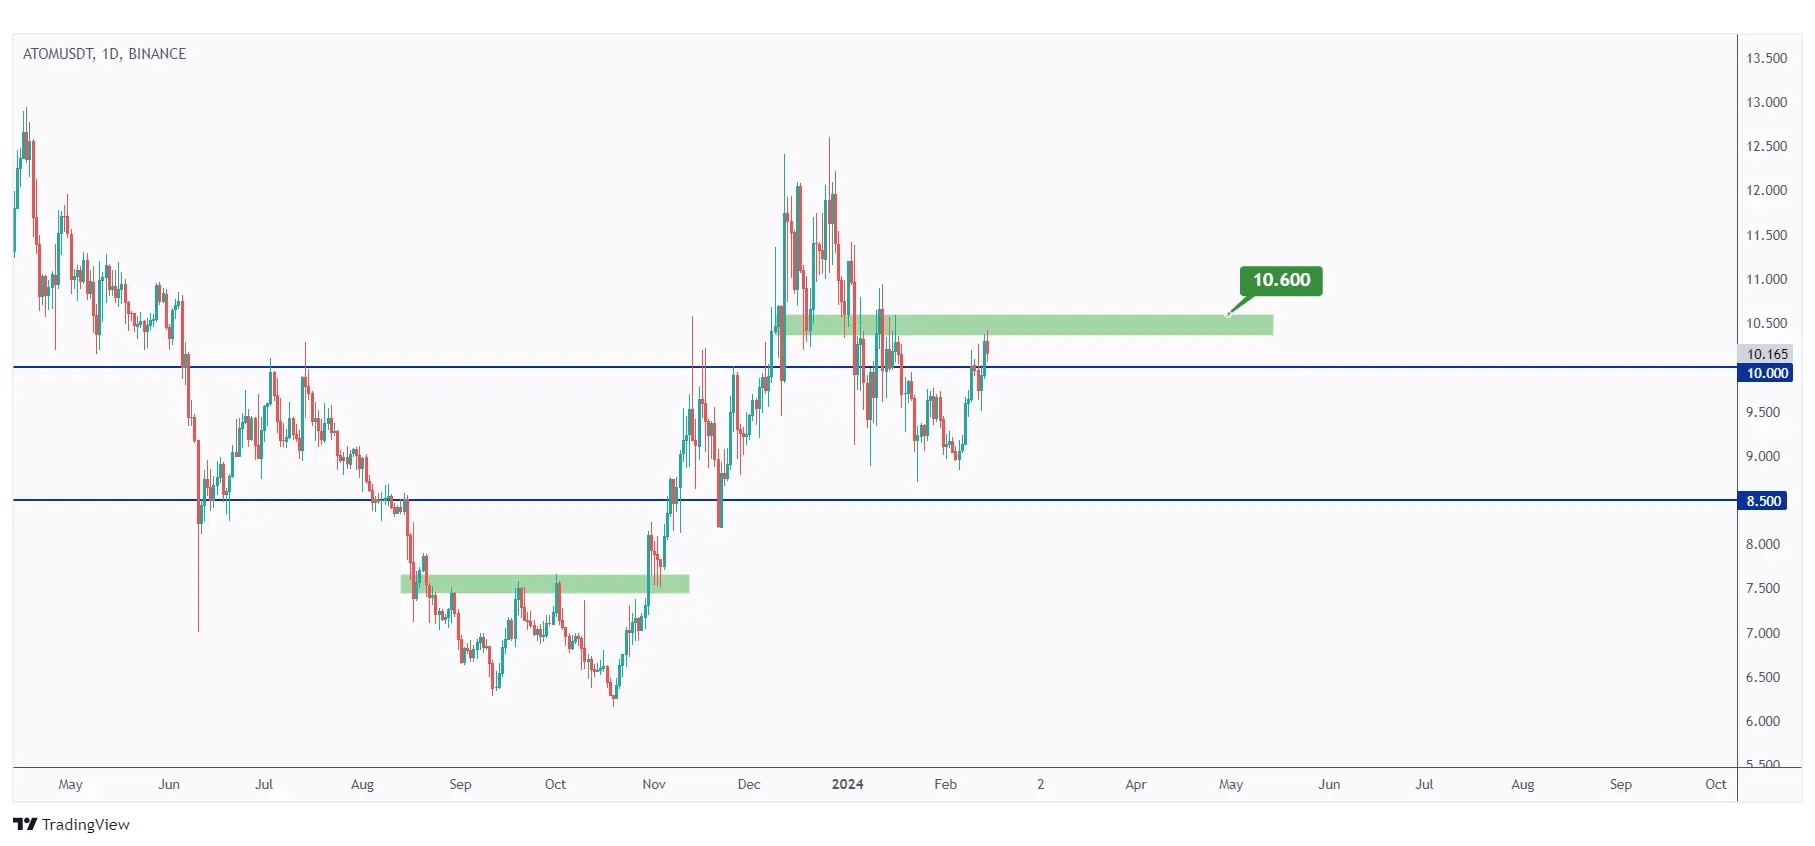
Analyzing ATOM, it recently broke above the $10 mark which is now acting as support.
As long as the support holds, we will be looking for buy setups on lower timeframes.
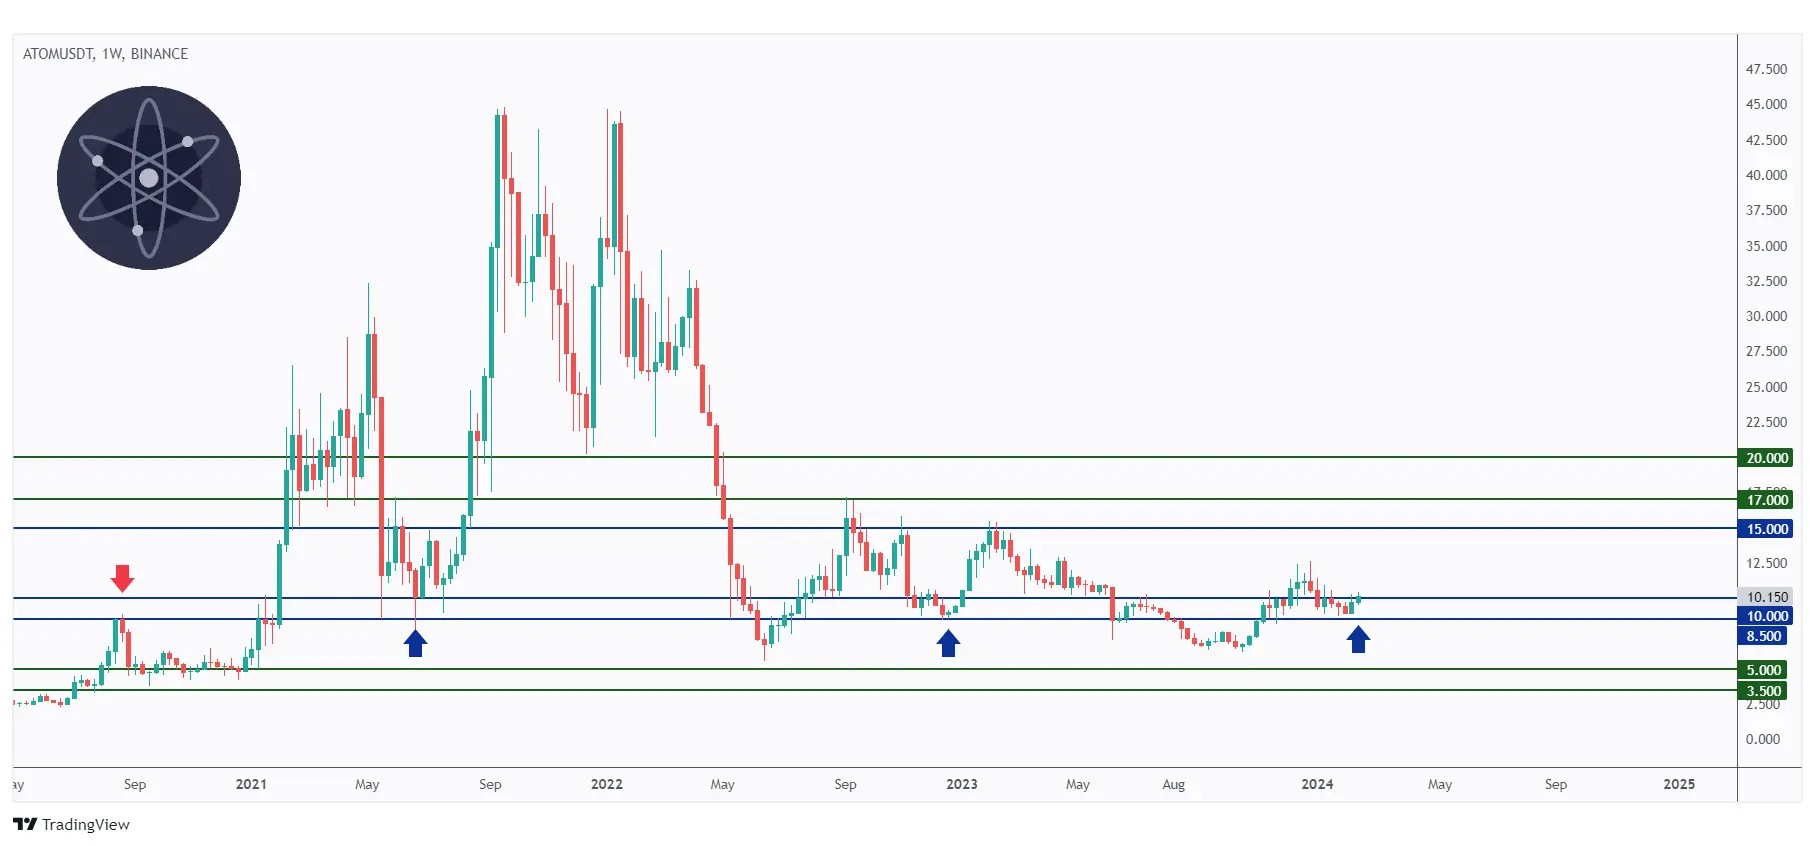
For the bulls to assume control and initiate the next upward impulse movement, a breakout above the last major high marked in green at $10.6 is necessary.
Meanwhile, ATOM could still trade lower and dive inside the $8.5 - $10 support.
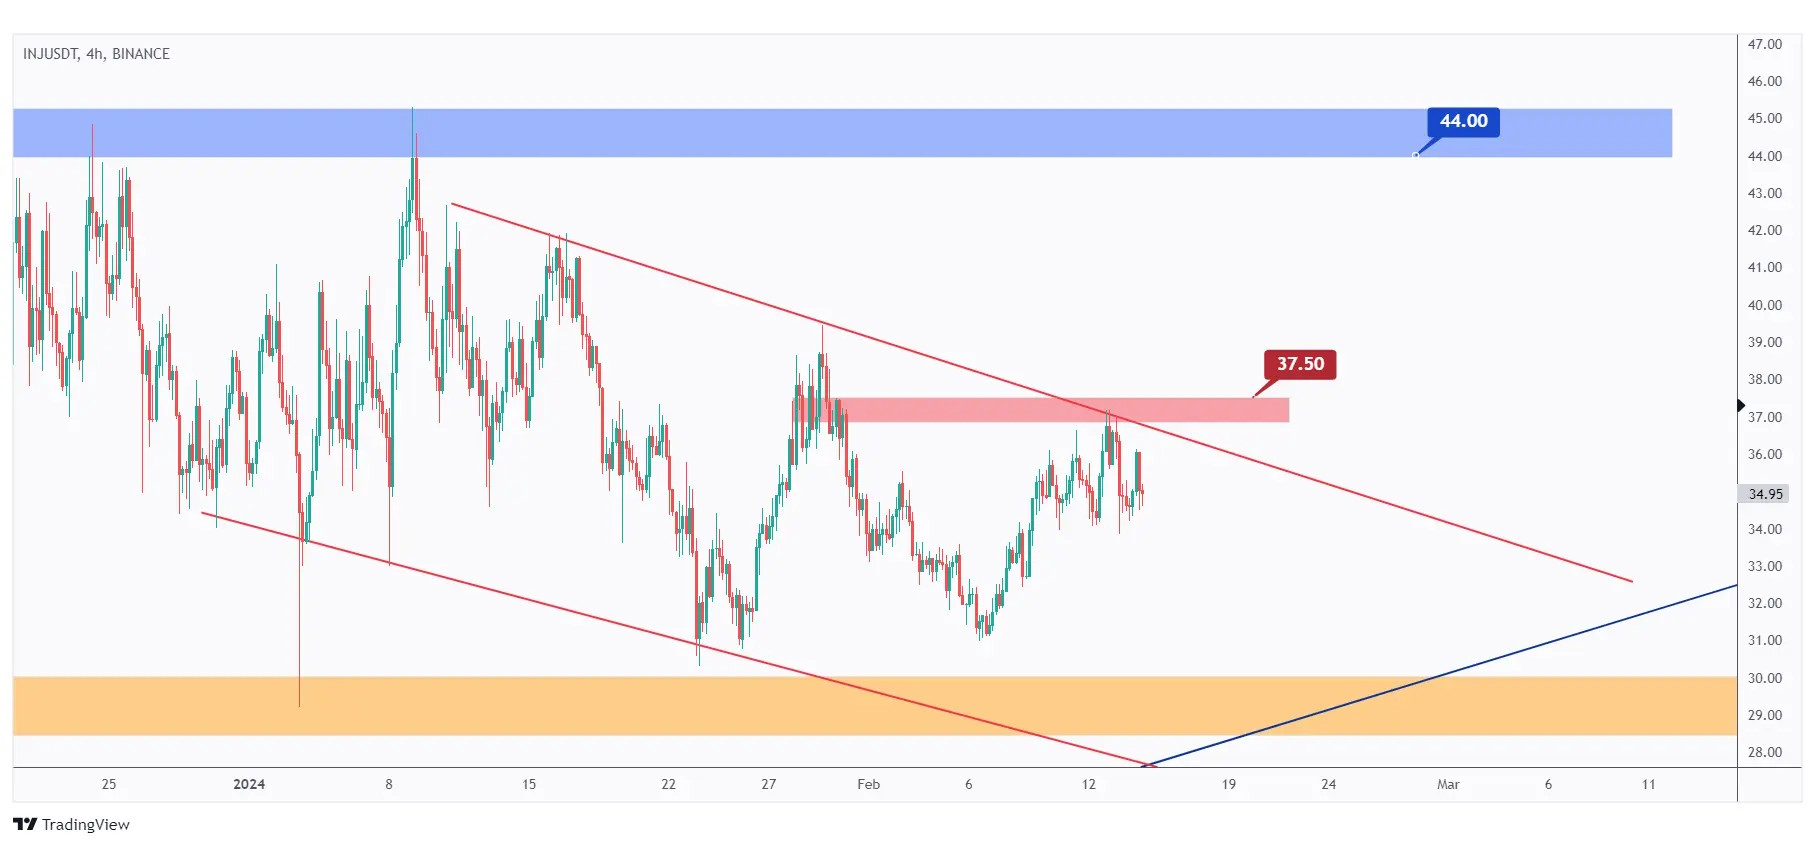
INJ has been overall bullish from a long-term perspective, trading above the blue trendline, which serves as a non-horizontal support.
Currently, INJ is undergoing a corrective phase from a short-term perspective, trading within the descending channel highlighted in red.
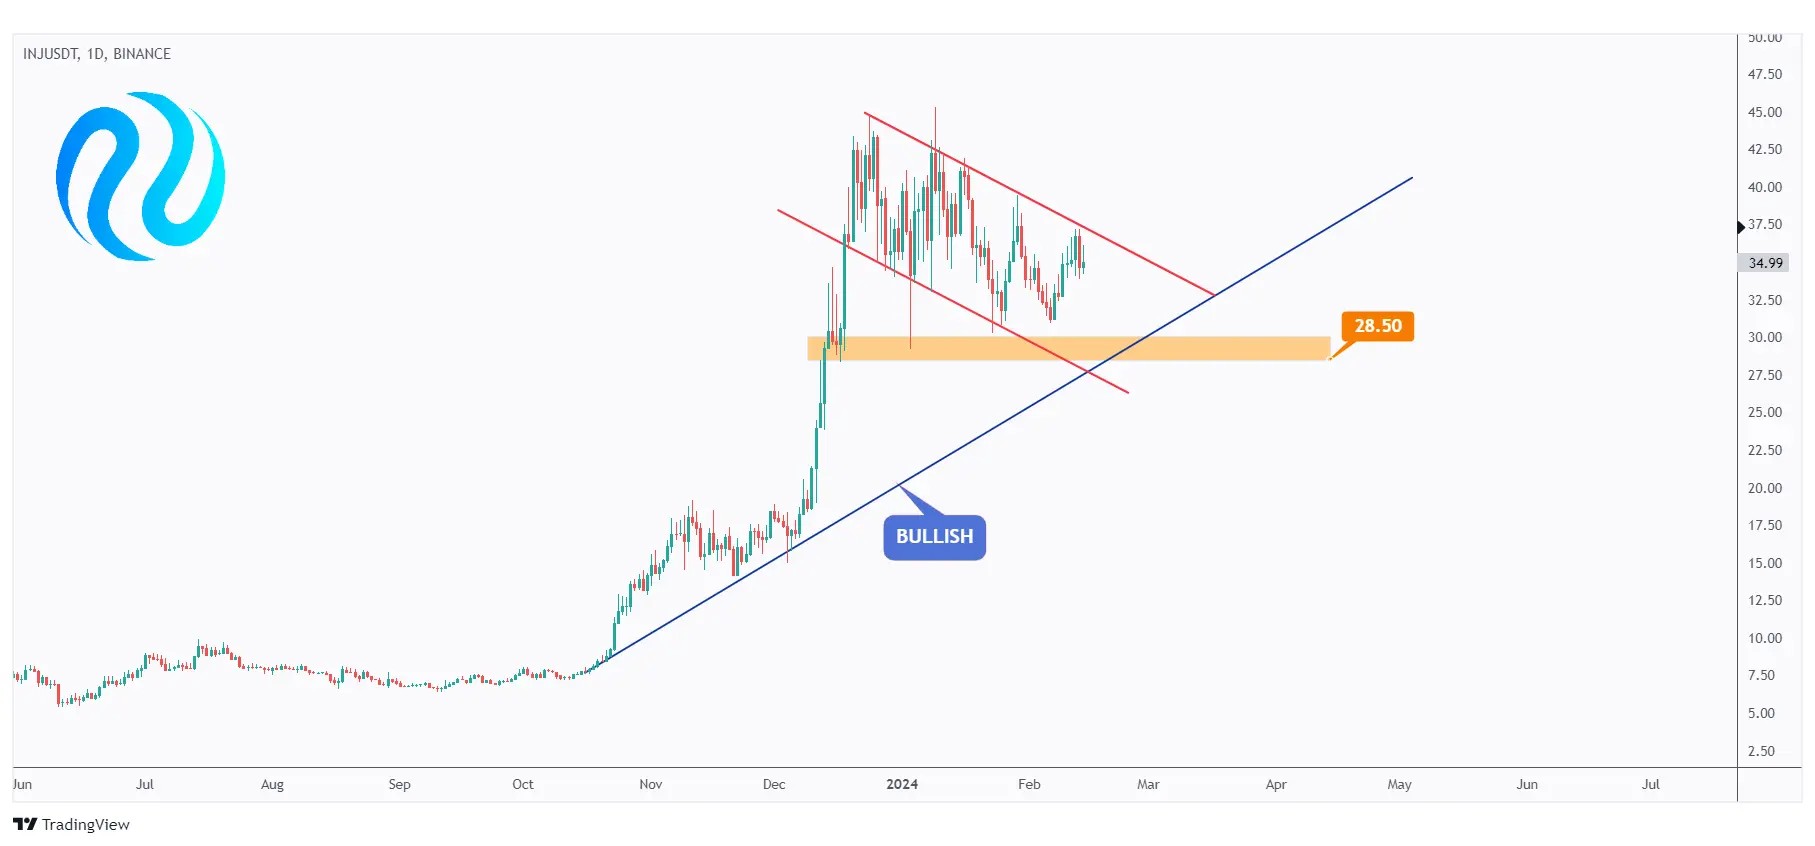
For the bulls to regain control and initiate the next upward impulse movement, a breakout above the last significant high highlighted in red at $37.5 is needed.
Meanwhile, INJ is anticipated to remain bearish and could further decline, possibly retesting the $30 support zone.
Quotes / Advices
Trading is like a chef crafting a dish. Both require skill, timing, and precision.
Just as a chef carefully selects ingredients to create a harmonious flavor profile, traders analyze market data to make informed decisions.
Like a chef adjusting seasoning to perfection, traders adapt strategies to market fluctuations.
Both endeavors blend artistry with science, aiming for a satisfying outcome – whether it's a delicious meal or a profitable trade.
Closing Remarks
In summary, USDT.D indicates a potential bullish movement if the 5% support level holds, which could negatively impact the crypto market.
For BTC, a breakout above $52,250 is crucial to maintain bullish momentum.
TWT exhibits short-term bullishness with resistance at $1.35, AGIX faces resistance at $0.37, and FTM needs a breakout above $0.423 for medium-term control.
ATOM's support at $10 and resistance at $10.6 are pivotal, while INJ awaits a breakout above $37.5 to regain bullish momentum.