
elcome to another crypto market outlook for the 14th of January!
In this edition, we'll delve into major assets such as US500, DXY, Gold, Bitcoin, and Ethereum, highlighting critical levels and potential trade setups.
From Bitcoin experiencing a 12% drop after rejecting the $50,000 resistance to ETH approaching a support zone, and the Fear & Greed Index declining over the past week, this article covers it all.
Are you ready?
Today, we will cover the following topics:
- Market Heatmap and Fear and Greed Index
- US500, DXY and Gold Analysis
- USDT.D, Bitcoin and Ethereum Analysis
- Quotes / Advices
- Closing Remarks
Market Heatmap and Fear and Greed Index
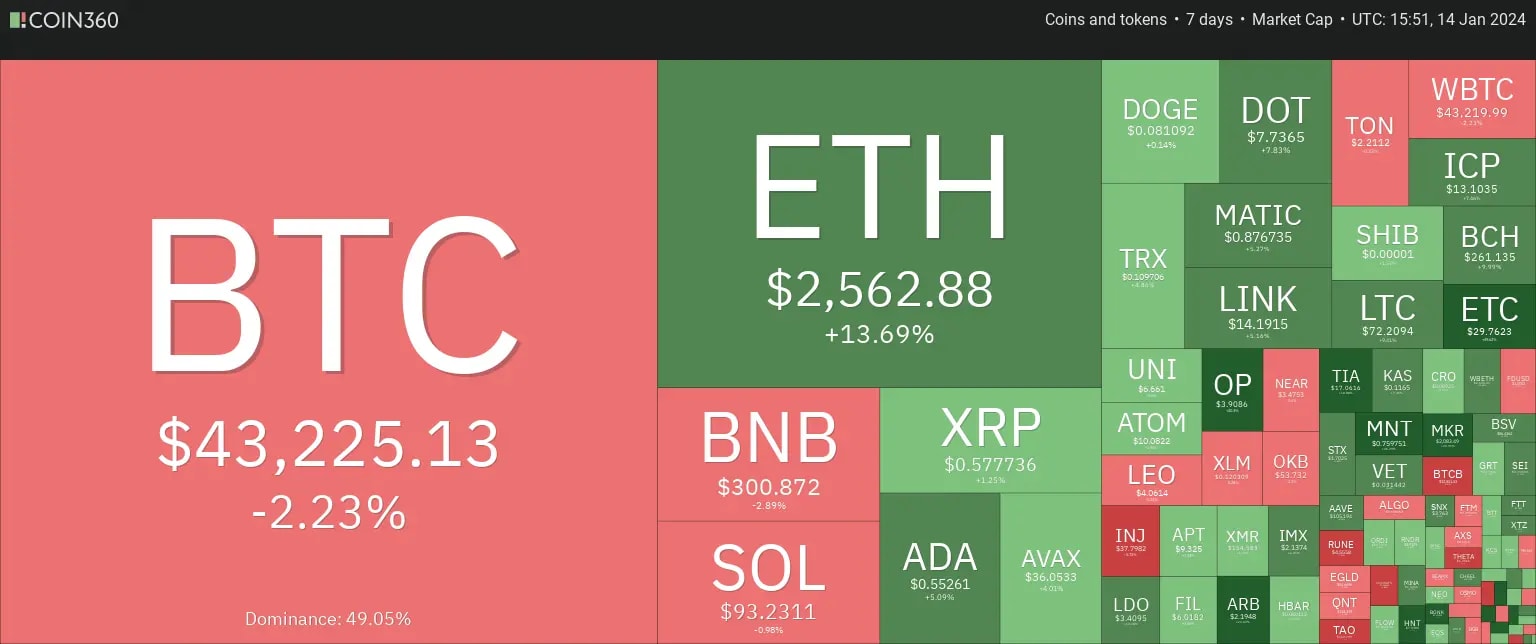
To initiate my research, I delved into the analysis by examining the market heatmap, which provided a comprehensive overview of the entire cryptocurrency market.
After rejecting the $50,000 resistance zone, BTC declined by 12%, dragging the entire crypto market down with it.
On the heatmap, you can observe a mix of red and green colors. Despite the bearish movement at the end of the week, some altcoins have maintained a bullish trend on average over the past 7 days.
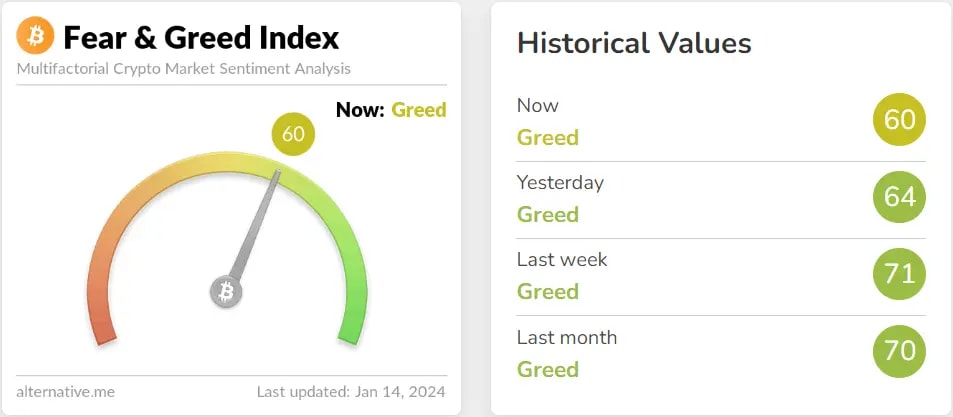
The Fear & Greed Index has consistently indicated 'Greed' for nearly two months. However, we can observe the meter decreasing from 71 last week to 64 and 60 over these past two days, indicating that traders are becoming less and less optimistic.
US500, DXY and Gold analysis
We consistently monitor the US500 index to assess the current market sentiment. This practice is crucial because the cryptocurrency market often exhibits a significant correlation with the stock market, and this interconnection can impact its fluctuations.
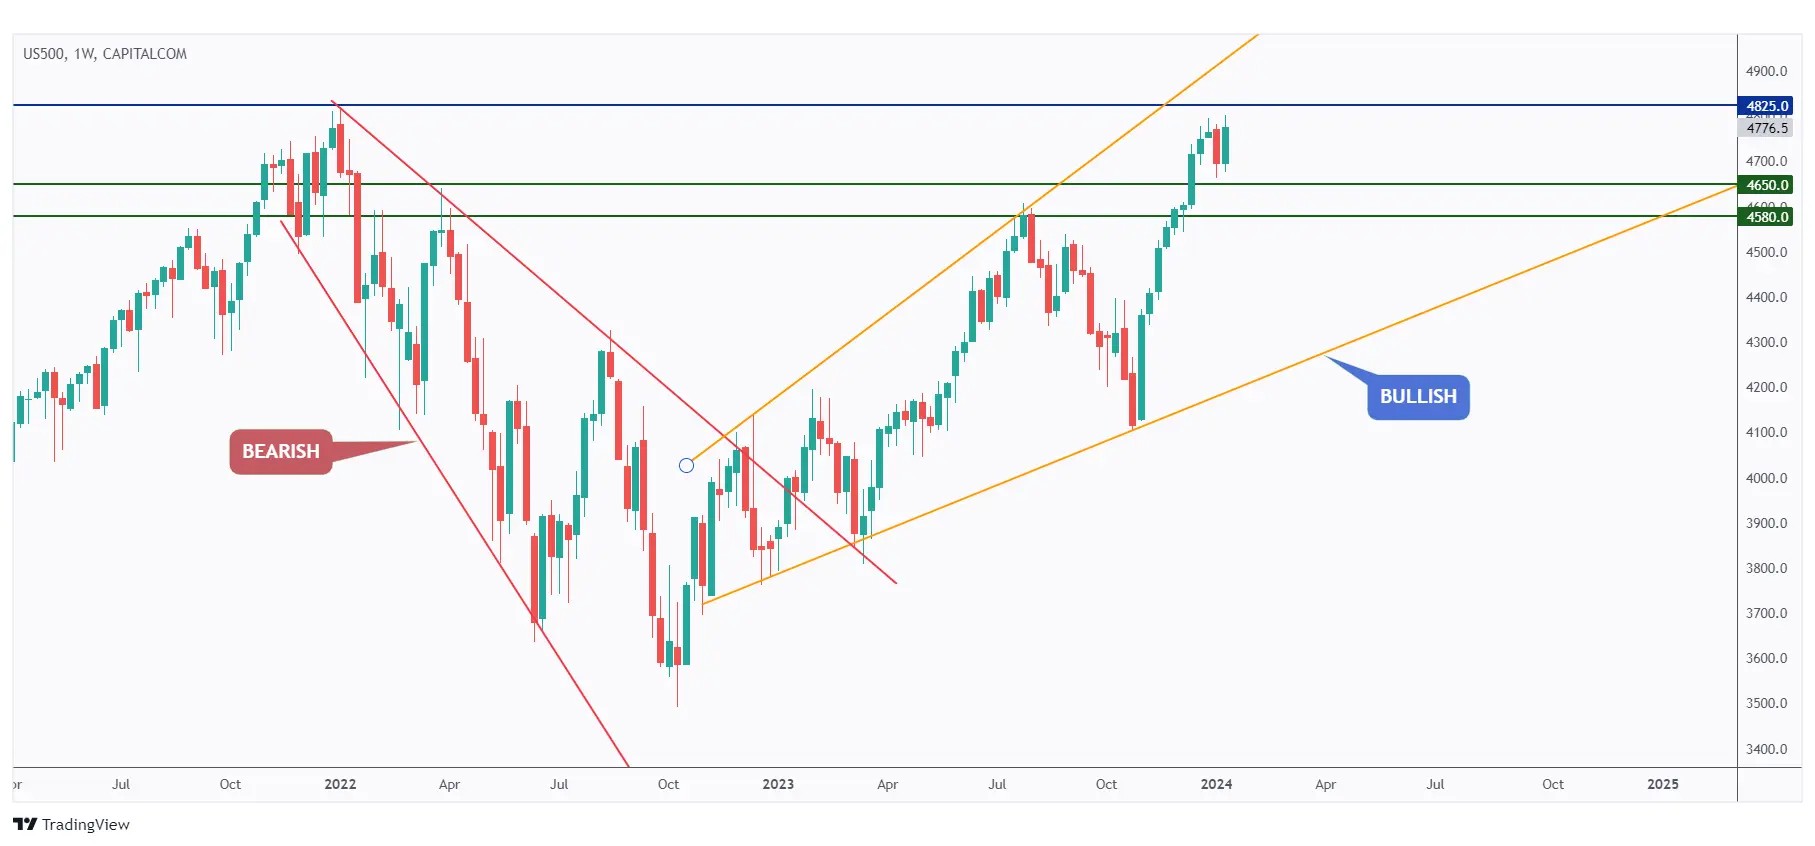
This week, the US500 rejected the $4650 level and traded higher to retest the all-time high. For the bulls to establish control from a long-term perspective, a breakout above $4825 is essential.
Meanwhile, the US500 could remain confined within a narrow range.
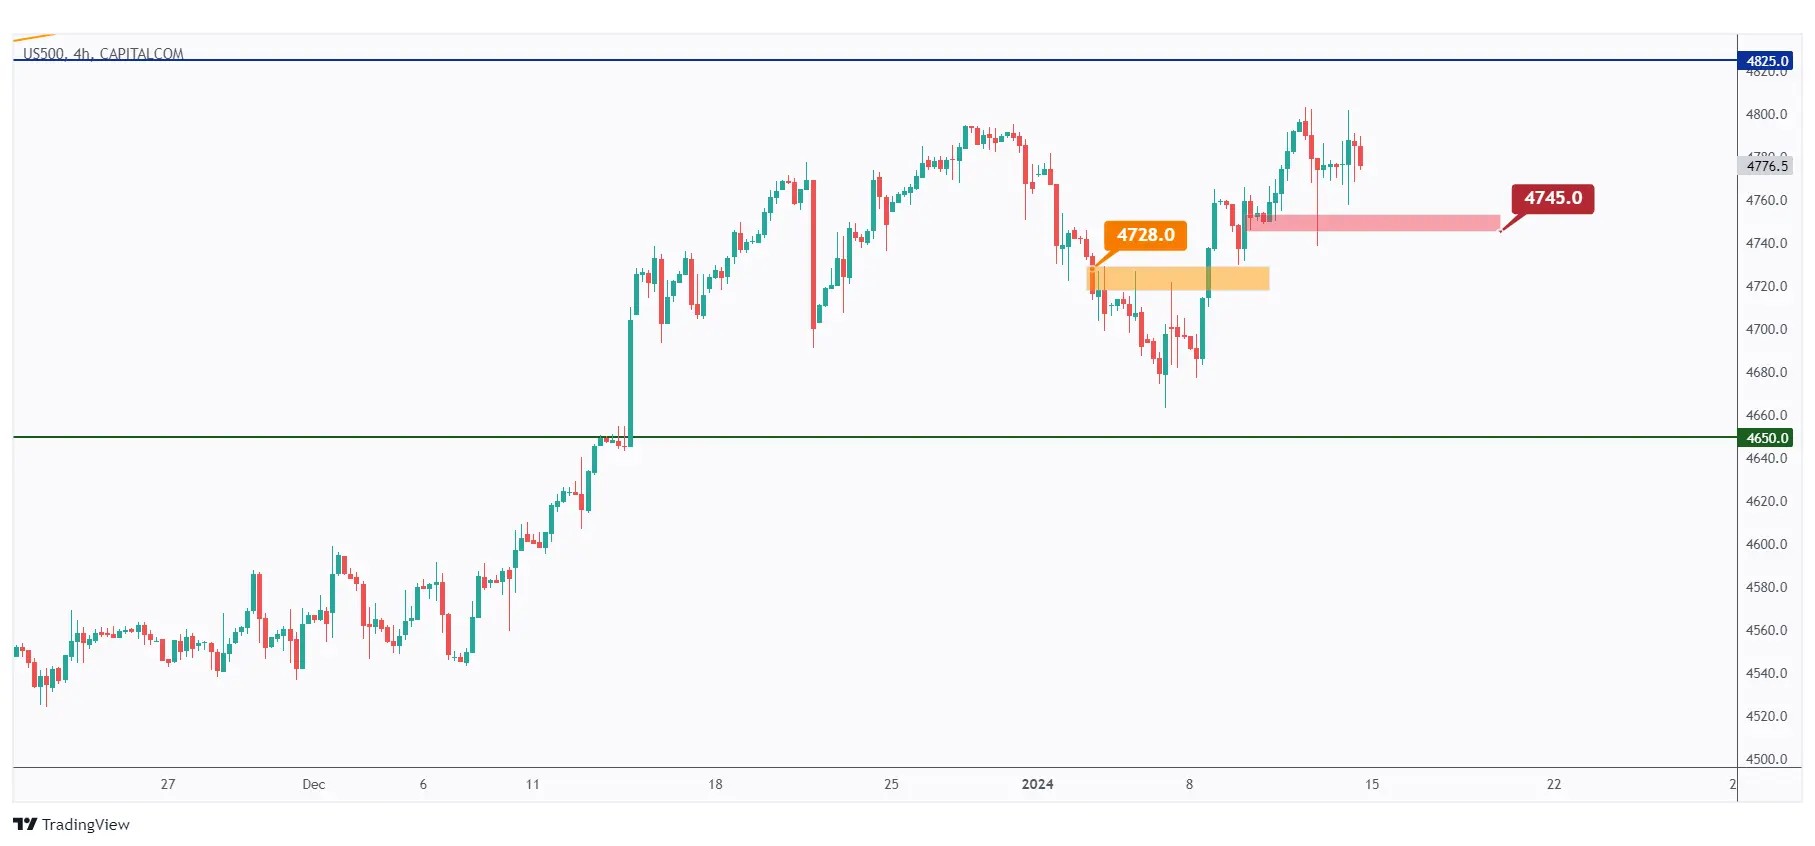
In the 4-hour timeframe, in accordance with our analysis from last week, the bulls asserted dominance this week by surpassing the previous significant high marked in orange at $4728.
The bulls are expected to maintain control unless there is a downward break below the last low at $4745. If this occurs, a potential movement towards the $4650 support is anticipated.
We consistently monitor the DXY - USD Index as part of our routine analysis. This is crucial because the value of nearly all assets, including BTC/USD, is closely tied to the USD, which serves as the benchmark currency in the financial market.
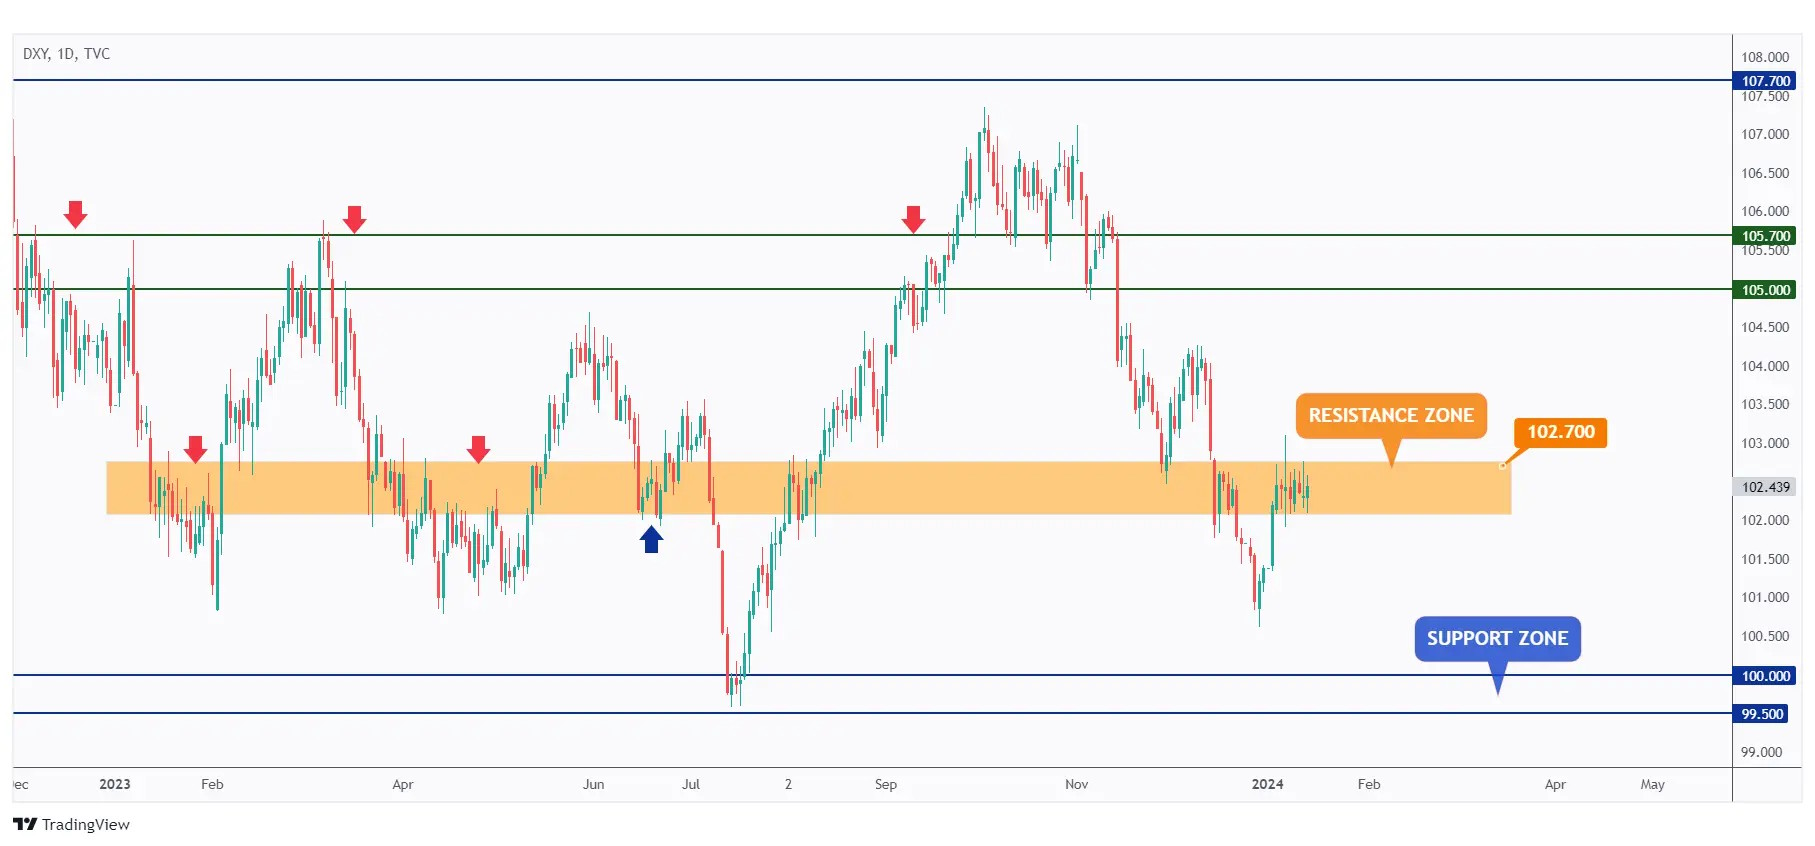
The DXY is currently consolidating within a tight range near the resistance zone highlighted in orange, indicating an imminent potential for bearish control.
Should the resistance at $102.7 be breached to the upside, we anticipate a medium-term shift in momentum from bearish to bullish.
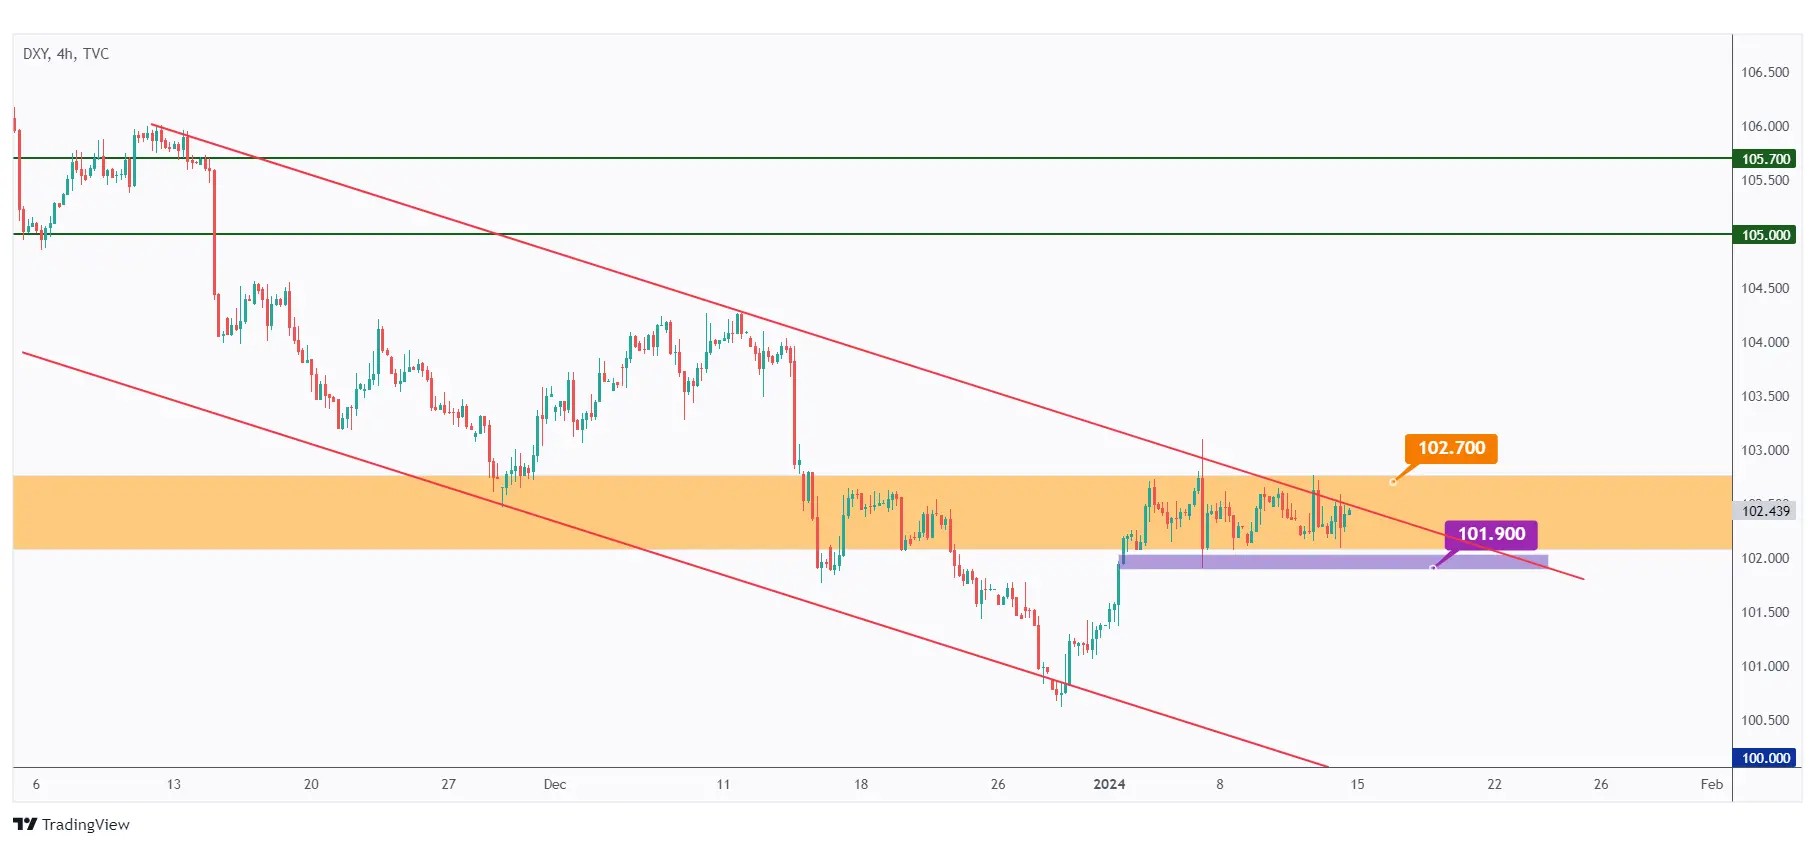
In the 4-hour timeframe, the prevailing bearish trend of the DXY is evident as it continues to trade within the descending channel outlined in red.
The bias is inclined to remain bearish unless there is an upward breakthrough of both the channel and the $102.7 resistance. In such a scenario, an anticipated movement towards the $105 resistance level is likely.
Conversely, if the previous major low at $101.9 is breached to the downside, a continuation towards the lower boundary of the channel and the $100 round number is expected.
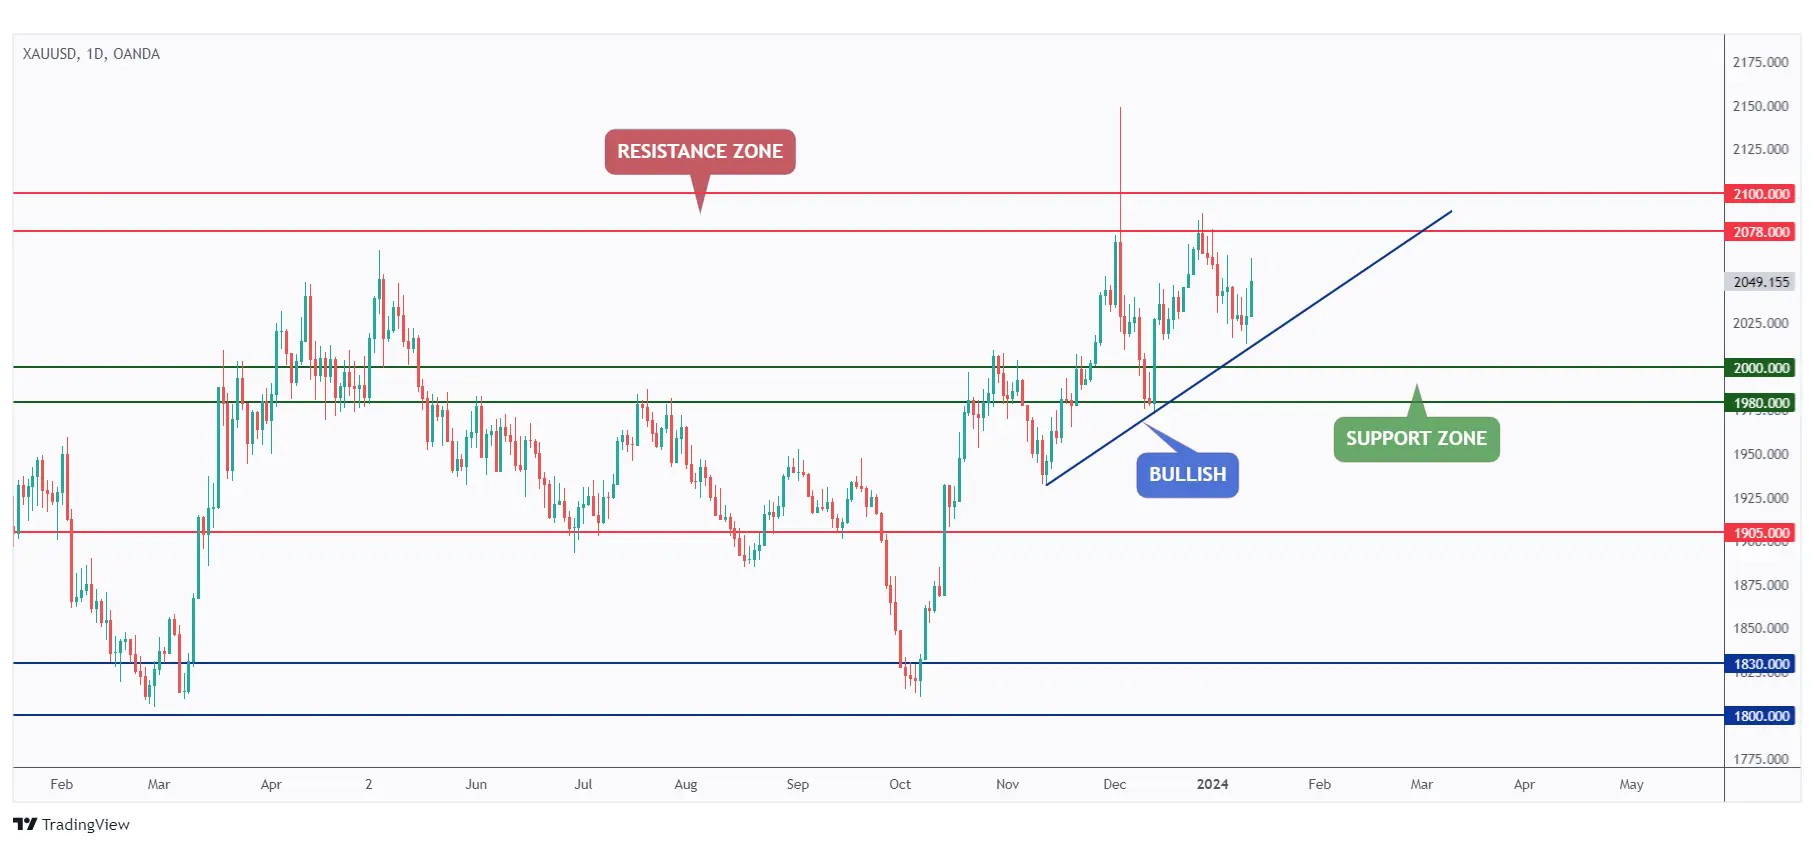
This week, Gold rebounded from our lower blue trendline and experienced an upward movement. We now anticipate a bullish continuation, targeting the $2100 resistance zone once again.
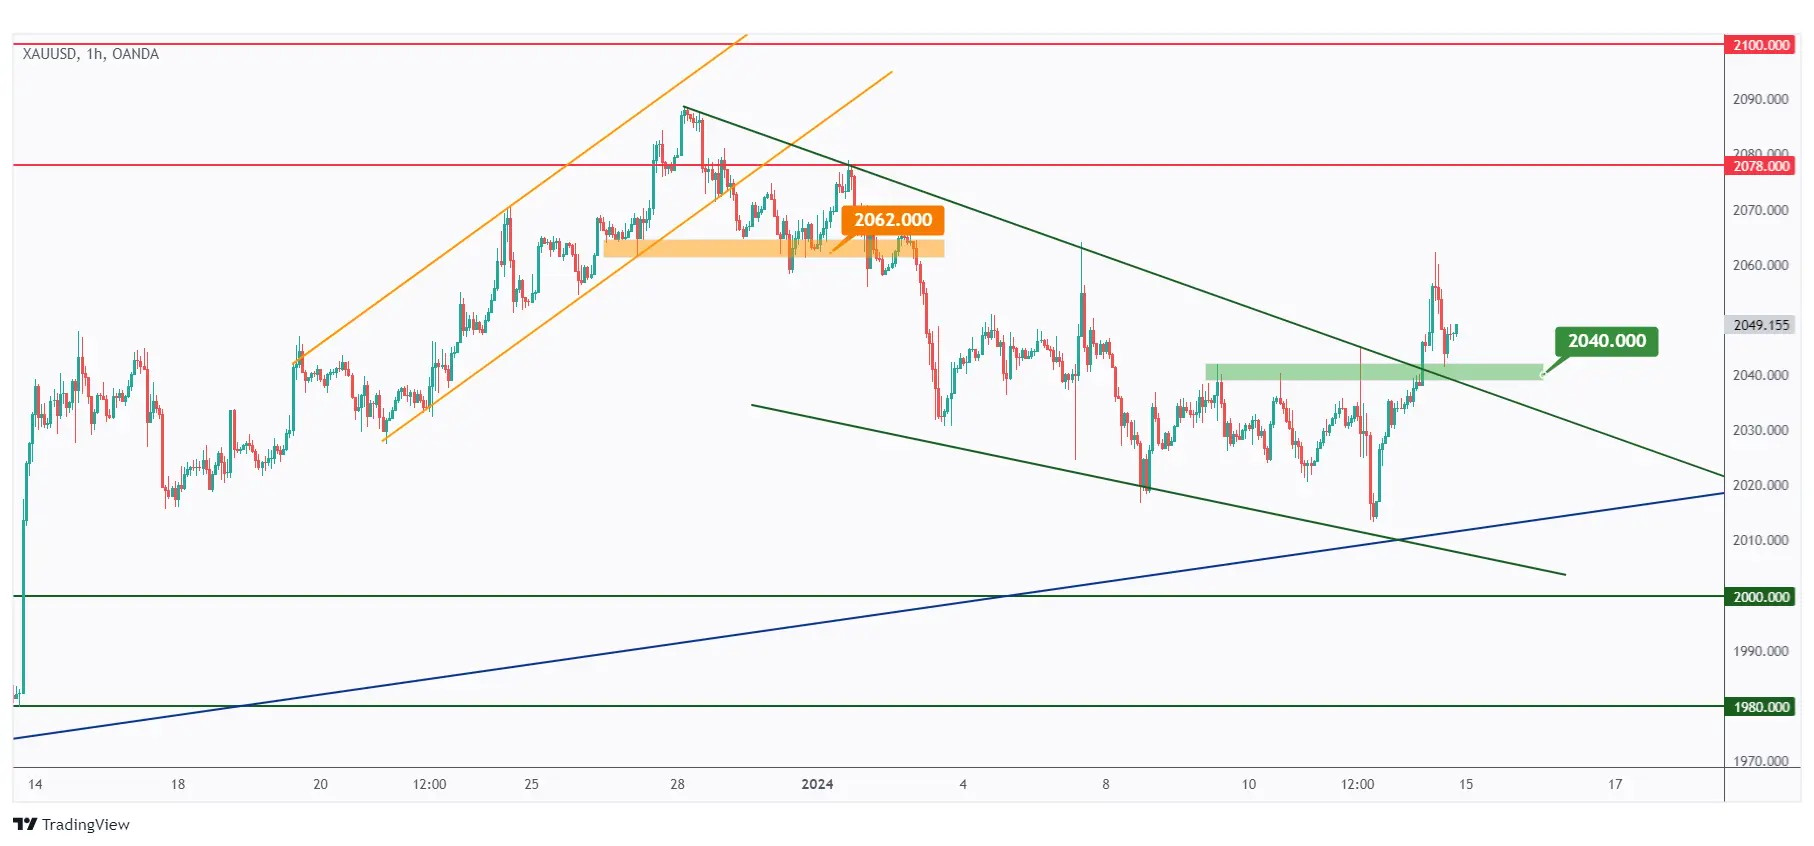
In the 1-hour timeframe, the momentum has shifted from bearish to bullish as Gold successfully surpassed the last major high marked in green at $2040.
As long as the $2040 level holds, we anticipate a bullish continuation towards the red resistance.
USDT.D, Bitcoin and Ethereum analysis
As a standard practice, I commence my analysis with USDT.D as it serves as a crucial indicator of traders' sentiment. USDT.D offers valuable insights into whether traders are optimistic, signaling increased investment in cryptocurrencies, or pessimistic, indicating a shift towards stablecoins.
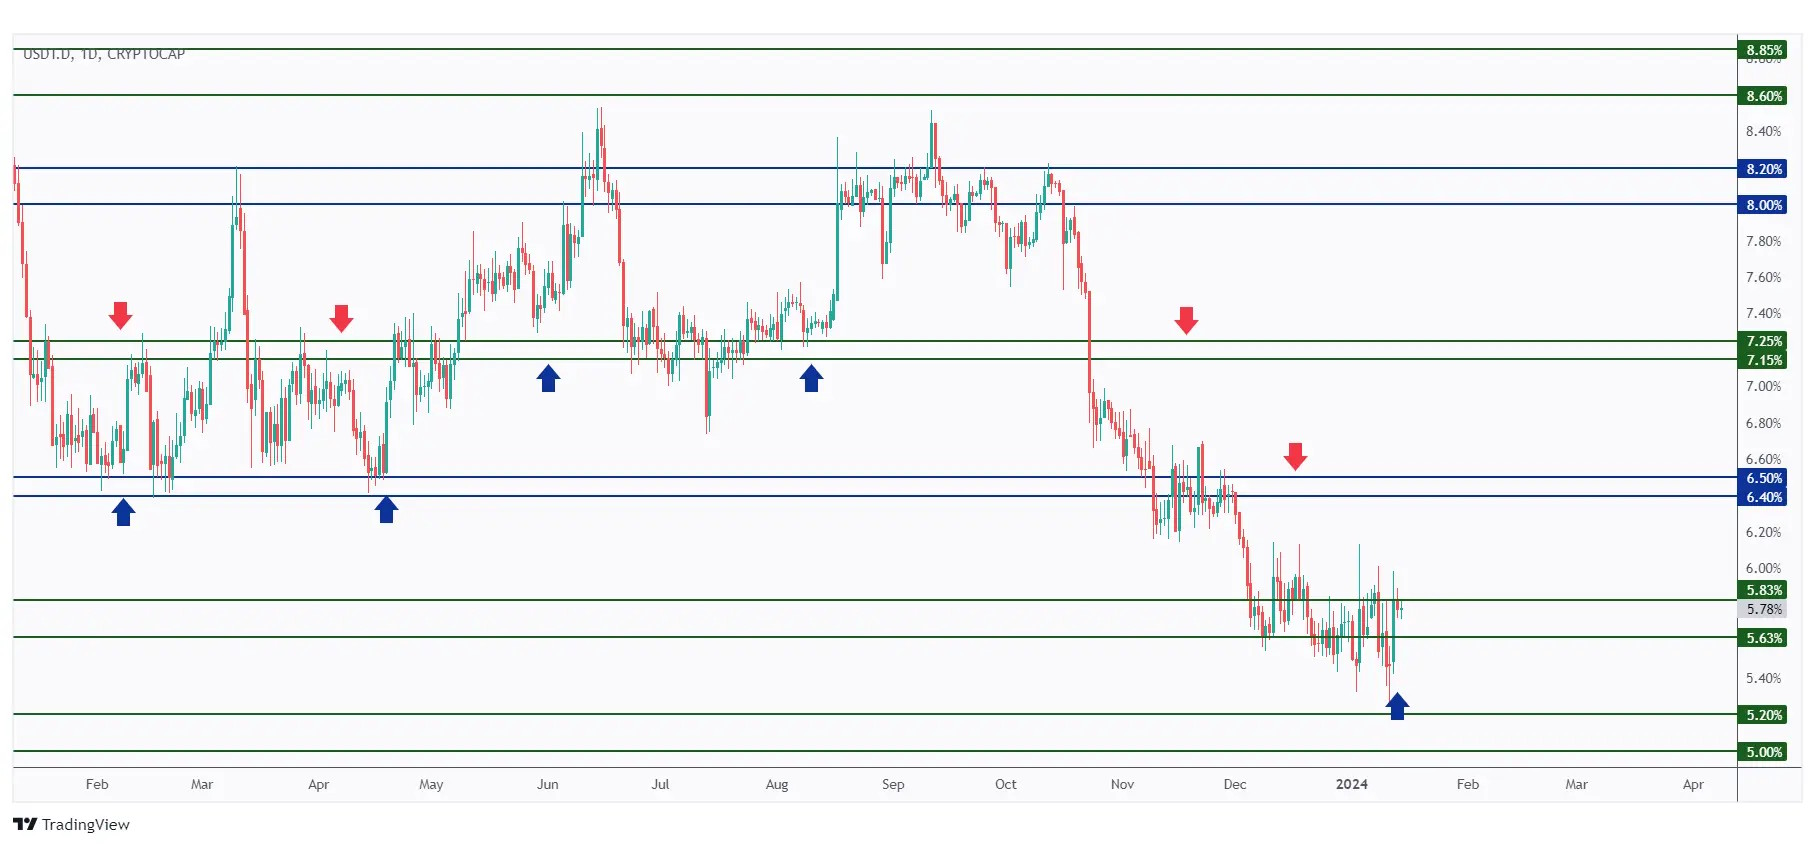
USDT.D is currently consolidating within a tight range around a strong resistance.
For the bulls to establish control, a daily candle close above 5.96% is necessary, although this might not bode well for the broader crypto market.
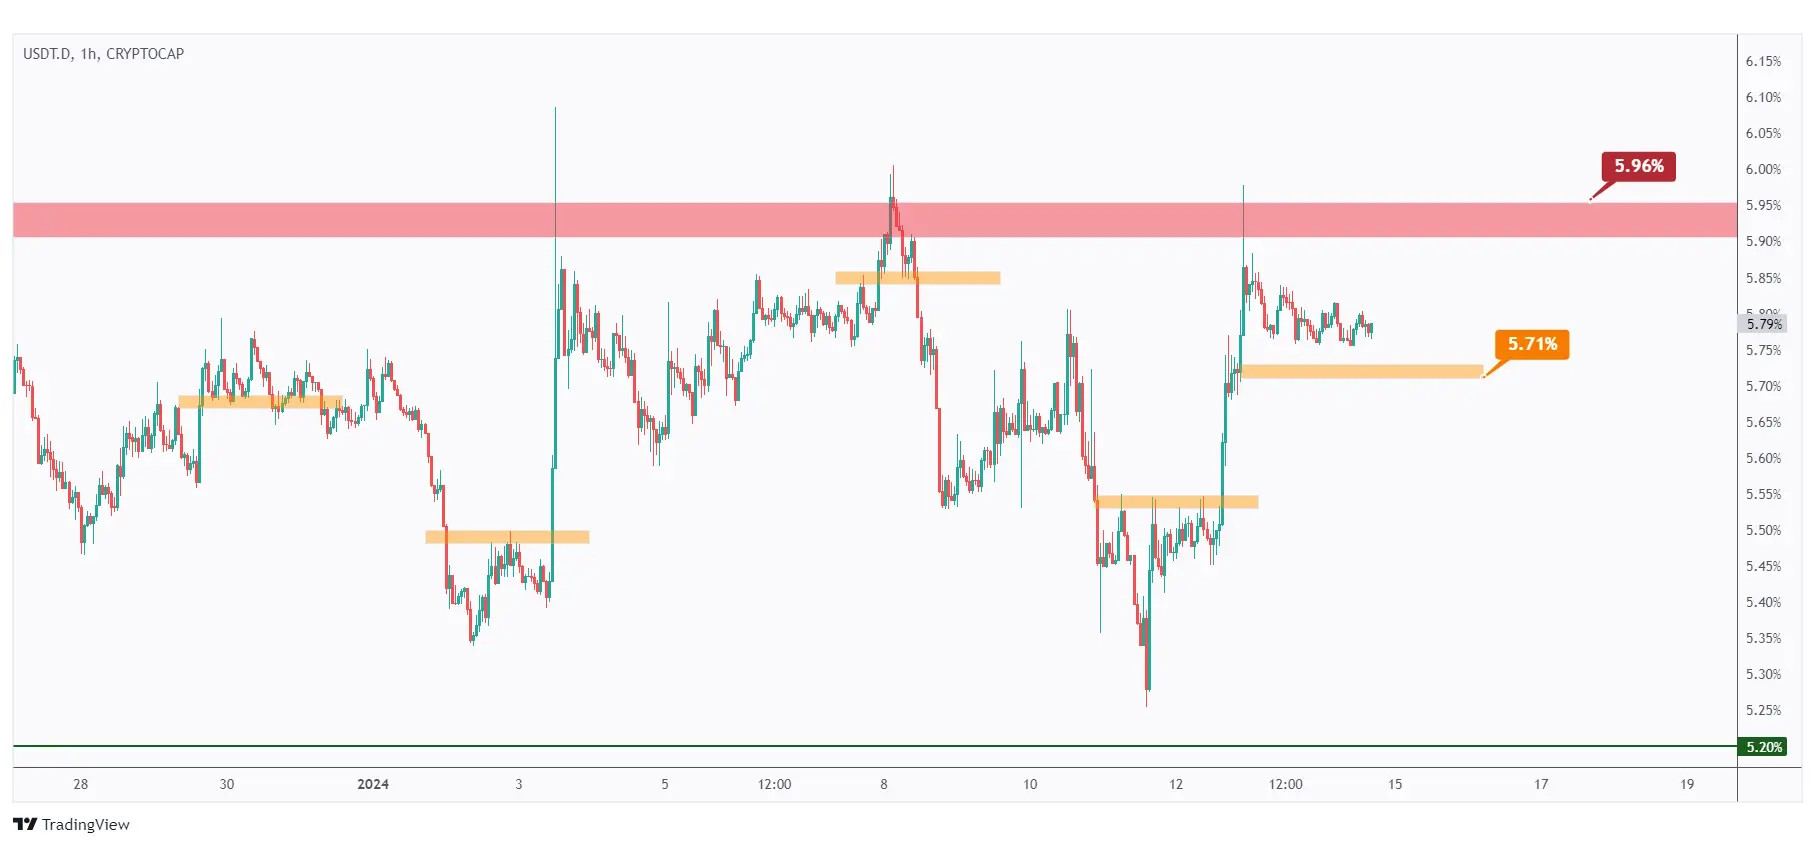
In the 1-hour timeframe, the overall bias is bullish from a short-term perspective. However, we are currently at the upper boundary of the range.
For the bulls to establish dominance from a medium-term perspective, a breakout above 5.96% is required.
In parallel, if the lower limit at 5.71% is breached downward, we anticipate short-term bearish control, potentially pushing USDT.D back to the lower boundary of the range.
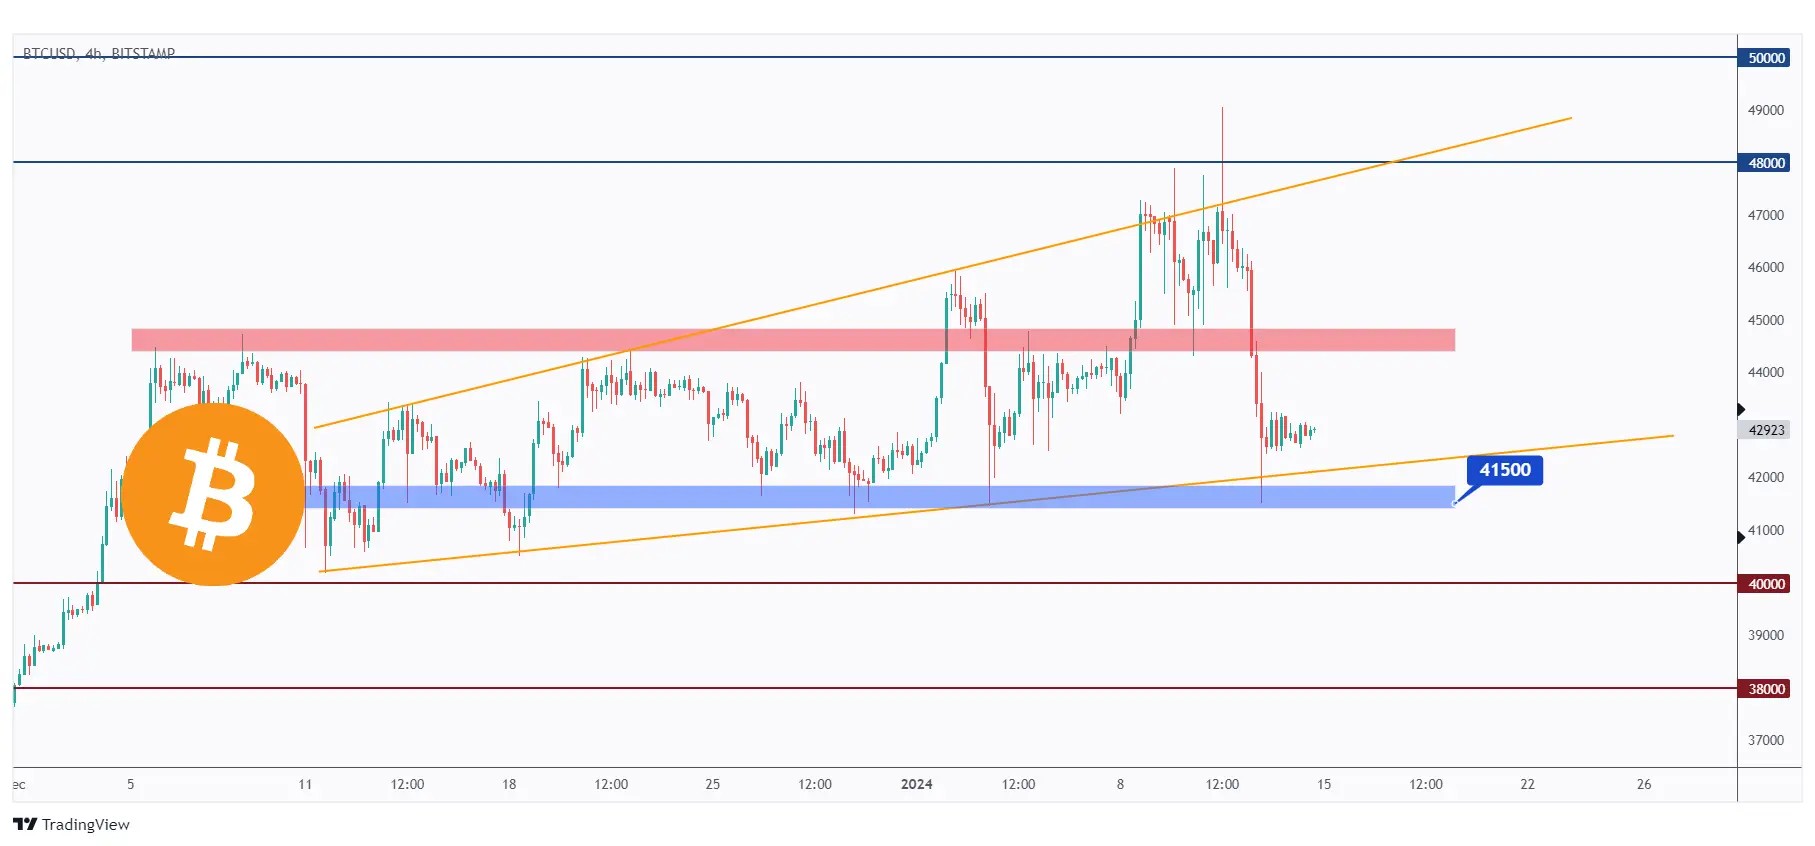
After being rejected by the $48,000 - $50,000 resistance zone and the upper boundary of the orange channel, BTC traded lower towards the lower boundary of the channel.
As long as the $41,500 support holds, we will be on the lookout for buy setups on lower timeframes.
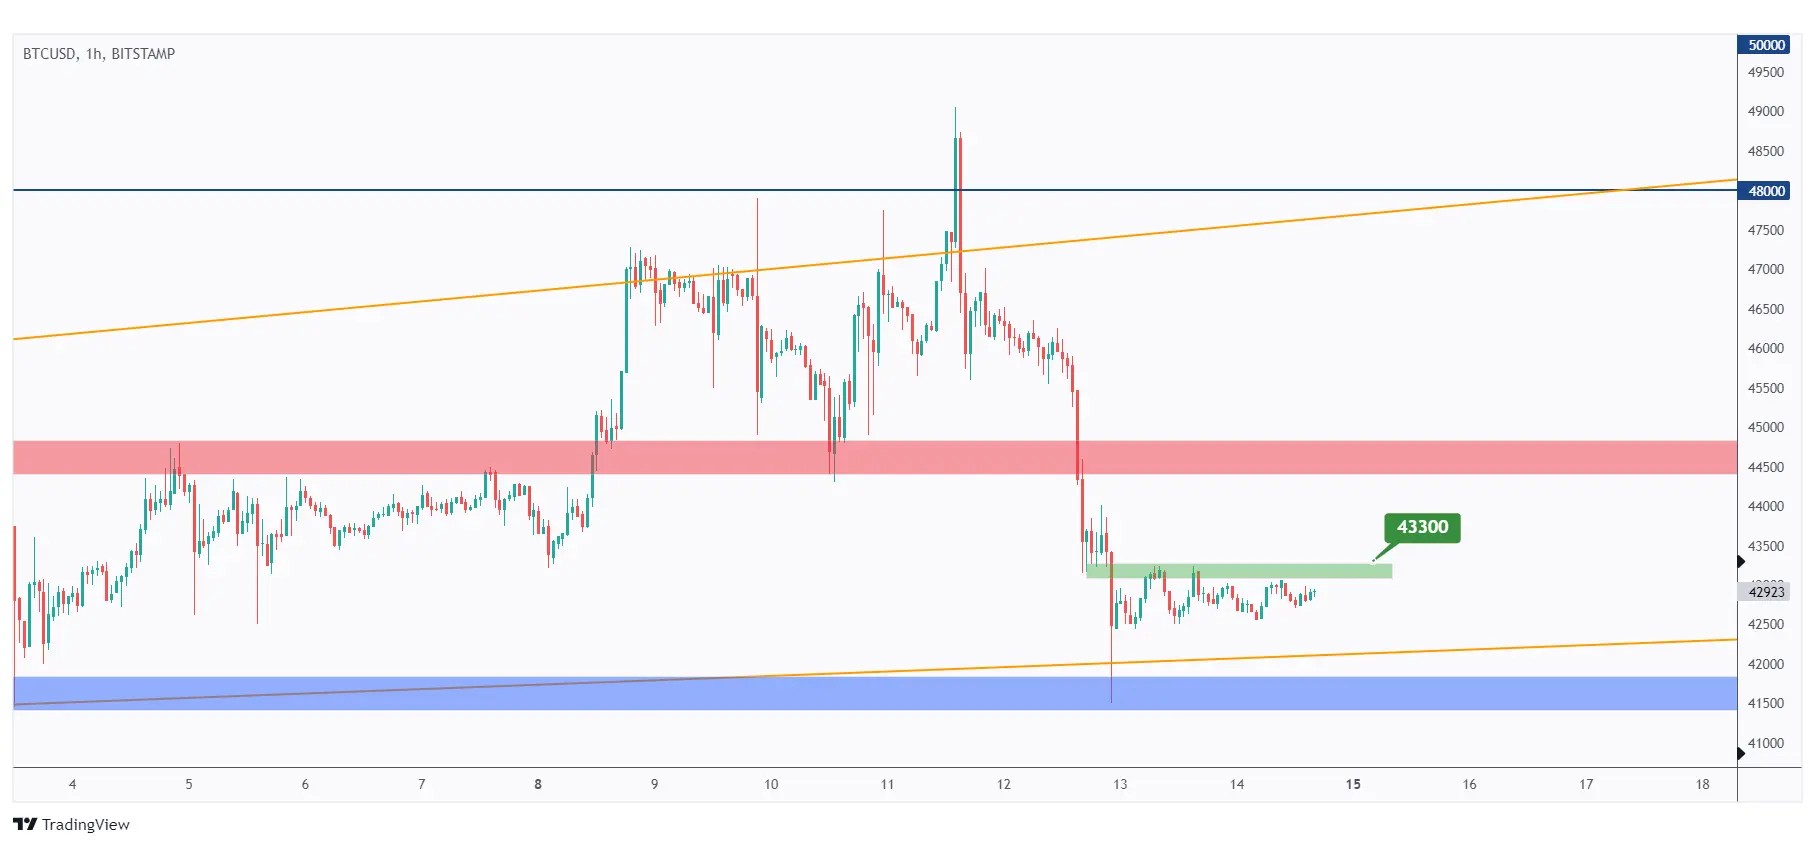
In the 1-hour timeframe, BTC has been consolidating within a tight range.
For the bulls to regain control from a short-term perspective, a breakout above the $43,300 previous high in green is essential.
Meanwhile, BTC could maintain a bearish stance and potentially test the $41,500 support.
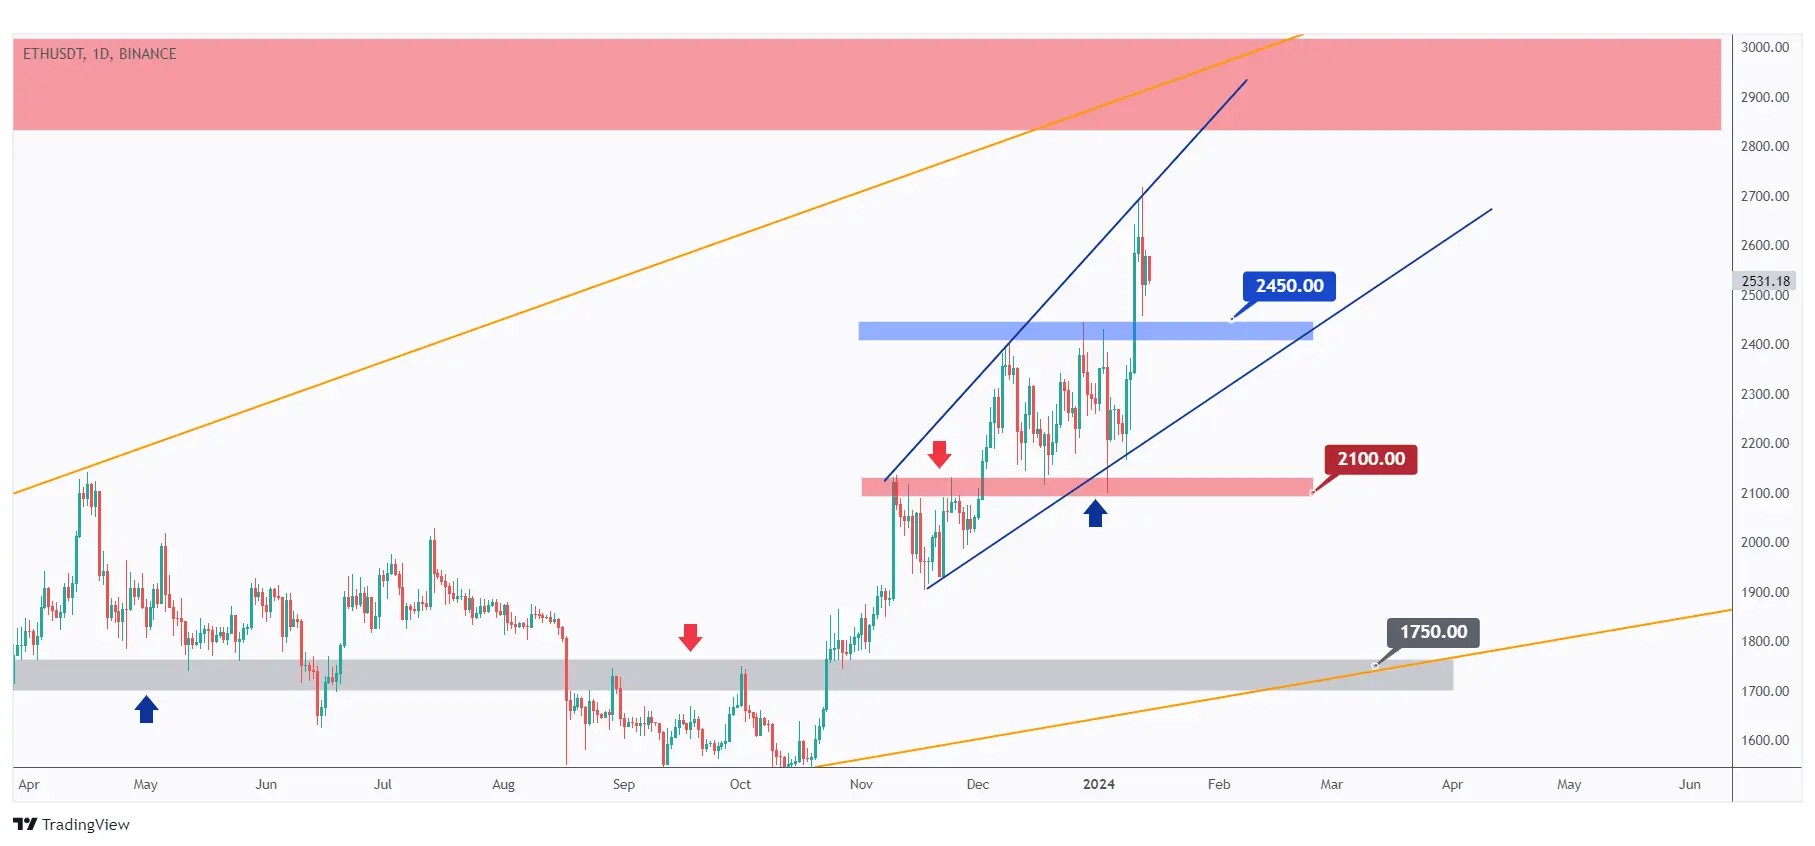
This week, ETH rebounded from the $2100 support and experienced an upward movement. Currently, it is positioned near the upper boundary of the blue wedge pattern.
As ETH approaches the $2450 level once again, we will be on the lookout for trend-following buy setups on lower timeframes.
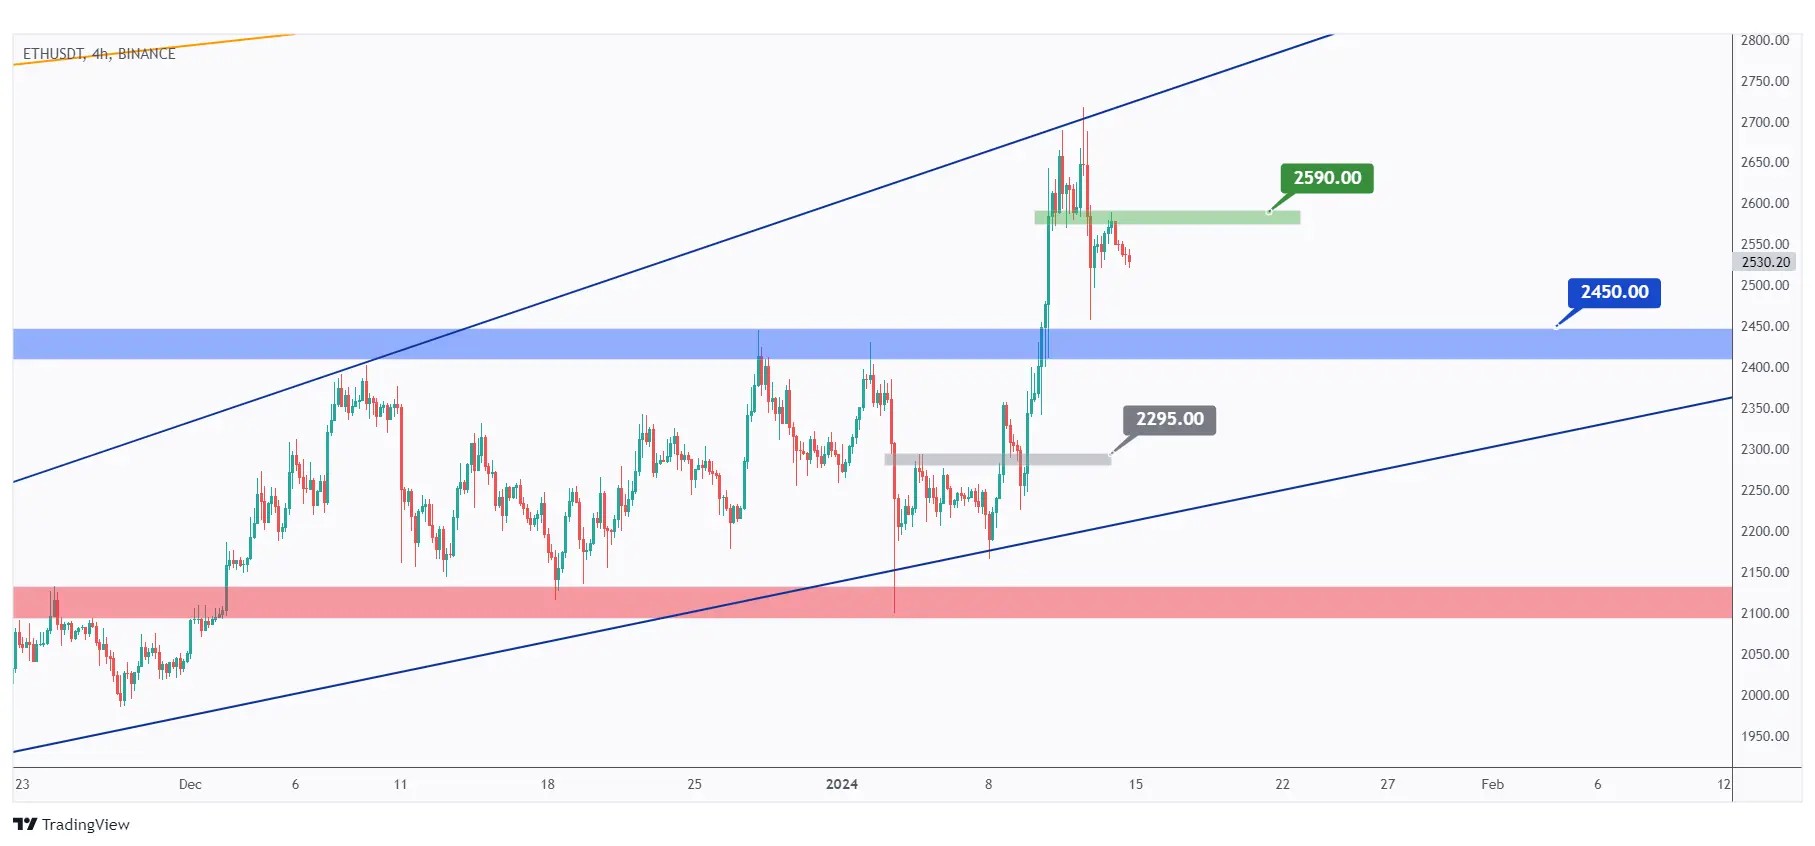
In the 4-hour timeframe, in line with our analysis from last week, the bulls took over by surpassing the last major high marked in gray at $2295.
Following the rejection of the upper blue trendline, ETH has entered a correction phase.
For the bulls to regain control and initiate the next upward impulse movement, a breakout above the last minor high at $2590 is required. In the meantime, ETH could remain bearish and potentially test the $2450 support before resuming higher trading.
Quotes / Advices
Trade like water by embracing adaptability and flexibility.
Just as water flows with the path of least resistance, be open to changing market conditions.
Prioritize risk management, diversify your portfolio, and set clear rules for consistent trading.
Go with the flow of market trends, exercising patience and avoiding impulsive decisions.
Stay informed through constant learning, and be resilient in the face of setbacks.
Maintain a balanced approach by diversifying your investments.
Closing Remarks
In summary, the crypto market witnessed a decline as Bitcoin (BTC) fell by 12% after rejecting the $50,000 resistance zone, impacting the entire market.
Despite the bearish trend, some altcoins maintained a bullish stance in the past 7 days. The Fear & Greed Index dropped from 71 to 60, signaling reduced optimism among traders.
In traditional markets, the US500 index rejected the $4650 level, with a potential breakout needed above $4825 for bullish control.
The DXY (USD Index) is consolidating near a resistance zone, hinting at a shift from bearish to bullish if $102.7 is breached. Gold rebounded, targeting the $2100 resistance.
USDT.D, a sentiment indicator, consolidated near strong resistance.
BTC faced rejection at $48,000 - $50,000, focusing on the $41,500 support.
Ethereum (ETH) rebounded from $2100, aiming for trend-following buy setups around $2450.