
elcome to another crypto market outlook for the 11th of February!
In this edition, we'll delve into major assets such as US500, DXY, Gold, Bitcoin, and Ethereum, highlighting critical levels and potential trade setups.
From Bitcoin approaching the $50,000 resistance to ETH remaining overall bearish, and the Fear & Greed Index signaling new records, this article covers it all.
Are you ready?
Today, we will cover the following topics:
- Market Heatmap and Fear and Greed Index
- US500, DXY and Gold Analysis
- USDT.D, Bitcoin and Ethereum Analysis
- Quotes / Advices
- Closing Remarks
Market Heatmap and Fear and Greed Index
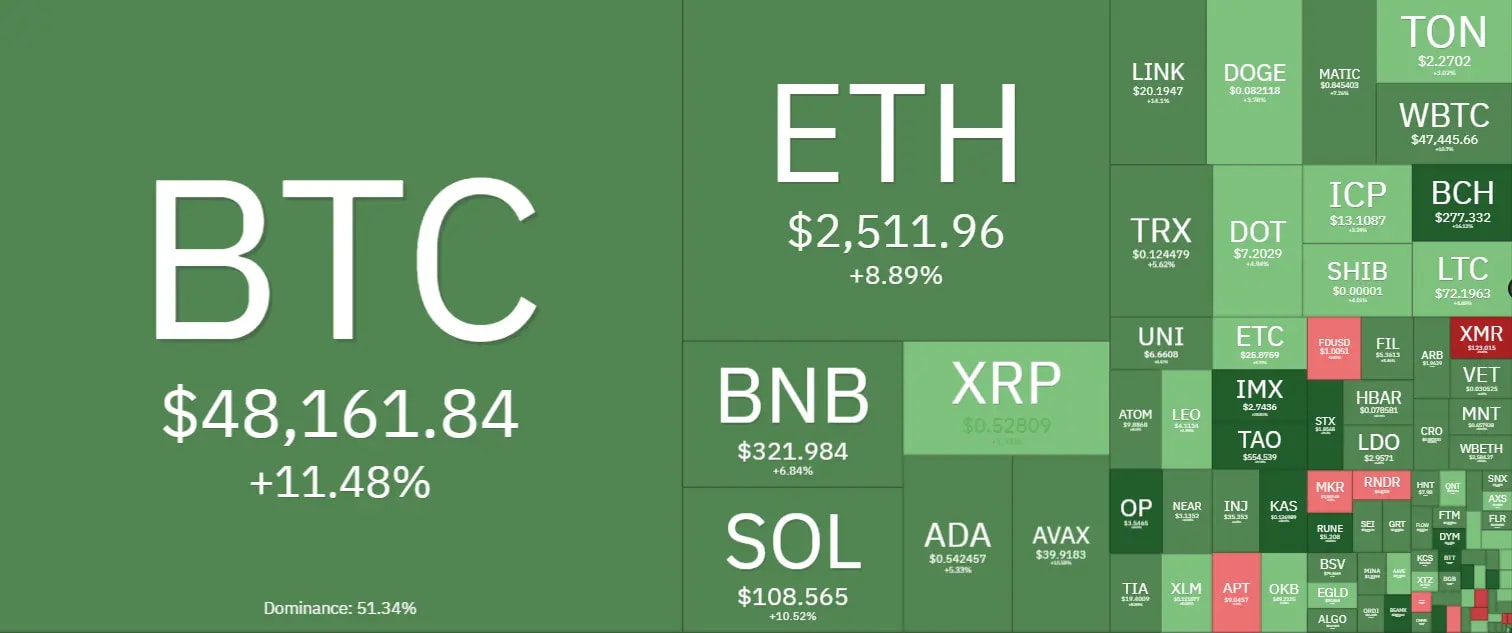
To initiate my research, I delved into the analysis by examining the market heatmap, which provided a comprehensive overview of the entire cryptocurrency market.
After breaking above the $43,700 resistance zone, BTC surged by 11.48%, dragging the entire crypto market up with it.
On the heatmap, we can clearly see that almost all altcoins ended the week with massive gains, including ETH, which is up by 8.89%.
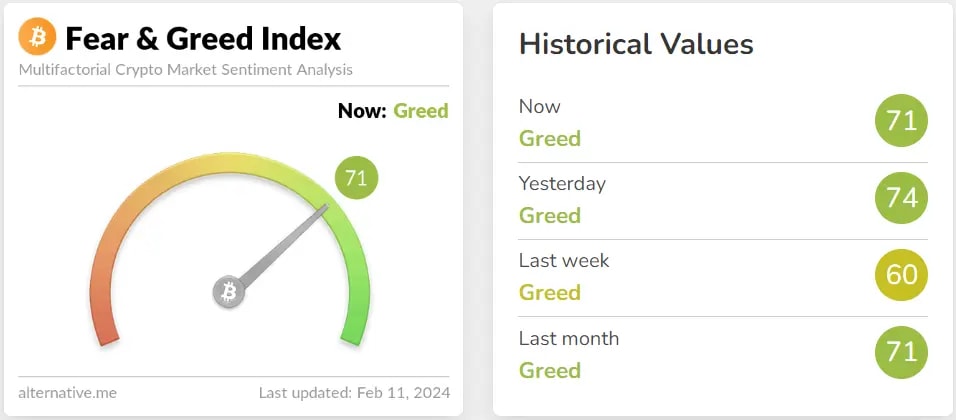
The Fear & Greed Index has consistently signaled "Greed" throughout the entire week, especially in the last 2 days, as the meter recorded new highs at 74. This suggests that traders remain optimistic following the approval of Bitcoin ETFs and with the halving on the horizon.
US500, DXY and Gold analysis
We consistently monitor the US500 index to assess the current market sentiment. This practice is crucial because the cryptocurrency market often exhibits a significant correlation with the stock market, and this interconnection can impact its fluctuations.
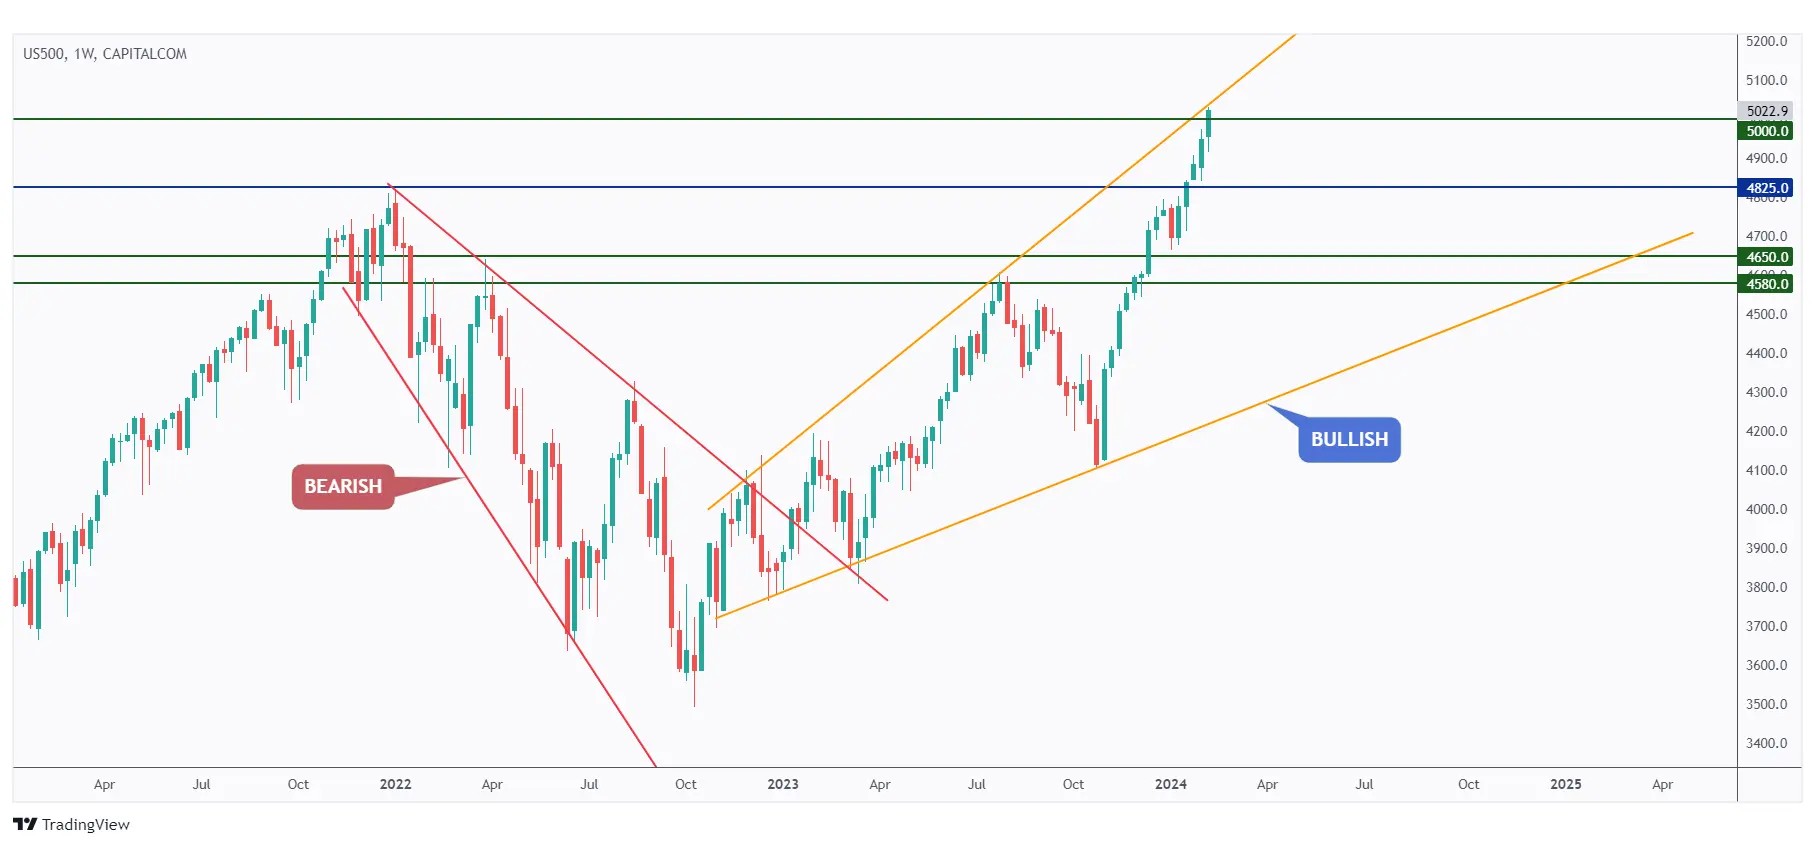
The US500 is still hovering around the upper bound of the orange wedge pattern and the new all-time high of $5000.
As long as this resistance holds, we can expect the bears to kick in anytime soon to initiate a correction.
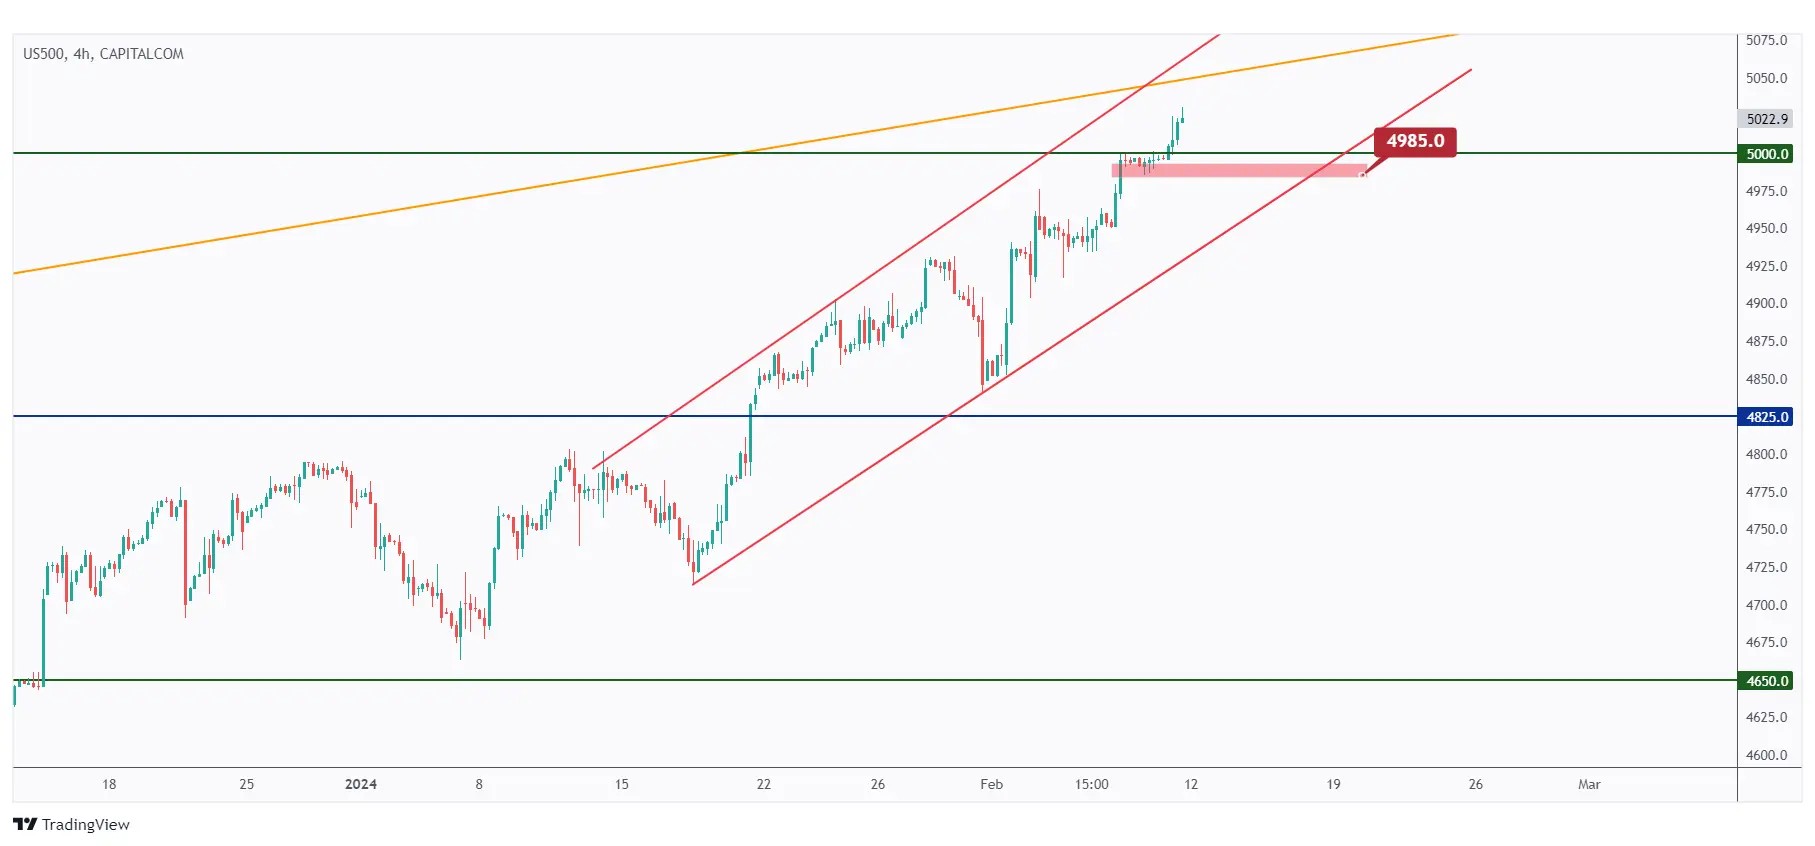
In the 4-hour timeframe, the bulls will maintain control as long as the last major low remains unbroken.
However, if the $4985 low is breached downward, a correction is anticipated, potentially leading to a movement towards the $4850 demand zone.
We consistently monitor the DXY - USD Index as part of our routine analysis. This is crucial because the value of nearly all assets, including BTC/USD, is closely tied to the USD, which serves as the benchmark currency in the financial market.
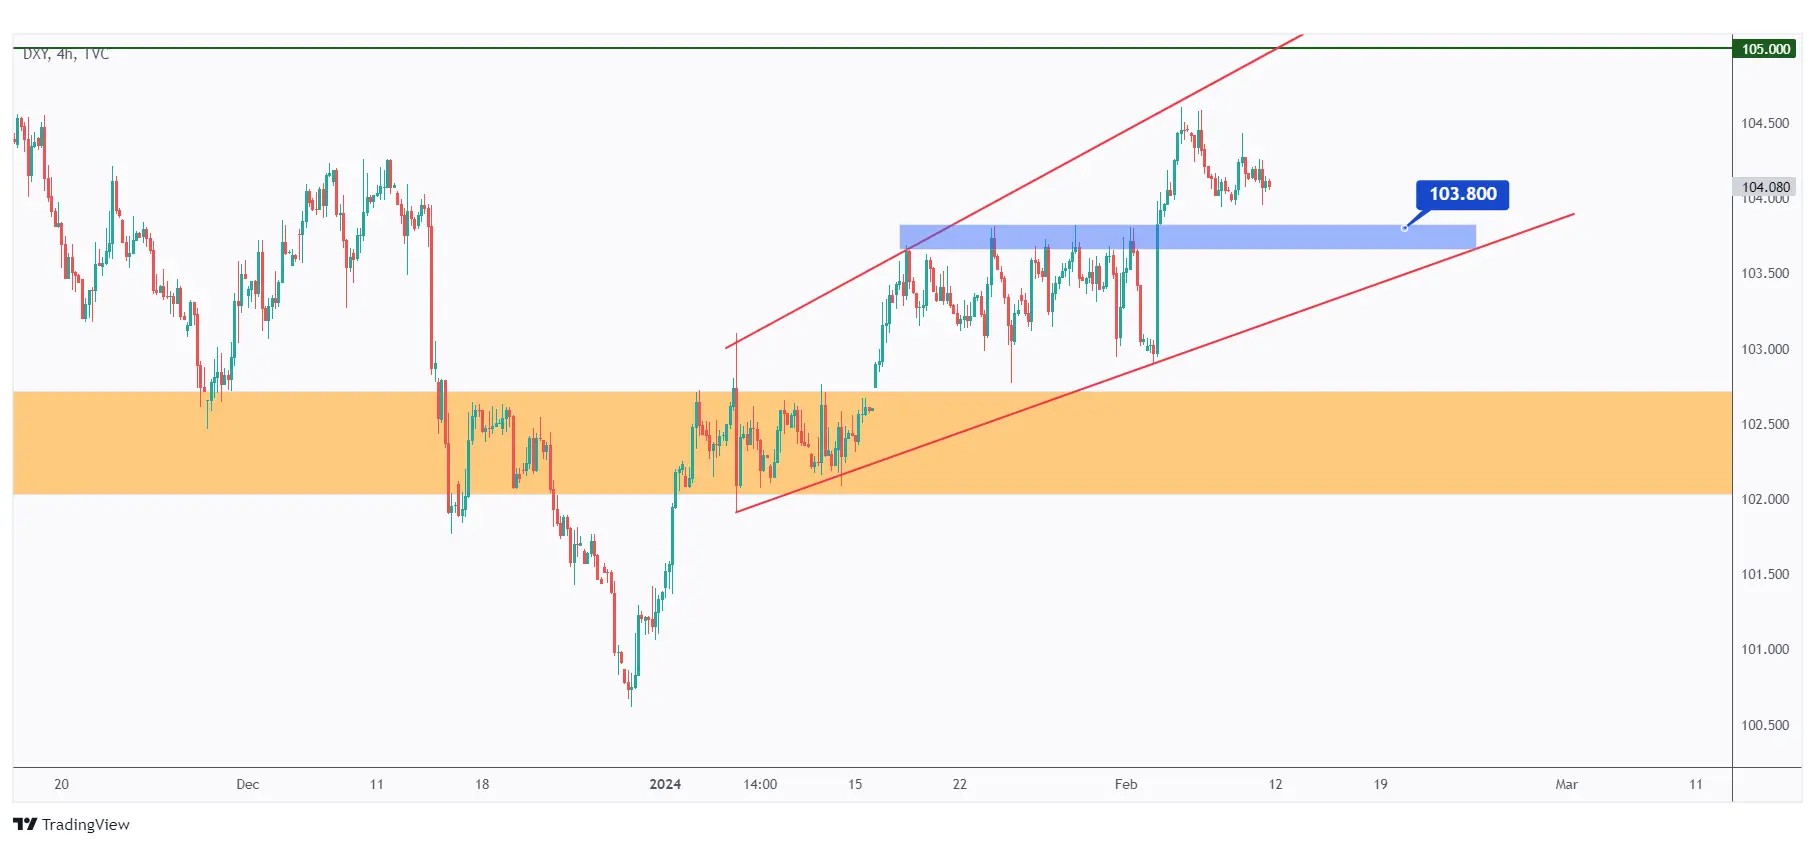
DXY has been overall bullish, trading inside the rising channel marked in red.
Currently, DXY is in a correction phase and is approaching the previous structure at $103.8.
As long as this structure holds, we will be looking for trend-following buy setups on lower timeframes.
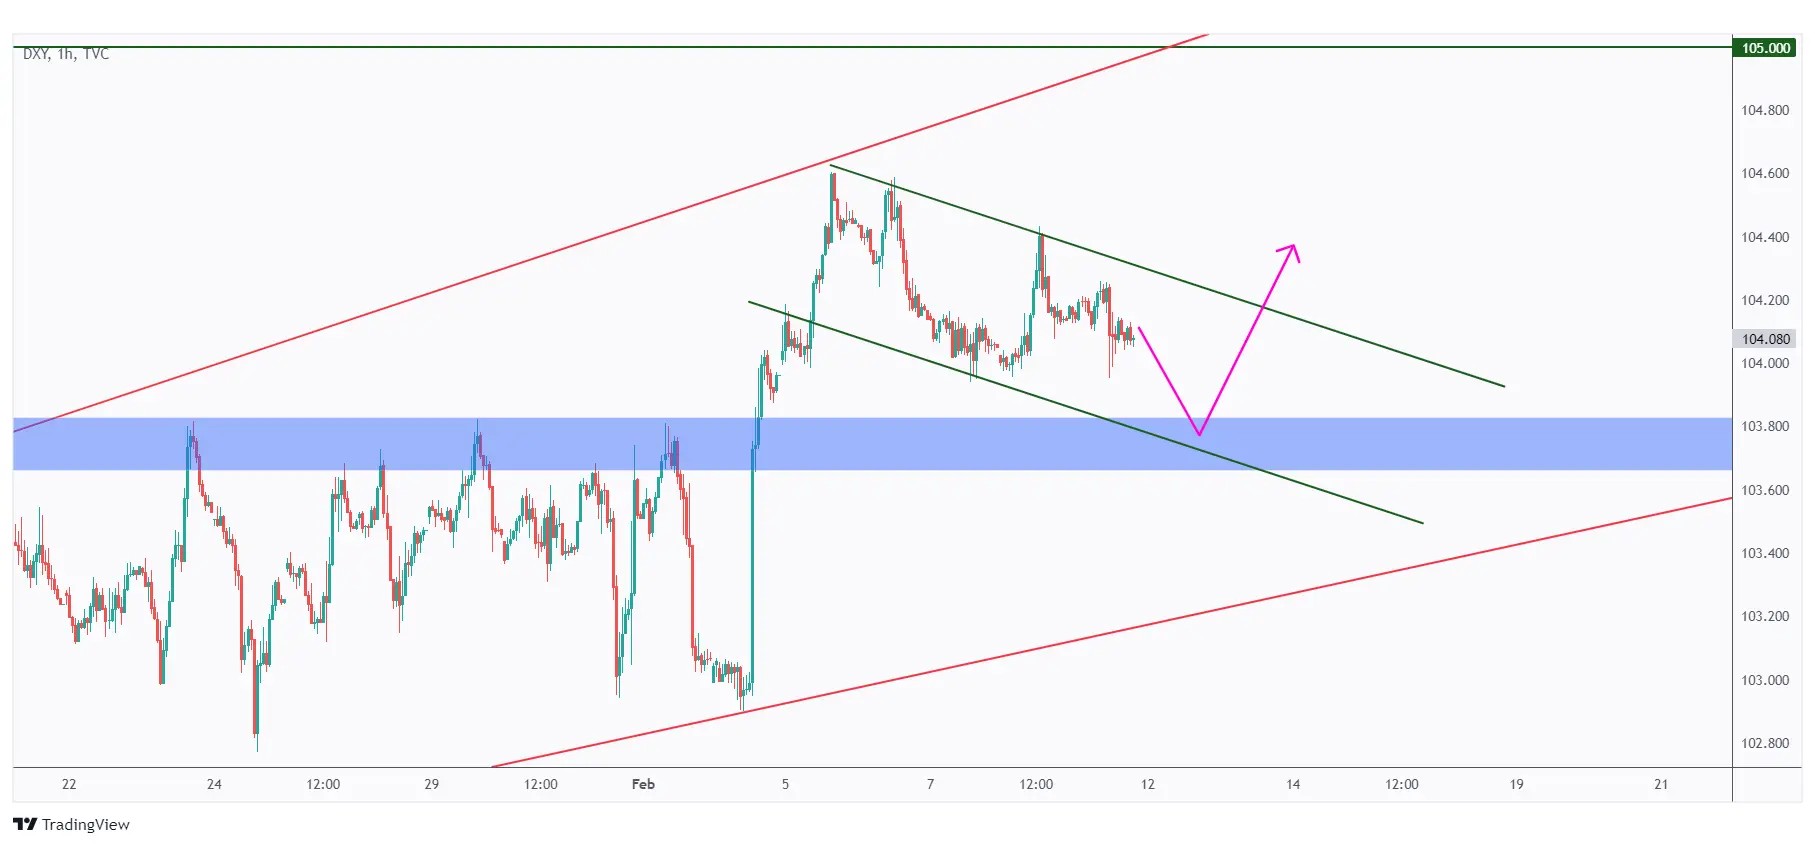
In the 1-hour timeframe, DXY has been trading within the falling channel highlighted in green. For the bulls to take control and initiate the next upward impulse movement, we require a breakout above the channel.
Meanwhile, DXY could remain bearish in the short term and might continue to trade lower to test the blue structure.
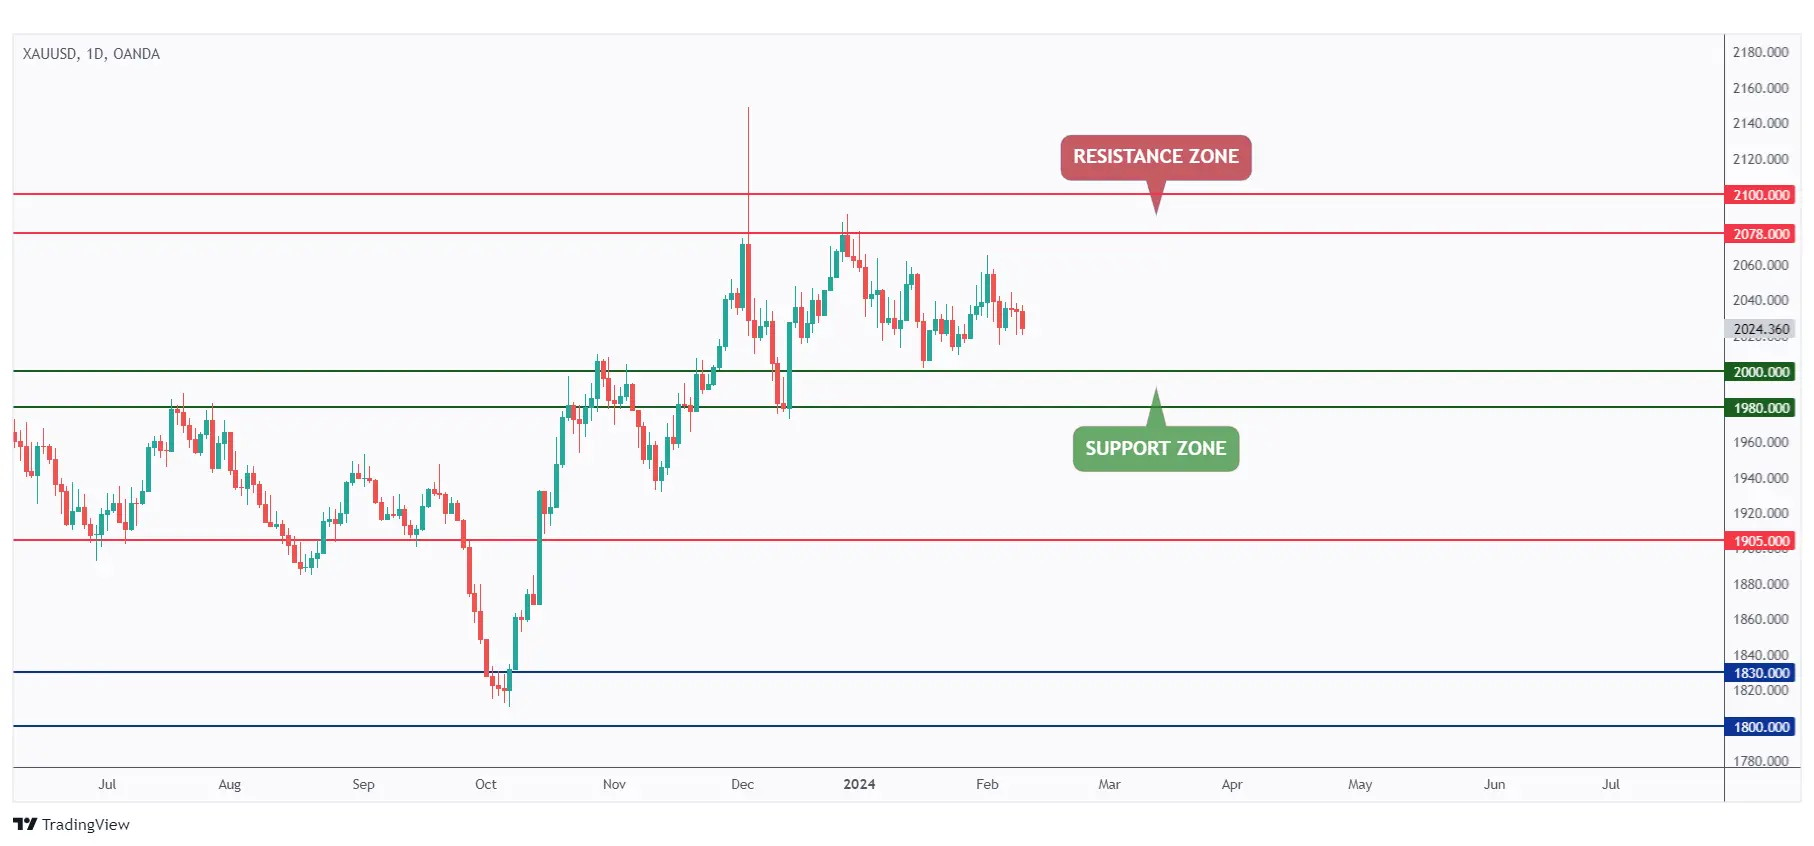
Gold has been fluctuating within a range bounded by the $2000 support and $2100 resistance levels.
Currently, Gold is approaching the lower bound of the range, so we will actively look for buy setups on lower timeframes.
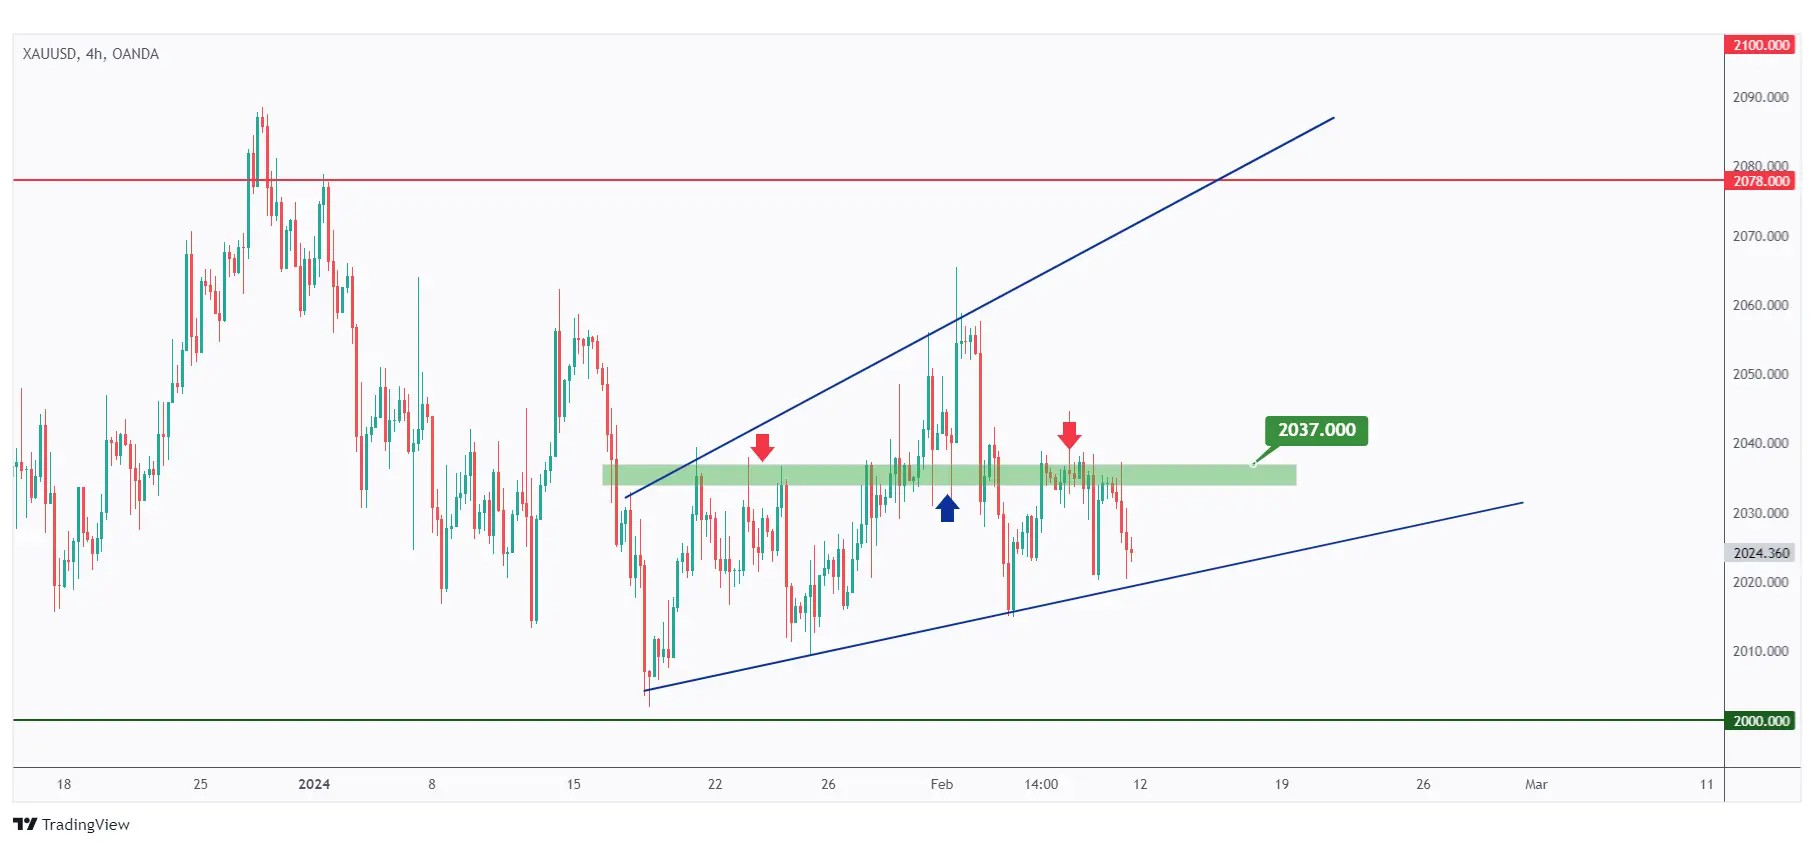
In the 4-hour timeframe, for the bulls to take over and trigger the next upward impulse movement, a breakout above the structure highlighted in green at $2037 is necessary.
In such an event, a movement towards the upper boundary of the blue wedge pattern and the $2078 resistance level would be anticipated.
USDT.D, Bitcoin and Ethereum analysis
As a standard practice, I commence my analysis with USDT.D as it serves as a crucial indicator of traders' sentiment. USDT.D offers valuable insights into whether traders are optimistic, signaling increased investment in cryptocurrencies, or pessimistic, indicating a shift towards stablecoins.
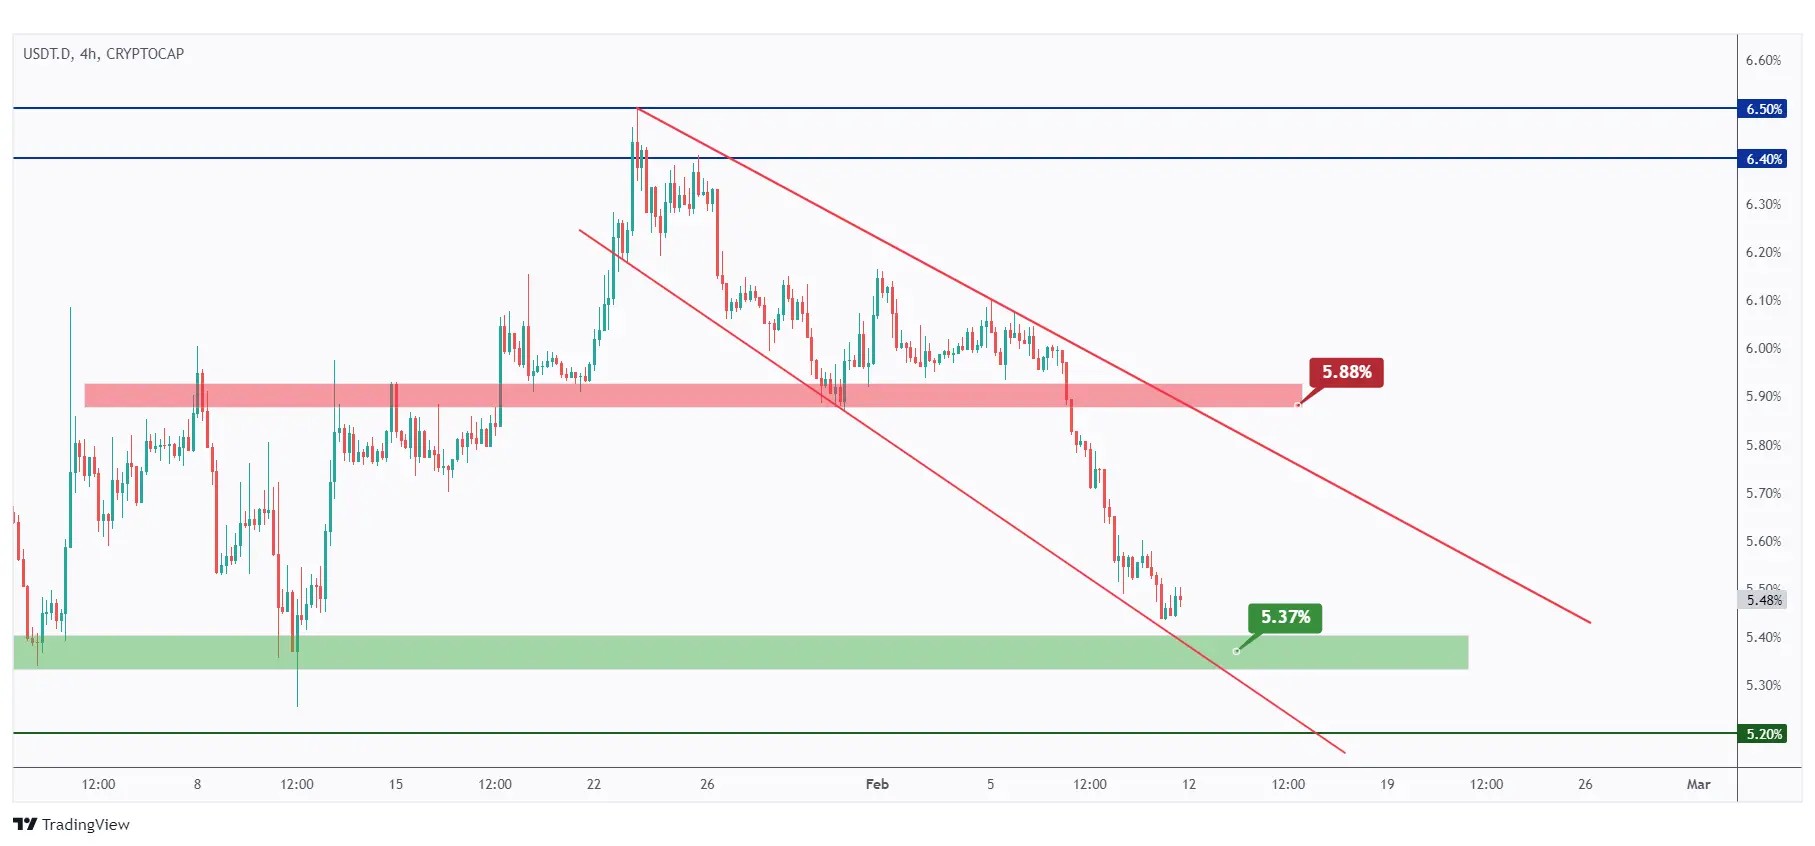
After breaking below the 5.88% support, USDT.D traded lower and is currently approaching a strong support zone at 5.37%.
As long as the 5.37% support holds, we anticipate the bulls to kick, which would have a negative impact on the overall sentiment in the crypto market.
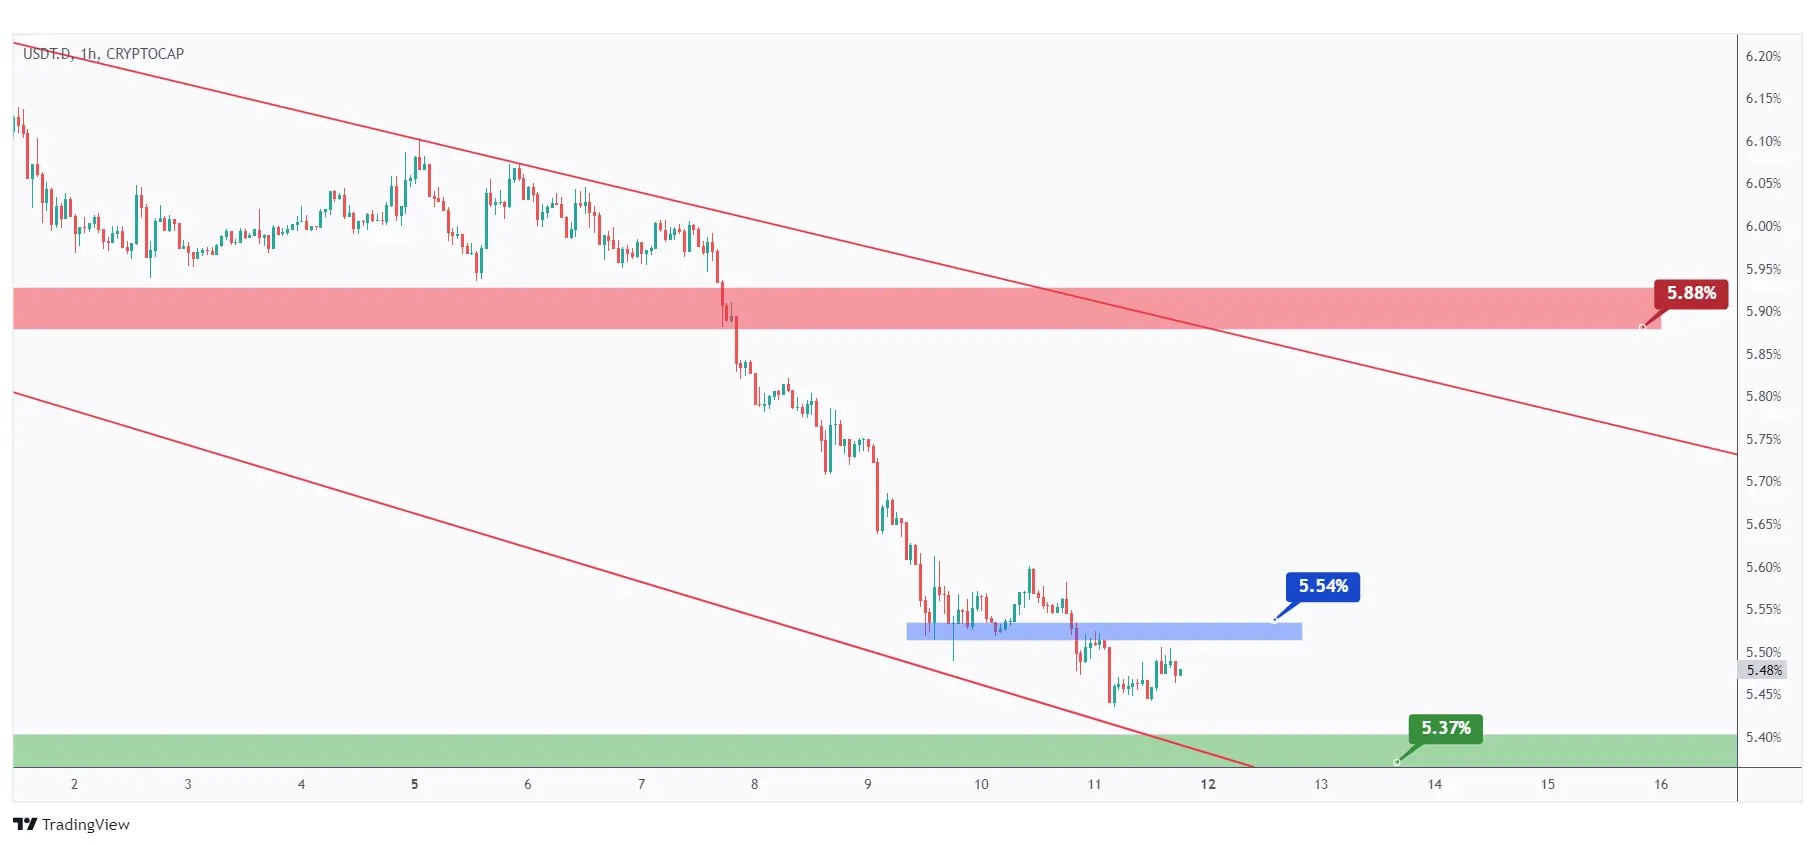
In the 1-hour timeframe, for the bulls to take control, a break above the last major high at 5.54% is required.
In this scenario, a movement towards the upper boundary of the red wedge pattern would be anticipated.
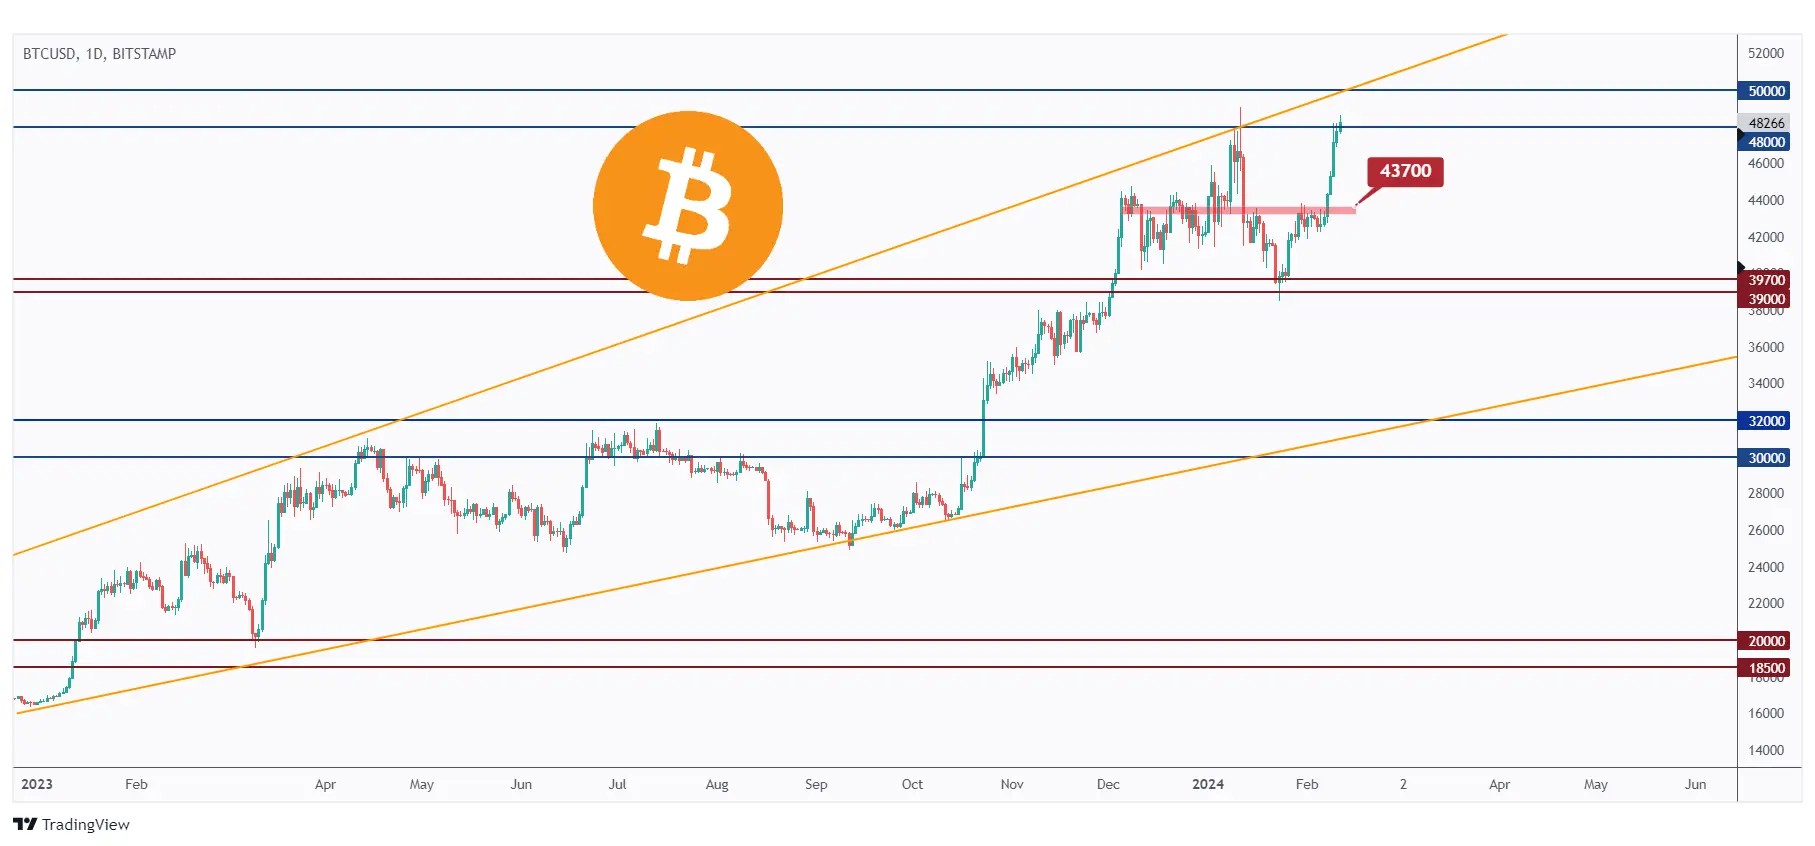
As per our previous analysis, BTC broke above the red structure at $43,700 and continued to trade higher.
Currently, BTC is hovering around the upper boundary of the orange wedge pattern and the $50,000 resistance zone. Therefore, we anticipate the bears to step in and initiate a correction phase.
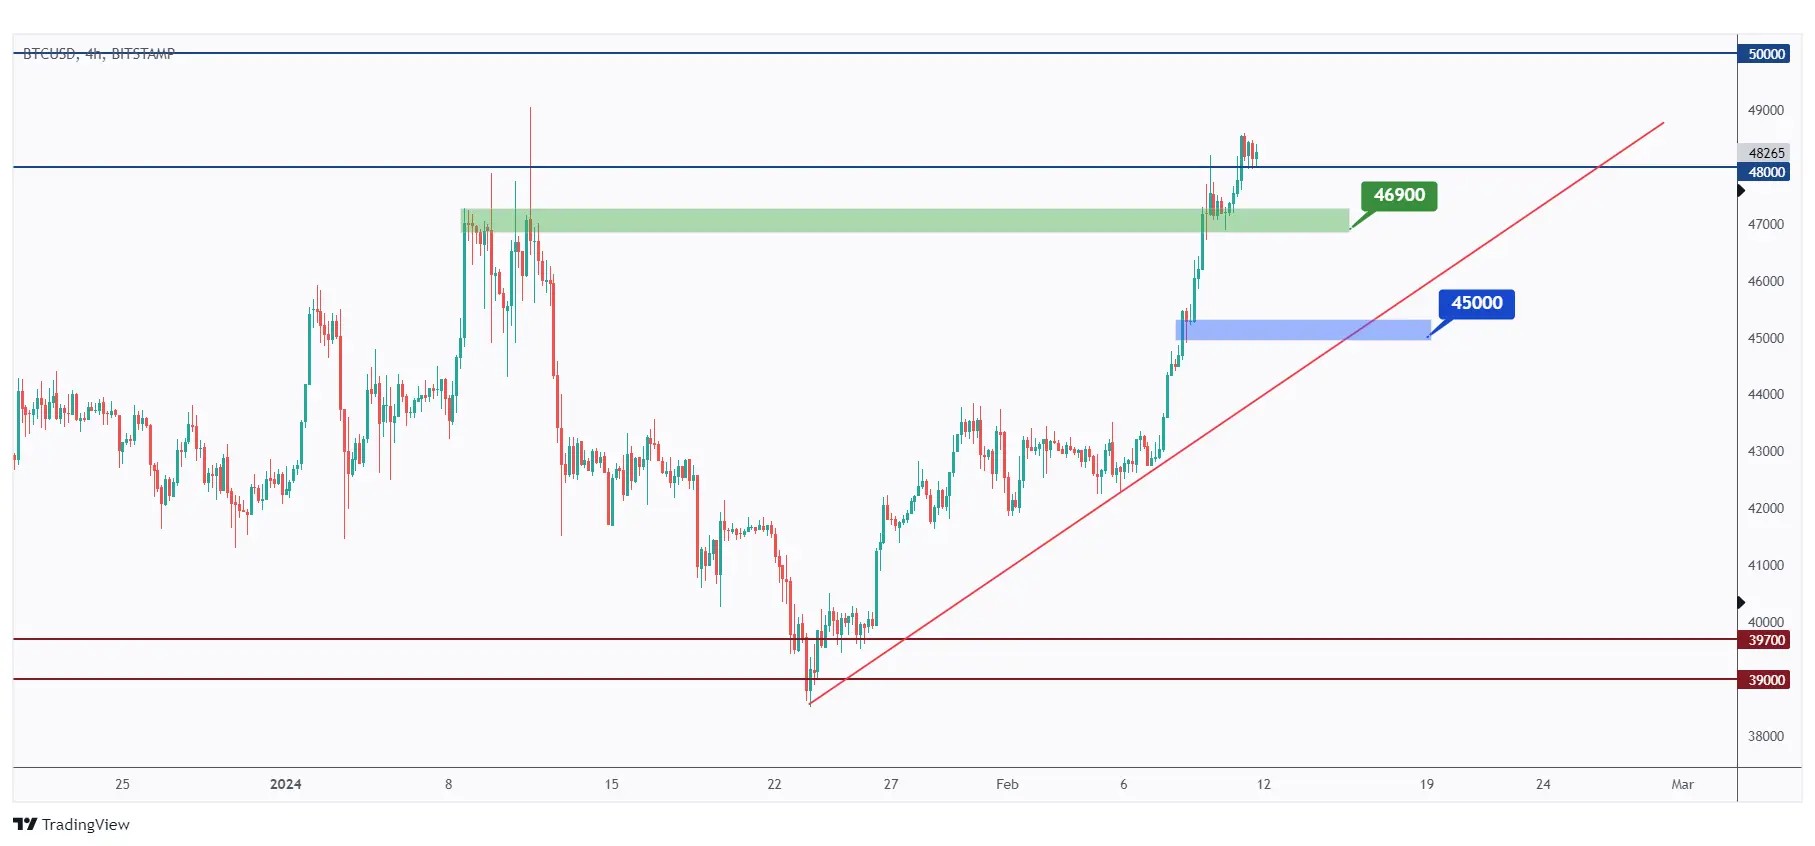
In the 4-hour timeframe, for the bears to take control and initiate the correction phase, a break below the last major low highlighted in green at $46,900 is required.
In such a scenario, a movement towards the red trendline and the $45,000 demand zone would be anticipated.
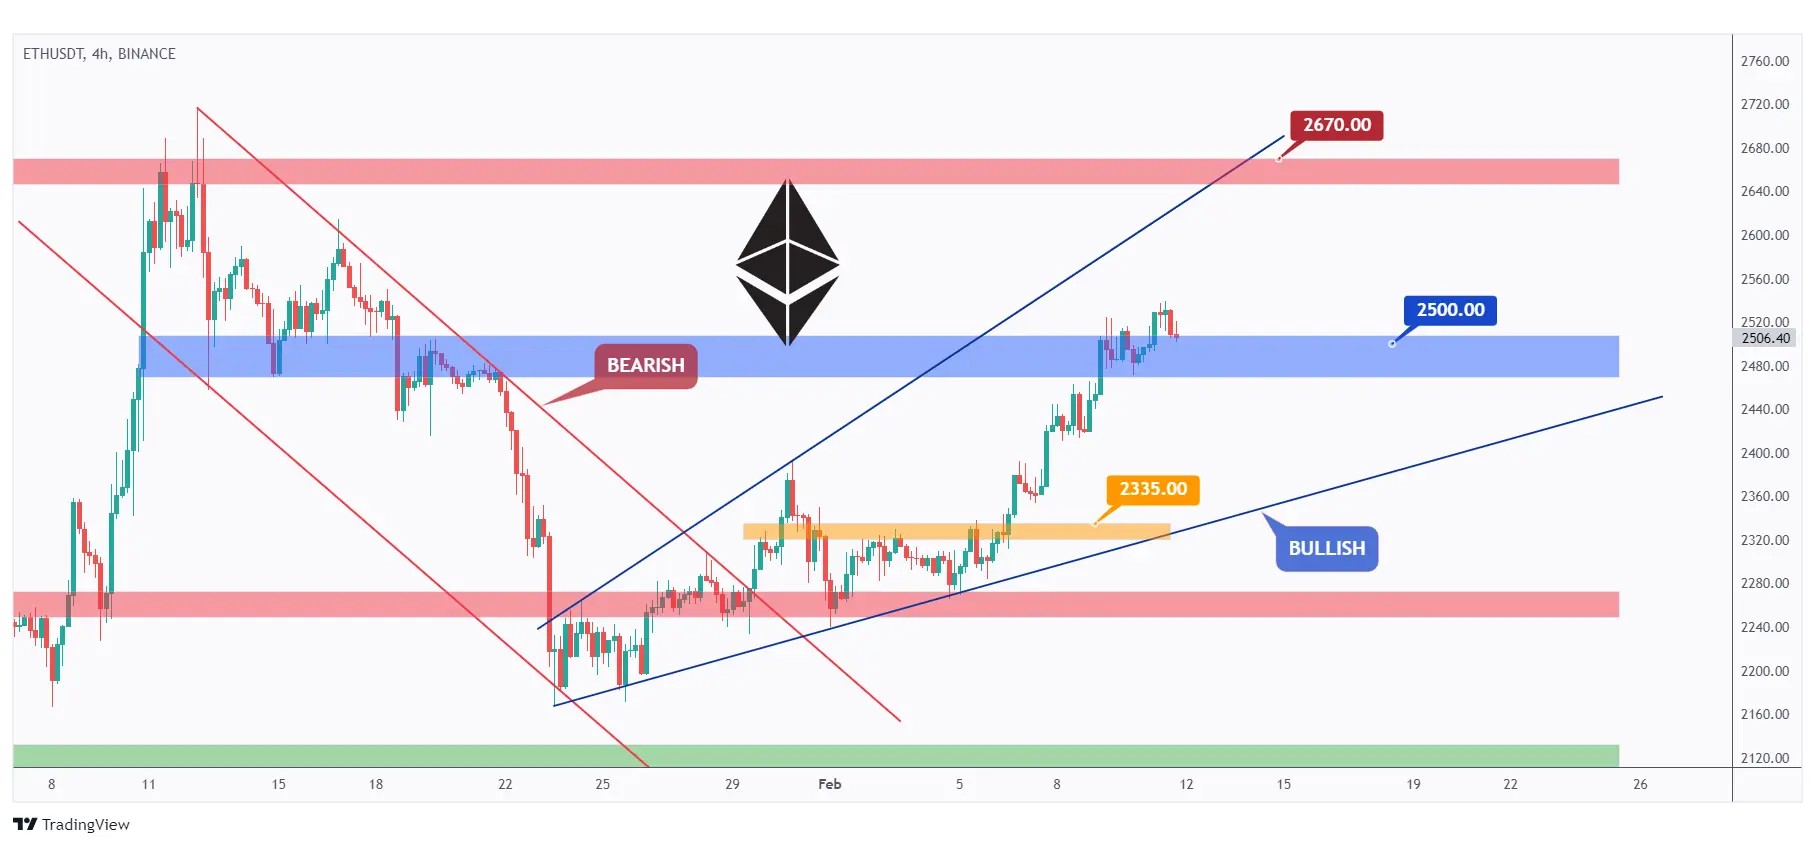
After breaking above the last major high at $2335, ETH continued to trade higher and is currently hovering around the $2500 supply zone.
As long as the $2500 level remains intact, we anticipate further upward movement towards the upper boundary of the blue wedge pattern, approximately around $2670.
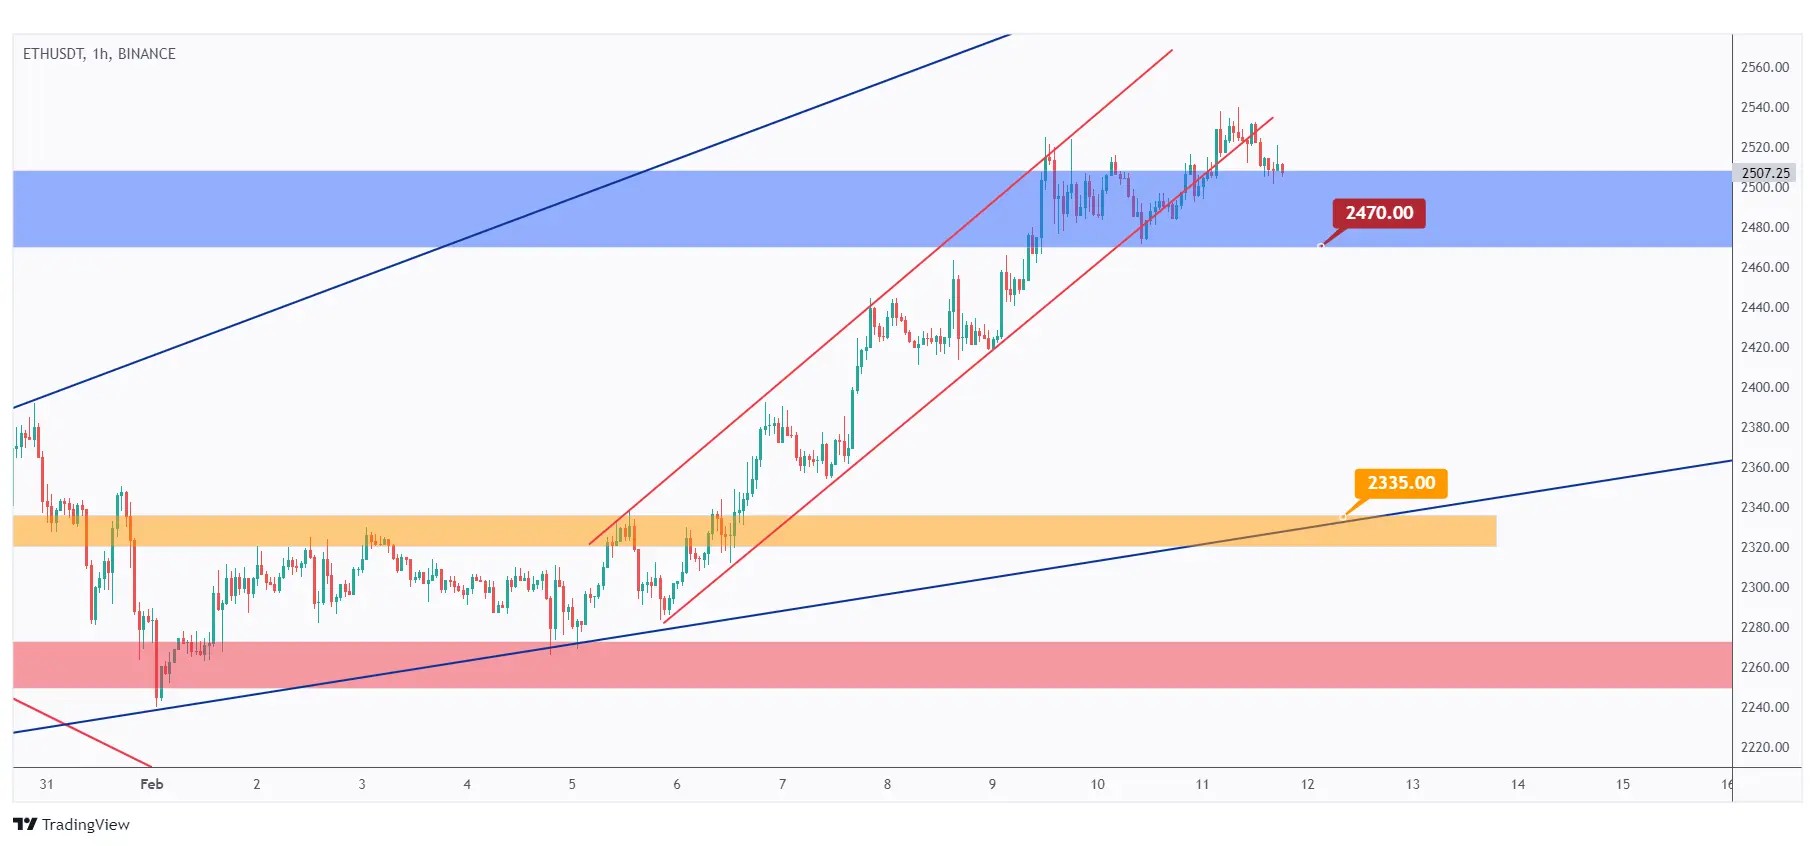
In the 1-hour timeframe, ETH is overall bullish trading within the rising channel marked in red.
The bulls will remain in control unless the previous major low at $2470 is broken downward. If such an event occurs, a movement towards $2335 would be anticipated.
Quotes / Advices
Trading is like an extreme sport because it's fast-paced and intense.
Traders need to make quick decisions, just like athletes facing tough challenges.
Both require strong nerves and smart planning. Success feels amazing, but mistakes can be costly.
Just as in extreme sports, there's little room for error, and the outcome can be either thrilling or disappointing.
Closing Remarks
In summary, this outlook encompasses a review of the cryptocurrency market's heatmap and Fear & Greed Index.
The Fear & Greed Index maintains a "Greed" sentiment, reflecting positive market outlook post-Bitcoin ETF approval and ahead of the halving event.
Traditional market analysis includes the US500 index showing bullish tendencies, yet nearing resistance levels.
DXY suggests a possible upward movement, influencing BTC/USD dynamics.
Gold remains bullish but may face a test at the $2000 support level.
USDT.D's rejection at 6.5% resistance indicates potential bearish momentum.
BTC is consolidating, awaiting a breakout for bullish momentum, while ETH trades within defined support and resistance levels, focusing on the $2100 support level.